Etiological Spectrum and Comorbidity Burden Among Patients with End-Stage Renal Disease on Maintenance Hemodialysis.
- Dr. Prashant Tukaram Gajbhare , Associate Professor, Department of General Medicine, Government Medical College & Hospital, Chh. Sambhajinagar, Maharashtra, INDIA.
- Dr. Suraj Dipakrao Godam , Assistant Professor, Department of General Medicine, Government Medical College & Hospital, Chh. Sambhajinagar, Maharashtra, INDIA.
- Dr. Vinod Mlleshwar Mahure , Junior Resident III, Department of General Medicine, Government Medical College & Hospital, Chh. Sambhajinagar, Maharashtra, INDIA.
Article Information:
Abstract:
Background: End-stage renal disease requires kidney replacement therapy, commonly maintenance hemodialysis. Local information on patients’ sociodemographic characteristics, clinical presentation and laboratory profile can help describe the population receiving this care. Aim: To assess the clinical and sociodemographic profile of patients with end-stage renal disease undergoing maintenance hemodialysis at a tertiary-care hospital. Methods: A prospective cross-sectional observational study was conducted in the Department of General Medicine, Government Medical College, Chhatrapati Sambhajinagar, over 18 months. A total of 120 adults aged 18 years or older who had received maintenance hemodialysis for at least three months were enrolled consecutively. Data were collected through interview, clinical examination and review of medical records and investigation reports. Categorical variables were summarized as frequencies and percentages; continuous variables were reported as means with standard deviations or medians with interquartile ranges, as appropriate. Results: The mean age was 53.93 years (SD 15.17), and 63 participants (52.5%) were male. Diabetes mellitus was reported in 73 (60.8%) and hypertension history in 91 (75.8%). Diabetic nephropathy was the leading recorded cause of ESRD (73; 60.8%), followed by hypertensive nephropathy (35; 29.2%). Oliguria was present in 82 participants (68.3%), pedal edema in 77 (64.2%) and breathlessness in 72 (60.0%). Ninety-three participants (77.5%) reported regular erythropoietin use. Median hemoglobin was 8.55 g/dL (IQR 2.6), and mean serum creatinine was 11.17 mg/dL (SD 3.15). Imaging findings were not available in the reported results. Conclusion: Diabetes and hypertension were common among participants, with diabetic nephropathy the leading recorded etiology. Oliguria, pedal edema and breathlessness were frequent clinical findings. The results describe the profile of patients attending one tertiary-care dialysis unit; imaging findings and longitudinal outcomes were not available.
Keywords:
Article :
INTRODUCTION:
Chronic kidney disease (CKD) is a major non-communicable disease associated with substantial morbidity, premature mortality and health-care expenditure. Its burden has increased globally, with diabetes mellitus and hypertension contributing importantly to disease progression.[1] CKD may progress to kidney failure, when kidney function is no longer sufficient to maintain health and kidney replacement therapy such as hemodialysis, peritoneal dialysis or transplantation is required. [2] Maintenance hemodialysis supports survival but involves repeated treatment and ongoing clinical monitoring. Patients may experience anemia, fluid overload, hypertension, cardiovascular disease, electrolyte and mineral abnormalities, and symptoms affecting multiple organ systems.
In India, kidney failure and dialysis care present important public-health and service-delivery challenges. The number of people requiring kidney replacement therapy is difficult to establish precisely because comprehensive national registration has been limited, and access to dialysis varies across regions and health-care settings. [3] Indian studies have reported variation in patients’ demographic characteristics, causes of kidney failure, dialysis practices and associated clinical problems. [4,5] These features may also differ between individual tertiary-care centres according to referral patterns and the population served.
A detailed clinical and sociodemographic profile can help describe who is receiving maintenance hemodialysis, the underlying causes and comorbidities, and the clinical manifestations encountered in routine care. Such information may assist clinicians in identifying common needs, planning investigations and supportive care, and understanding the local dialysis population. The present study therefore assessed the clinical and sociodemographic profile of patients with end-stage renal disease undergoing maintenance hemodialysis at a tertiary-care hospital.
AIM
To assess the clinical and sociodemographic profile of patients with end-stage renal disease undergoing maintenance hemodialysis at a tertiary-care hospital.
OBJECTIVES
1. To describe the sociodemographic characteristics of patients with end-stage renal disease undergoing maintenance hemodialysis.
2. To document the clinical presentation, comorbidities and etiology of end-stage renal disease in the study participants.
To assess the hematological, biochemical and relevant imaging findings of the study participants.
MATERIALS AND METHODS:
Source of data
Data were obtained from eligible patients attending the hemodialysis unit, through patient interviews and clinical examination, and from their hospital case records, laboratory reports and available imaging records.
Study design
The study was conducted as a prospective cross-sectional observational study. Information was collected during the study period without intervention, randomization or follow-up-based outcome assessment.
Study location
The study was carried out in the Department of General Medicine, Government Medical College, Chhatrapati Sambhajinagar, a tertiary-care teaching hospital with a maintenance hemodialysis unit.
Study duration
The study was conducted over 18 months. The attached dissertation specifies the duration but does not give exact start and end dates; these should be added if required by the institutional format.
Sample size and sampling
A total of 120 patients were included. The attached dissertation describes consecutive enrollment of the accessible eligible patients and states that a formal sample-size calculation was not undertaken. To provide the requested formula, the following precision-based calculation may be included as a statistical justification, provided these assumptions are acceptable for the approved protocol:
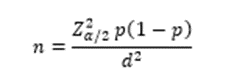
Using a 95% confidence level ( ), an assumed prevalence of 50% ( , selected where no reliable prior estimate was available) and an absolute precision of 9% ( ):

The sample was rounded to 120 participants. This formula is a calculated justification; the attached dissertation itself reports consecutive inclusion of all accessible eligible patients rather than an a priori formula-based sample size.
Inclusion criteria
· Patients aged 18 years or older who had end-stage renal disease and were undergoing maintenance hemodialysis.
· Patients who had received hemodialysis for at least three months.
· Patients who provided written informed consent.
Exclusion criteria
· Patients receiving hemodialysis for less than three months.
· Patients undergoing dialysis for acute kidney injury.
· Patients unwilling or unable to provide informed consent.
· Patients with incomplete clinical or investigation records.
Procedure and methodology
After Institutional Ethics Committee approval, eligible patients were identified in the hemodialysis unit and the study purpose and procedures were explained to them. Written informed consent was obtained before enrolment. A structured interview was conducted to obtain demographic details, relevant medical history, presenting symptoms, comorbidities, duration of end-stage renal disease and hemodialysis, and dialysis schedule. General and systemic examinations were performed and findings were recorded on a structured proforma.
Relevant clinical records, laboratory results and available imaging reports were reviewed. The documented parameters included the cause of end-stage renal disease, associated diabetes mellitus and hypertension, clinical features, hematological and biochemical findings, electrocardiography, echocardiography and chest radiography findings, where available. Estimated glomerular filtration rate was calculated using the MDRD equation as specified in the attached dissertation. The study was observational; no study-directed treatment or additional investigation was performed.
Sample processing
No separate biological specimen was collected for research purposes. Routine blood and other investigations performed as part of the patients’ clinical care were processed by the hospital laboratory according to its standard procedures. Available investigation values were abstracted from laboratory reports and patient records and entered into the study proforma. No additional blood draw or laboratory processing was undertaken solely for the study.
Statistical methods
Data were compiled in Microsoft Excel and analysed using the SPSS trial version, as reported in the dissertation. Categorical variables were summarized as frequencies and percentages. Continuous variables were summarized as mean and standard deviation or, where appropriate, median and interquartile range. For comparisons across participant subgroups, categorical data were analysed using the chi-square test or Fisher’s exact test, and continuous data using the independent-samples t test or the corresponding non-parametric test, as appropriate. A two-sided p value below 0.05 was considered statistically significant.
Data collection
Data were collected using a predesigned structured proforma. Sociodemographic information was obtained by interview; clinical history and examination findings were documented directly; and laboratory, imaging and relevant past medical information were abstracted from case files and hospital records. Entries were checked against their source documents for completeness and accuracy. Identifying information was kept confidential, and the analysis dataset was anonymized.
Methodology note: The attached dissertation’s methods section describes descriptive analysis, but its results also report subgroup tests and regression analyses. The statistical-methods paragraph above includes comparison tests to align the proposed methods with those analyses; retain only the procedures that were actually used in the study.
RESULTS:
Table 1. Summary clinical and sociodemographic profile of participants (N=120)
|
Characteristic |
Value |
95% CI |
|
Age, years, mean (SD) |
53.93 (15.17) |
51.19-56.67 |
|
Male participants, n (%) |
63 (52.5) |
43.6-61.2% |
|
Diabetes mellitus, n (%) |
73 (60.8) |
51.9-69.1% |
|
Hypertension history, n (%) |
91 (75.8) |
67.4-82.6% |
|
Diabetic nephropathy, n (%) |
73 (60.8) |
51.9-69.1% |
|
Pedal edema, n (%) |
77 (64.2) |
55.3-72.2% |
|
Breathlessness, n (%) |
72 (60.0) |
51.1-68.3% |
|
Oliguria, n (%) |
82 (68.3) |
59.6-76.0% |
Among 120 participants, the mean age was 53.93 years (SD 15.17; 95% CI 51.19-56.67), and 63 (52.5%; 95% CI 43.6-61.2%) were male. Diabetes mellitus was present in 73 participants (60.8%; 95% CI 51.9-69.1%), while 91 (75.8%; 95% CI 67.4-82.6%) had a history of hypertension. Diabetic nephropathy was recorded in 73 participants (60.8%; 95% CI 51.9-69.1%). Pedal edema, breathlessness and oliguria were reported in 77 (64.2%), 72 (60.0%) and 82 (68.3%) participants, respectively. As this table presents descriptive data for one group, no test statistic or p value was applicable.
Table 2. Sociodemographic characteristics of participants (N=120)
|
Characteristic |
Category/value |
n (%) or mean (SD) |
95% CI |
|
Age, years |
Mean (SD) |
53.93 (15.17) |
51.19-56.67 |
|
Age group, years |
21-30 |
9 (7.5) |
4.0-13.6% |
|
31-40 |
18 (15.0) |
9.7-22.5% |
|
|
41-50 |
24 (20.0) |
13.8-28.0% |
|
|
51-60 |
24 (20.0) |
13.8-28.0% |
|
|
61-70 |
24 (20.0) |
13.8-28.0% |
|
|
71-80 |
21 (17.5) |
11.7-25.3% |
|
|
Sex |
Female |
57 (47.5) |
38.8-56.4% |
|
Male |
63 (52.5) |
43.6-61.2% |
|
|
Education |
Graduate |
23 (19.2) |
13.1-27.1% |
|
High school |
18 (15.0) |
9.7-22.5% |
|
|
Illiterate |
19 (15.8) |
10.4-23.4% |
|
|
Intermediate |
12 (10.0) |
5.8-16.7% |
|
|
Middle school |
15 (12.5) |
7.7-19.6% |
|
|
Primary school |
15 (12.5) |
7.7-19.6% |
|
|
Professional education |
18 (15.0) |
9.7-22.5% |
|
|
Occupation |
Professional |
15 (12.5) |
7.7-19.6% |
|
Semi-skilled worker |
13 (10.8) |
6.3-17.7% |
|
|
Semiprofessional |
18 (15.0) |
9.7-22.5% |
|
|
Shop/farm/clerical |
19 (15.8) |
10.4-23.4% |
|
|
Skilled worker |
15 (12.5) |
7.7-19.6% |
|
|
Unemployed |
17 (14.2) |
9.0-21.5% |
|
|
Unskilled worker |
23 (19.2) |
13.1-27.1% |
|
|
Family type |
Joint |
40 (33.3) |
25.5-42.2% |
|
Nuclear |
37 (30.8) |
23.3-39.6% |
|
|
Three-generation |
43 (35.8) |
27.8-44.7% |
|
|
Socioeconomic class |
Class I |
66 (55.0) |
46.1-63.6% |
|
Class II |
34 (28.3) |
21.0-37.0% |
|
|
Class III |
19 (15.8) |
10.4-23.4% |
|
|
Class IV |
1 (0.8) |
0.1-4.6% |
|
|
Total family income, INR/month |
Mean (SD) |
48,608.34 (21,105.20) |
44,793.42-52,423.26 |
|
Per-capita income, INR/month |
Mean (SD) |
10,611.23 (6,913.81) |
9,361.51-11,860.95 |
Participants had a mean age of 53.93 years (SD 15.17; 95% CI 51.19-56.67). The largest age groups were 41-50, 51-60 and 61-70 years, each comprising 24 participants (20.0%). There were 63 males (52.5%) and 57 females (47.5%). Graduates formed the largest educational category (23; 19.2%), while 12 participants (10.0%) had intermediate education. Unskilled workers were the most common occupational group (23; 19.2%); 17 participants (14.2%) were unemployed. Three-generation families accounted for 43 participants (35.8%), followed by joint families (40; 33.3%) and nuclear families (37; 30.8%). According to the reported BG Prasad classification, 66 participants (55.0%) were in Class I and 34 (28.3%) in Class II. Mean monthly total family income was INR 48,608.34 (SD 21,105.20; 95% CI 44,793.42-52,423.26), and mean per-capita income was INR 10,611.23 (SD 6,913.81; 95% CI 9,361.51-11,860.95). No significance test or p value applied to these descriptive distributions.
Table 3. Clinical presentation, comorbidities, etiology and dialysis profile (N=120)
|
Characteristic |
Category |
n (%) |
95% CI |
|
Comorbidity |
Diabetes mellitus |
73 (60.8) |
51.9-69.1% |
|
Hypertension history |
91 (75.8) |
67.4-82.6% |
|
|
Etiology of ESRD |
Diabetic nephropathy |
73 (60.8) |
51.9-69.1% |
|
Hypertensive nephropathy |
35 (29.2) |
21.8-37.8% |
|
|
Autosomal dominant polycystic kidney disease |
4 (3.3) |
1.3-8.3% |
|
|
Chronic glomerulonephritis |
4 (3.3) |
1.3-8.3% |
|
|
Unknown |
4 (3.3) |
1.3-8.3% |
|
|
Clinical findings |
Pedal edema |
77 (64.2) |
55.3-72.2% |
|
Breathlessness |
72 (60.0) |
51.1-68.3% |
|
|
Oliguria |
82 (68.3) |
59.6-76.0% |
|
|
Hypertension on clinical examination |
107 (89.2) |
82.3-93.6% |
|
|
Duration of ESRD, years |
1 |
19 (15.8) |
10.4-23.4% |
|
2 |
14 (11.7) |
7.0-18.6% |
|
|
3 |
11 (9.2) |
5.2-15.7% |
|
|
4 |
8 (6.7) |
3.4-12.6% |
|
|
5 |
16 (13.3) |
8.3-20.6% |
|
|
6 |
17 (14.2) |
9.0-21.5% |
|
|
7 |
16 (13.3) |
8.3-20.6% |
|
|
8 |
19 (15.8) |
10.4-23.4% |
|
|
Duration of hemodialysis, years |
1 |
42 (35.0) |
27.1-43.9% |
|
2 |
26 (21.7) |
15.3-29.9% |
|
|
3 |
20 (16.7) |
10.9-24.3% |
|
|
4 |
8 (6.7) |
3.4-12.6% |
|
|
5 |
9 (7.5) |
4.0-13.6% |
|
|
6 |
6 (5.0) |
2.3-10.5% |
|
|
7 |
6 (5.0) |
2.3-10.5% |
|
|
8 |
3 (2.5) |
0.9-7.1% |
|
|
Dialysis hours per week |
8 hours |
58 (48.3) |
39.6-57.2% |
|
12 hours |
62 (51.7) |
42.8-60.4% |
|
|
Regular erythropoietin use |
Yes |
93 (77.5) |
69.2-84.1% |
|
No |
27 (22.5) |
15.9-30.8% |
Diabetes mellitus was present in 73 participants (60.8%), and 91 (75.8%) had a history of hypertension. Diabetic nephropathy was the most frequently recorded etiology of end-stage renal disease (73; 60.8%), followed by hypertensive nephropathy (35; 29.2%). Autosomal dominant polycystic kidney disease, chronic glomerulonephritis and unknown etiology were each recorded in four participants (3.3%). On clinical assessment, hypertension was noted in 107 participants (89.2%), oliguria in 82 (68.3%), pedal edema in 77 (64.2%) and breathlessness in 72 (60.0%). The most common reported duration of hemodialysis was one year (42; 35.0%); 62 participants (51.7%) received 12 dialysis hours per week, and 93 (77.5%) reported regular erythropoietin use. No test statistic or p value was applicable to these single-group descriptive findings.
Table 4. Hematological, biochemical and reported imaging findings (N=120)
|
Parameter |
Result |
|
Hematological |
|
|
Hemoglobin, g/dL, median (IQR) |
8.55 (2.6) |
|
Biochemical |
|
|
Serum potassium, mEq/L, median (IQR) |
5.30 (1.1) |
|
Serum calcium, mg/dL, median (IQR) |
9.15 (1.2) |
|
Serum phosphorus, mg/dL, median (IQR) |
5.90 (1.9) |
|
Serum urea, mg/dL, median (IQR) |
208.00 (78) |
|
Estimated GFR, mL/min/1.73 m², median (IQR) |
4.35 (2.7) |
|
Serum sodium, mEq/L, mean (SD) |
139.06 (5.49) |
|
Serum uric acid, mg/dL, mean (SD) |
7.29 (1.26) |
|
Serum creatinine, mg/dL, mean (SD) |
11.17 (3.15) |
The median hemoglobin concentration was 8.55 g/dL (IQR 2.6). Median serum potassium was 5.30 mEq/L (IQR 1.1), calcium 9.15 mg/dL (IQR 1.2), phosphorus 5.90 mg/dL (IQR 1.9), serum urea 208 mg/dL (IQR 78) and estimated GFR 4.35 mL/min/1.73 m² (IQR 2.7). The reported means were 139.06 mEq/L (SD 5.49; 95% CI 138.07-140.05) for serum sodium, 7.29 mg/dL (SD 1.26; 95% CI 7.06-7.52) for serum uric acid and 11.17 mg/dL (SD 3.15; 95% CI 10.60-11.74) for serum creatinine.
DISCUSSION:
Table 1. Summary clinical and sociodemographic profile
The study population had a mean age of 53.93 years, with a slight male predominance (52.5%). This age profile was broadly comparable to that reported by Lakshminarayana et al. (2017) [1], whose Kerala cohort had a mean age of 59.83 years; the male predominance in that cohort was greater, with a male-to-female ratio of approximately 2:1. Kumar et al. (2021) [2] also found that most patients in their Delhi study were aged 41-60 years. Differences in age and sex distributions across studies may reflect variations in referral patterns, dialysis access and the populations served. The present cohort’s near-balanced sex distribution is also relevant because Indian studies have described differences in dialysis access and related characteristics by gender.
Diabetes mellitus affected 60.8% of participants, and diabetic nephropathy was recorded as the cause of ESRD in the same proportion. Hypertension was also common, reported in 75.8% by history and documented on clinical examination in 89.2%. The high proportion of diabetic nephropathy was similar to Lakshminarayana et al. (2017) [1], who reported it in 59.7% of their Kerala cohort. In contrast, Chandrashekar et al. (2024) [5] reported hypertension as the leading cause in their tertiary-care cohort, followed by diabetes. Such differences may reflect regional case mix and differences in how the underlying cause was assigned.
Table 2. Sociodemographic characteristics
The largest age groups were 41-50, 51-60 and 61-70 years, each comprising 20.0% of participants. Graduates were the most frequent educational category (19.2%), while unskilled workers formed the largest occupational category (19.2%). More than half of the participants were classified as socioeconomic Class I (55.0%) using the reported BG Prasad scale. These findings describe the composition of this tertiary-care sample but should not be taken to represent the socioeconomic profile of all people receiving hemodialysis in India. The nationwide Indian CKD study by Kumar et al. (2022) [14] documented sociodemographic and regional variation in a broader CKD population, while Shankar et al. (2024) [3] reported gender-related differences in education and insurance among Indian patients on maintenance hemodialysis. The different study populations and settings limit direct comparisons.
Mean monthly total family income was INR 48,608.34, and mean per-capita income was INR 10,611.23. These descriptive figures provide context for the participants’ economic circumstances, but the table does not assess whether income was associated with dialysis frequency, missed sessions or clinical outcomes. Economic and service-access differences are important when interpreting local dialysis profiles because availability of kidney replacement therapy varies across settings. Bharati and Jha (2020) [8] and Thurlow et al. (2021) [9] discussed the influence of health-system and socioeconomic factors on kidney replacement therapy access internationally and in India.
Table 3. Clinical presentation, comorbidities, etiology and dialysis profile
Diabetic nephropathy was the leading recorded etiology (60.8%), followed by hypertensive nephropathy (29.2%). This pattern closely resembled the Kerala findings of Lakshminarayana et al. (2017) [1], whereas a study from Chennai by Chandrashekar et al. (2024) [5] reported hypertension more often as the primary cause. The differing distributions emphasize that findings from one hospital should be interpreted in their local clinical context. Conjeevaram et al. (2022) [4] likewise described variation in dialysis-service and patient profiles across centres in Karnataka.
Oliguria (68.3%), pedal edema (64.2%) and breathlessness (60.0%) were frequent clinical findings. These symptoms are compatible with the multisystem burden and fluid-related manifestations often encountered in advanced kidney failure. Rajbhandari et al. (2022) [6] and Agrawaal (2022) [7] also described clinical and biochemical profiles among patients receiving hemodialysis at tertiary-care centres in Nepal. However, differences in eligibility criteria, local treatment practices and whether studies included all patients receiving dialysis or only those on maintenance treatment limit numerical comparisons.
Participants were distributed between 8 and 12 dialysis hours per week, and 77.5% reported regular erythropoietin use. The Kerala study reported that most participants were receiving twice-weekly hemodialysis [1], and Mendonca et al. (2021) [13] discussed twice-weekly schedules in the Indian context. Because the present table reports hours per week rather than the number and duration of sessions, it cannot establish whether participants followed a particular dialysis-frequency regimen.
Table 4. Hematological, biochemical and imaging findings
The median hemoglobin was 8.55 g/dL, and regular erythropoietin use was reported in 77.5% of participants. Together, these results indicate that anemia was an important feature of this cohort, although the available summaries do not show individual hemoglobin values or treatment response. Anemia assessment and management are recognized components of care for people with CKD, including those receiving hemodialysis.
Median serum phosphorus was 5.90 mg/dL, while mean serum creatinine was 11.17 mg/dL and median estimated GFR was 4.35 mL/min/1.73 m². These results describe the laboratory profile reported for this maintenance-hemodialysis cohort; they should be interpreted in light of the timing of testing relative to dialysis and the fact that the source presents some values as medians and others as means. KDIGO guidance addresses assessment and management of CKD complications, while the Indian dialysis-practice study by Kulkarni et al. (2015) [12] also documented anemia and mineral-bone parameters as relevant areas of dialysis care.
Although ECG, echocardiography and chest radiography were mentioned in the dissertation methodology, their findings were not tabulated. Consequently, the study results available here do not support conclusions about cardiovascular or radiographic abnormalities, nor comparison of those findings with other cohorts. Large-scale Indian dialysis studies have also reported variation in patient characteristics and outcomes between centres, reinforcing the importance of clearly reporting investigations and service context.
CONCLUSION:
This single-centre study described 120 adults with end-stage renal disease receiving maintenance hemodialysis. Participants had a mean age of 53.93 years and a slight male predominance. Diabetes and hypertension were common, with diabetic nephropathy the leading recorded cause of ESRD. Oliguria, pedal edema and breathlessness were frequent, and the reported laboratory profile included a median hemoglobin of 8.55 g/dL. These findings provide a local clinical and sociodemographic snapshot of patients receiving maintenance hemodialysis. Imaging findings were not available in the reported results, and the descriptive design does not establish associations or causes.
Limitations
· The study was conducted at a single tertiary-care hospital, so the findings may not represent patients receiving dialysis in other settings.
· The sample comprised 120 participants and used consecutive enrolment; selection and referral patterns may have influenced the profile observed.
· The cross-sectional design provided a snapshot and could not assess changes over time, treatment response, survival or other outcomes.
· The study was descriptive; it did not establish whether sociodemographic or clinical characteristics were associated with one another.
· The reported etiological categories may depend on the completeness and accuracy of medical records and previous investigations.
· Some laboratory results were summarized as medians and others as means, limiting direct comparison across parameters and with other studies.
· ECG, echocardiography and chest radiography were mentioned in the methods, but their results were not tabulated.
· The provided results do not specify the timing of laboratory sampling relative to hemodialysis, which may affect interpretation of some values.
REFERENCES:
1. Lakshminarayana GR, Sheetal LG, Mathew A, Rajesh R, Kurian G, Unni VN. Hemodialysis outcomes and practice patterns in end-stage renal disease: experience from a tertiary care hospital in Kerala. Indian J Nephrol. 2017;27(1):51-7.
2. Kumar M, Saini S, Parashar L, Chetiwal R, Kalra T, Kalra N. Clinical profile of hemodialysis patients attending a tertiary care hospital in Delhi, India. Int J Community Med Public Health. 2021;8(12):6000-5.
3. Shankar M, Sankarasubaiyan S, Kasiviswanathan S, Shah KD, Luyckx V. Gender disparity in hemodialysis practices and mortality: a nationwide cross-sectional observational study. Indian J Nephrol. 2024;34(6):609-16.
4. Conjeevaram A, Anupama YJ, Vincent L, Sastry NB, Siddini V, Revanasiddappa M, et al. Clinico-epidemiological profile of dialysis services in Karnataka, India: a multicentric exploratory study. Indian J Nephrol. 2022;32(3):223-32.
5. Chandrashekar NG, Iyer Murali NV, Yogesh S, Mohammed AI, Hemachandran D, Narendran K, et al. Comprehensive clinical profile and hemodialysis outcomes in patients attending a tertiary care hospital. Cureus. 2024;16(8):e66816.
6. Rajbhandari A, Bhusal U, Shrestha DB, Yadav J, Singh S, Pant C, et al. End-stage renal disease among patients undergoing haemodialysis at a tertiary care centre: a descriptive cross-sectional study. J Nepal Med Assoc. 2022;60(249):448-52.
7. Agrawaal KK. Maintenance hemodialysis among patients visiting nephrology unit in a tertiary care centre: a descriptive cross-sectional study. J Nepal Med Assoc. 2022;60(255):931-4.
8. Bharati J, Jha V. Global dialysis perspective: India. Kidney360. 2020;1(10):1143-7.
9. Thurlow JS, Joshi M, Yan G, Norris KC, Agodoa LY, Yuan CM, et al. Global epidemiology of end-stage kidney disease and disparities in kidney replacement therapy. Am J Nephrol. 2021;52(2):98-107.
10. GBD Chronic Kidney Disease Collaboration. Global, regional, and national burden of chronic kidney disease, 1990-2017: a systematic analysis for the Global Burden of Disease Study 2017. Lancet. 2020;395(10225):709-33.
11. Kidney Disease: Improving Global Outcomes (KDIGO) CKD Work Group. KDIGO 2024 clinical practice guideline for the evaluation and management of chronic kidney disease. Kidney Int. 2024;105(4 Suppl):S117-314.
12. Kulkarni MJ, Jamale T, Hase NK, Jagdish PK, Keskar V, Patil H, et al. A cross-sectional study of dialysis practice-patterns in patients with chronic kidney disease on maintenance hemodialysis. Saudi J Kidney Dis Transpl. 2015;26(5):1050-6.
13. Mendonca S, Bhardwaj S, Sreenivasan S, Gupta D. Is twice-weekly maintenance hemodialysis justified? Indian J Nephrol. 2021;31(1):27-32.
14. Kumar V, Yadav AK, Sethi J, Ghosh A, Sahay M, Prasad N, et al. The Indian Chronic Kidney Disease (ICKD) study: baseline characteristics. Clin Kidney J. 2022;15(1):60-9.
15. Hockham C, Ghosh A, Agarwal A, Shah K, Woodward M, Jha V. Centre-level variation in the survival of patients receiving haemodialysis in India: findings from a nationwide private haemodialysis network. Lancet Reg Health Southeast Asia. 2024;23:100383.
16. Indian Society of Nephrology Anemia Guideline Group. Anemia of chronic kidney disease in India: consensus guidelines of Indian Society of Nephrology. Indian J Nephrol. 2025;35(Suppl 2):S1-31.
17. GBD 2023 Kidney Failure with Replacement Therapy Collaborators. Global, regional, and national prevalence of kidney failure with replacement therapy and associated aetiologies, 1990-2023: a systematic analysis for the Global Burden of Disease Study 2023. Lancet Glob Health. 2025;13(8):e1378-95.