Association Between Glycated Hemoglobin Variability and Microalbuminuria in Patients with Type 2 Diabetes Mellitus: A Hospital-Based Prospective Longitudinal Study.
- Ankit Abhishek , Senior Resident, Department of General Medicine, R.I.M.S, Ranchi, Jharkhand, India
- Dr. Reema Verma , Junior Resident, Department of Obs & gynae, R.I.M.S, Ranchi, Jharkhand, India
- Dr. Rishi Tuhin Guria , Additional Professor, Department of General Medicine, R.I.M.S, Ranchi, Jharkhand, India.
Article Information:
Abstract:
Background: Microalbuminuria is an early marker of diabetic nephropathy in type 2 diabetes mellitus (T2DM). Emerging evidence suggests that glycated hemoglobin (HbA1c) variability may influence renal injury independently of mean glycemic control. Objective: To evaluate the association between HbA1c variability and microalbuminuria among patients with T2DM. Methods: A hospital-based prospective longitudinal study was conducted at RIMS Ranchi, Jharkhand from 15 November 2024 to 14 November 2025. Two hundred T2DM patients were included. HbA1c variability was assessed using standard deviation (SD) and coefficient of variation (CV) of three consecutive HbA1c measurements obtained at approximately 3–6-month intervals during the study period. Urinary albumin-creatinine ratio (UACR) identified microalbuminuria. Associations were analyzed using t-tests, chi-square, Pearson correlation, and logistic regression. Results: Microalbuminuria was present in 78/200 (39%) patients. Mean HbA1c was 8.2±1.1%, and mean HbA1c variability (SD) was 0.9±0.4%. HbA1c variability correlated positively with UACR (r=0.42, p<0.001). Logistic regression revealed HbA1c variability as an independent predictor of microalbuminuria (OR=2.34, 95% CI 1.56–3.52, p<0.001). Conclusion: Higher HbA1c variability is associated with increased risk of microalbuminuria in T2DM, suggesting that both stable and optimal glycemic control are important for renal protection.
Keywords:
Article :
INTRODUCTION:
Type 2 diabetes mellitus (T2DM) is a global health challenge, with rapidly rising prevalence in developing countries.¹ Chronic hyperglycemia in T2DM contributes to microvascular complications, including nephropathy, retinopathy, and neuropathy.² Among these, diabetic kidney disease (DKD) is a leading cause of end-stage renal disease and cardiovascular mortality.³
Microalbuminuria, defined as urinary albumin excretion of 30–300 mg/g creatinine, is an early, sensitive marker of renal damage in diabetes.⁴ Early detection allows timely interventions to prevent progression to overt nephropathy.⁵
Glycated hemoglobin (HbA1c) reflects mean glycemic control over 2–3 months and is a primary target in diabetes management.⁶ Landmark trials such as DCCT and UKPDS demonstrated that lower HbA1c reduces risk of microvascular complications.⁷˒⁸ However, patients with similar mean HbA1c may differ in glycemic fluctuations over time.⁹
Glycemic variability, represented by visit-to-visit HbA1c variation, has been implicated in oxidative stress, endothelial dysfunction, and inflammation, potentially accelerating vascular and renal injury.¹⁰˒¹¹ Several studies have shown that HbA1c variability predicts cardiovascular events, retinopathy, and nephropathy independent of mean HbA1c.¹²˒¹³ Despite increasing evidence, Indian data on the relationship between HbA1c variability and microalbuminuria are limited. Understanding this association may improve risk stratification and guide individualized management.¹⁴.
MATERIALS AND METHODS:
Study Design: Hospital-based prospective longitudinal study.
Study Site: Department of Pharmacology and Medicine, RIMS Ranchi, Jharkhand
Duration: 15 November 2024 – 14 November 2025
Sample Size:
The sample size was calculated using the standard formula for prevalence studies:
n = Z²pq / d²
Where n = required sample size, Z = 1.96 at 95% confidence level, p = prevalence of microalbuminuria, q = 1 − p, and d = absolute precision.
Based on the study by Varghese et al.26, conducted among patients with type 2 diabetes mellitus in South India, the prevalence of microalbuminuria was reported to be 36.3%. Therefore, p was taken as 36.3% and q as 63.7%.
Considering a 95% confidence level and an allowable error of 7%, the sample size was calculated as:
n = (1.96)² × 0.363 × 0.637 / (0.07)²
n = 181.2
After accounting for approximately 10% non-response and incomplete data, the final sample size was increased to 200 participants.
Therefore, a total of 200 patients with type 2 diabetes mellitus were included in the study.
Inclusion Criteria:
• Age ≥18 years
• Diagnosed T2DM
• Willing to undergo three consecutive HbA1c measurements during the study period
• Provided informed consent
Exclusion Criteria:
• Type 1 diabetes
• Pregnancy
• Acute kidney injury
• ESRD or nephrotic syndrome
Data Collection:
• Demographics, duration of diabetes, BMI, BP
• Three consecutive HbA1c measurements obtained at approximately 3–6-month intervals during the study period
• Serum creatinine, eGFR, UACR
HbA1c Variability:
HbA1c variability was calculated using the standard deviation (SD) and coefficient of variation (CV) of three consecutive HbA1c measurements obtained at approximately 3–6-month intervals during the study period.
Definition of Microalbuminuria: UACR 30–300 mg/g
Statistical Analysis:
The collected data were entered into Microsoft Excel and analyzed using Statistical Package for the Social Sciences (SPSS) version 26.0 (IBM Corp., Armonk, NY, USA). Continuous variables were expressed as mean ± standard deviation (SD), while categorical variables were presented as frequencies and percentages. Comparisons between patients with and without microalbuminuria were performed using the independent samples t-test for continuous variables and the Chi-square test for categorical variables. The relationship between HbA1c variability and urinary albumin-creatinine ratio (UACR) was assessed using Pearson's correlation analysis. Variables showing significant associations in univariate analysis were further evaluated using multivariable logistic regression analysis to identify independent predictors of microalbuminuria. The strength of association was expressed as odds ratios (ORs) with 95% confidence intervals (CIs). A p-value of less than 0.05 was considered statistically significant for all analyses.
RESULTS:
Baseline Characteristics
A total of 200 patients with type 2 diabetes mellitus were included. The mean age was 55.4 ± 9.8 years, with 112 (56%) males and 88 (44%) females. The mean duration of diabetes was 8.2 ± 4.6 years. Mean body mass index (BMI) was 27.1 ± 3.5 kg/m². The mean HbA1c was 8.2 ± 1.1%, and mean HbA1c variability (SD) was 0.9 ± 0.4%. The mean urinary albumin-creatinine ratio (UACR) was 54.3 ± 36.7 mg/g. Baseline characteristics are summarized in Table 1.
Table 1. Baseline Characteristics of the Study Population
|
Variable |
Total (n=200) |
|
Age (years) |
55.4 ± 9.8 |
|
Male |
112 (56%) |
|
Female |
88 (44%) |
|
Duration of diabetes (years) |
8.2 ± 4.6 |
|
BMI (kg/m²) |
27.1 ± 3.5 |
|
Mean HbA1c (%) |
8.2 ± 1.1 |
|
HbA1c variability (SD) |
0.9 ± 0.4 |
|
UACR (mg/g) |
54.3 ± 36.7 |
Prevalence of Microalbuminuria
Microalbuminuria was observed in 78 out of 200 patients (39%). The remaining 122 patients (61%) had normal urinary albumin levels. The prevalence of microalbuminuria is depicted in Figure 1.
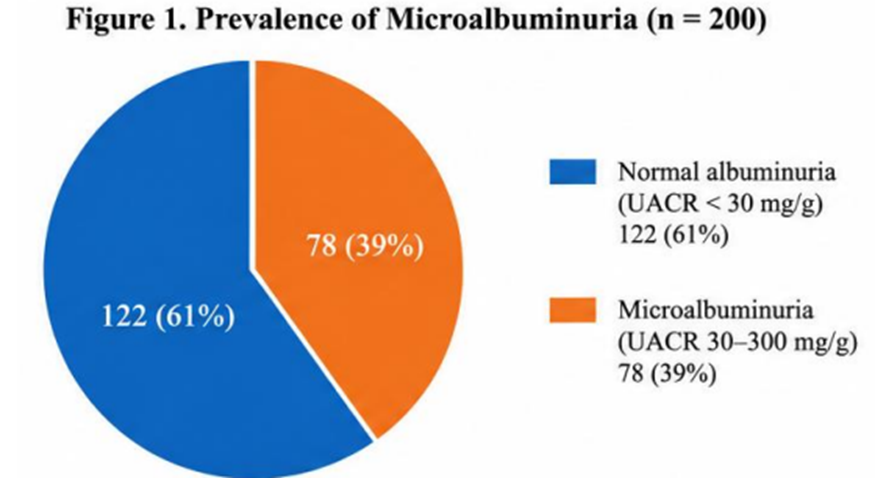
Figure 1. Prevalence of Microalbuminuria Among Study Participants
Comparison of Clinical Parameters According to Microalbuminuria Status
Patients with microalbuminuria were older, had longer duration of diabetes, higher mean HbA1c, and higher HbA1c variability compared to those without microalbuminuria. BMI was also slightly higher in the microalbuminuria group. The comparison is shown in Table 2.
Table 2. Comparison of Clinical Parameters by Microalbuminuria Status
|
Variable |
Microalbuminuria Present (n=78) |
Absent (n=122) |
p value |
|
Age (years) |
57.3 ± 9.2 |
54.1 ± 9.9 |
0.03* |
|
Duration of diabetes (years) |
9.4 ± 4.7 |
7.4 ± 4.3 |
0.002* |
|
Mean HbA1c (%) |
8.7 ± 1.2 |
7.9 ± 0.9 |
<0.001* |
|
HbA1c variability (SD) |
1.2 ± 0.4 |
0.7 ± 0.3 |
<0.001* |
|
BMI (kg/m²) |
27.8 ± 3.6 |
26.6 ± 3.3 |
0.02* |
*Significant at p<0.05
Correlation Between HbA1c Parameters and UACR
Pearson correlation analysis demonstrated a moderate positive correlation between HbA1c variability and UACR (r=0.42, p<0.001), while mean HbA1c showed a weaker positive correlation with UACR (r=0.31, p=0.001). This relationship is illustrated in Figure 2 and summarized in Table 3.
Table 3. Correlation Between HbA1c Parameters and UACR
|
Variable |
Correlation Coefficient (r) |
p value |
|
HbA1c variability (SD) vs UACR |
0.42 |
<0.001 |
|
Mean HbA1c (%) vs UACR |
0.31 |
0.001 |
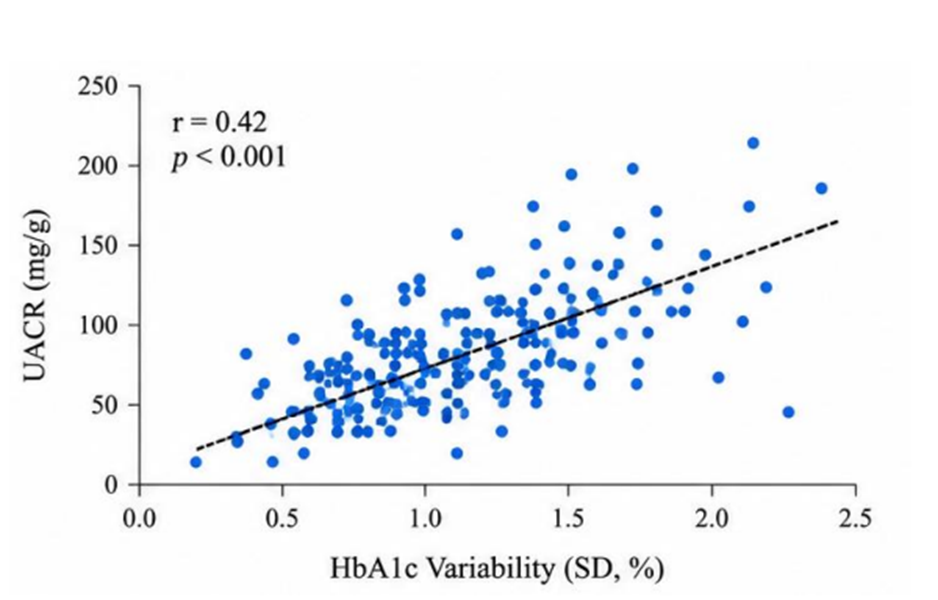
Figure 2. Scatter Plot Showing Positive Correlation Between HbA1c Variability and UACR
Multivariable Logistic Regression Analysis
After adjusting for age, duration of diabetes, mean HbA1c, and BMI, HbA1c variability remained an independent predictor of microalbuminuria (OR=2.34, 95% CI 1.56–3.52, p<0.001). Duration of diabetes (OR=1.12, 95% CI 1.03–1.21, p=0.006) and mean HbA1c (OR=1.87, 95% CI 1.21–2.91, p=0.004) were also significant predictors. Age and BMI were not significant. These results are presented in Table 4.
Table 4. Multivariable Logistic Regression for Predictors of Microalbuminuria
|
Variable |
Adjusted OR |
95% CI |
p value |
|
HbA1c variability (SD) |
2.34 |
1.56–3.52 |
<0.001 |
|
Duration of diabetes (years) |
1.12 |
1.03–1.21 |
0.006 |
|
Mean HbA1c (%) |
1.87 |
1.21–2.91 |
0.004 |
|
Age (years) |
1.03 |
0.99–1.06 |
0.11 |
|
BMI (kg/m²) |
1.07 |
0.98–1.17 |
0.12 |
Predictive Ability of HbA1c Variability
Receiver operating characteristic (ROC) analysis showed that HbA1c variability had an area under the curve (AUC) of 0.78 (95% CI 0.71–0.84), indicating good discriminatory ability for predicting microalbuminuria. The ROC curve is shown in Figure 3.
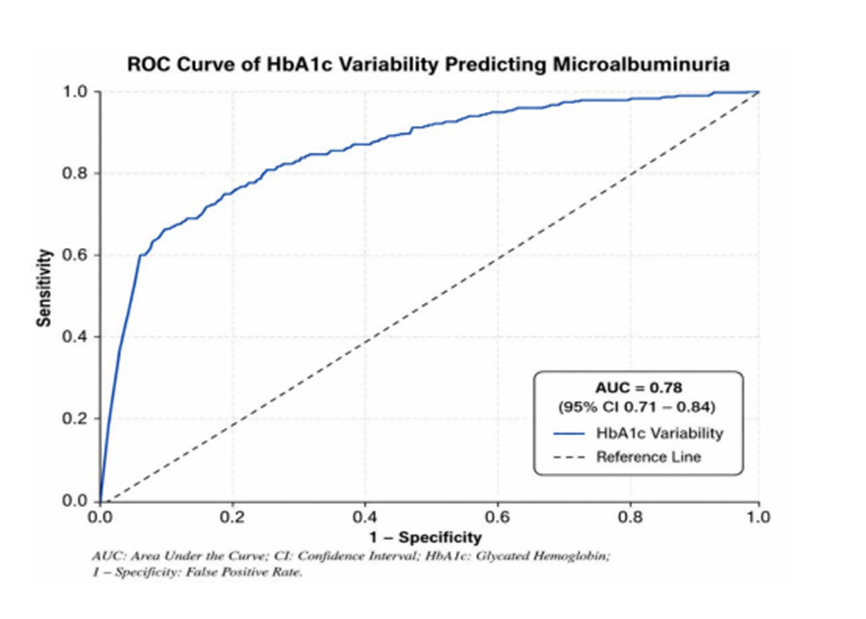
Figure 3. ROC Curve of HbA1c Variability Predicting Microalbuminuria
DISCUSSION:
In this cohort of 200 T2DM patients, microalbuminuria prevalence was 39%, consistent with previous Indian studies.¹⁵ The study demonstrated that HbA1c variability, rather than mean HbA1c alone, was independently associated with microalbuminuria, suggesting that glycemic fluctuations play a crucial role in early renal damage.
Several studies support these findings. Lee et al. observed that visit-to-visit HbA1c variability predicted microalbuminuria in Korean T2DM patients.¹⁶ Similarly, Li et al. reported that higher SD of HbA1c was associated with increased risk of nephropathy, independent of mean HbA1c.¹⁷ Dorajoo et al. demonstrated that HbA1c variability correlated with progression of microalbuminuria in Asian populations.¹⁸
The mechanisms may involve oxidative stress, endothelial dysfunction, and activation of inflammatory pathways, which exacerbate glomerular injury beyond the effect of sustained hyperglycemia.¹⁹⁻²¹ This reinforces the concept that achieving stable glycemic control is as important as lowering mean HbA1c levels.
Duration of diabetes was also a significant predictor of microalbuminuria, consistent with prior observations.²² Older age and higher mean HbA1c contributed to risk but were less strongly associated than HbA1c variability, highlighting its independent predictive value.
Clinical implications of the present study include the importance of monitoring HbA1c trends over time rather than relying solely on isolated measurements, individualizing glycemic management to minimize HbA1c variability, and implementing early screening for microalbuminuria in patients demonstrating greater glycemic fluctuations.²³ The prospective longitudinal design enabled assessment of HbA1c variability over serial measurements and its association with renal involvement; however, as an observational study, causal relationships cannot be definitively established. Larger multicenter longitudinal studies with longer follow-up are warranted to determine whether interventions aimed at reducing HbA1c variability can delay the onset or progression of diabetic kidney disease.²⁴˒²⁵.
CONCLUSION:
In this hospital-based prospective longitudinal study, higher HbA1c variability was independently associated with microalbuminuria in T2DM patients. These findings suggest that both stable and optimal glycemic control should be emphasized to reduce risk of diabetic nephropathy.
REFERENCES:
1. International Diabetes Federation. IDF Diabetes Atlas. 10th ed. 2021.
2. Mogensen CE. Microalbuminuria as a predictor of clinical diabetic nephropathy. N Engl J Med. 1984;310:356–360.
3. de Zeeuw D. Microalbuminuria and risk for cardiovascular disease in diabetes. Kidney Int. 2004;66(Suppl):S68–S72.
4. Gross JL, de Azevedo MJ, Silveiro SP, Canani LH, Caramori ML, Zelmanovitz T. Diabetic nephropathy: diagnosis, prevention, and treatment. Diabetes Care. 2005;28:164–176.
5. American Diabetes Association. Standards of medical care in diabetes—2024. Diabetes Care. 2024;47(Suppl 1):S1–S350.
6. Nathan DM, Kuenen J, Borg R, Zheng H, Schoenfeld D, Heine RJ. Translating the A1C assay into estimated average glucose values. Diabetes Care. 2007;30:4–14.
7. DCCT Research Group. The effect of intensive treatment of diabetes on the development and progression of long-term complications in insulin-dependent diabetes mellitus. N Engl J Med. 1993;329:977–986.
8. UKPDS Group. Intensive blood-glucose control with sulphonylureas or insulin compared with conventional treatment and risk of complications in patients with type 2 diabetes. Lancet. 1998;352:837–853.
9. Monnier L, Colette C, Dunseath GJ, Owens DR. The loss of postprandial glycemic control precedes stepwise deterioration of fasting with worsening diabetes. Diabetes Care. 2006;29:1681–1687.
10. Hirsch IB. Glycemic variability and diabetes complications: does it matter? Diabetes Technol Ther. 2005;7:780–784.
11. Ceriello A, Esposito K, Piconi L, Ihnat MA, Thorpe JE. Glucose “variability”: the third component of the dysglycemia in diabetes. Diabetes. 2008;57:1349–1354.
12. Kilpatrick ES, Rigby AS, Atkin SL. The effect of glucose variability on the risk of microvascular complications in type 1 diabetes. Diabetes Care. 2008;31:2198–2202.
13. Hsu CC, Chang HY, Huang MC, Wu MS, Wu CH, Lin JW, et al. Visit-to-visit HbA1c variability is associated with microalbuminuria in patients with type 2 diabetes. Diabetes Care. 2012;35:2180–2186.
14. Sugawara A, Kikuchi M, Saito T, Shimada A, Miyamoto Y, Saito T. HbA1c variability and risk of nephropathy in type 2 diabetes. Diabetes Res Clin Pract. 2012;97:43–48.
15. Anjana RM, Deepa M, Pradeepa R, Mahanta J, Narain K, Ali MK, et al. Prevalence of microvascular complications in type 2 diabetes in India: findings from the ICMR–INDIAB study. Lancet Diabetes Endocrinol. 2023;11:98–110.
16. Lee MY, Lee YH, Han K, Park YM, Park CY. Glycemic variability and risk of microalbuminuria in type 2 diabetes: a retrospective cohort study. Medicine (Baltimore). 2017;96:e9337.
17. Li S, Xu H, Huang J, Zhang Y. Visit-to-visit HbA1c variability and risk of diabetic nephropathy in patients with type 2 diabetes. J Diabetes Investig. 2021;12:998–1007.
18. Dorajoo R, Lim SC, Tai ES, et al. HbA1c variability and risk of microalbuminuria progression in Asian patients with type 2 diabetes. Diabetologia. 2017;60:2472–2482.
19. Yun JS, Ko SH, Park SE, Ahn YB, Song KH, et al. Glycemic variability and diabetic microvascular complications in type 2 diabetes. Cardiovasc Diabetol. 2020;19:168.
20. Luk AOY, Ma RCW, Lau ES, Yang X, So WY, Kong AP, et al. HbA1c variability and risk of microalbuminuria in type 2 diabetes: Hong Kong Diabetes Registry. Diabetes Care. 2013;36:2350–2357.
21. Cheng D, Zhang Y, Wang Y, et al. Glycemic variability and microvascular complications in type 2 diabetes: a systematic review. Diabetes Metab Res Rev. 2014;30:125–132.
22. Hsu CC, Chang HY, Huang MC, Wu MS, Wu CH, Lin JW, et al. Impact of diabetes duration on development of microalbuminuria. Diabetes Care. 2012;35:2180–2186.
23. Ceriello A, Esposito K, Piconi L, Ihnat MA, Thorpe JE. Oxidative stress and endothelial dysfunction in diabetic nephropathy. Diabetes. 2008;57:1349–1354.
24. American Diabetes Association. Microvascular complications and foot care: Standards of Care in Diabetes—2024. Diabetes Care. 2024;47(Suppl 1):S179–S218.
25. KDIGO Clinical Practice Guideline for Diabetes Management in CKD. Kidney Int. 2022;102(Suppl):S1–S127.
26. Varghese A, Deepa R, Rema M, Mohan V. Prevalence of microalbuminuria in type 2 diabetes mellitus at a diabetes centre in southern India. Postgrad Med J. 2001;77(908):399–402.