Correlation of Serum Ferritin, LDH, and AST/ALT Ratio with Disease Severity in Dengue Fever
- Dr. Venkatesh V. Madholli , Senior Resident Department of General Medicine KMCRI, Hubli
- Dr. Vishwanath Bandargal , Assistant Professor Department of Medicine KMCRI, Hubli
- Dr. Veeresh S. Balehosur , Senior Resident Department of General Medicine MNMC, Nadia
Article Information:
Abstract:
ackground: Dengue fever has a variable clinical course ranging from a self-limiting febrile illness to severe disease with plasma leakage, bleeding, and organ dysfunction. Early identification of patients at risk of severe dengue is essential. Serum ferritin, lactate dehydrogenase (LDH), and the aspartate aminotransferase/alanine aminotransferase (AST/ALT) ratio may reflect inflammation, cellular injury, and hepatic involvement associated with disease progression. Methods: This observational study included 90 patients with laboratory-confirmed dengue, categorized equally into dengue without warning signs, dengue with warning signs, and severe dengue (n=30 each). Clinical and laboratory parameters, serum ferritin, LDH, AST, and ALT were assessed. Correlations with disease severity were analyzed, and receiver operating characteristic (ROC) curve analysis was performed to evaluate the ability of the biomarkers to identify severe dengue. Results: Median serum ferritin increased significantly from 386 ng/mL in dengue without warning signs to 728 ng/mL with warning signs and 1,486 ng/mL in severe dengue (p<0.001). Corresponding LDH levels were 328, 512, and 824 U/L, while AST/ALT ratios were 1.21, 1.39, and 1.62, respectively (both p<0.001). Ferritin (ρ=0.684) and LDH (ρ=0.651) showed strong positive correlations with disease severity. Ferritin >950 ng/mL demonstrated an AUC of 0.886, while LDH >620 U/L demonstrated an AUC of 0.862. Both remained independently associated with severe dengue on multivariable analysis. Conclusion: Serum ferritin and LDH showed strong associations with dengue severity and good discriminatory performance for severe disease. These readily available biomarkers may complement routine clinical and laboratory parameters for early risk stratification.
Keywords:
Article :
INTRODUCTION:
Dengue fever is an important mosquito-borne viral infection caused by dengue virus (DENV) and transmitted predominantly by Aedes aegypti and Aedes albopictus mosquitoes. It remains a major public health concern, particularly in tropical and subtropical regions [1]. The clinical spectrum of dengue is highly variable, ranging from an asymptomatic or mild self-limiting febrile illness to severe dengue characterized by plasma leakage, hemorrhage, shock, and organ dysfunction. The global burden of dengue has increased considerably over recent decades, with a substantial number of infections and hospitalizations occurring annually [2,3]. In India, recurrent outbreaks continue to contribute significantly to morbidity and mortality [4].The pathogenesis of severe dengue involves complex interactions between viral factors, host immune responses, cytokine activation, endothelial dysfunction, increased vascular permeability, and coagulation abnormalities. Although platelet count, hematocrit, liver enzymes, and clinical warning signs are routinely used to assess disease progression, early identification of patients likely to develop severe dengue remains challenging [5]. Laboratory confirmation is generally achieved using NS1 antigen detection during the early febrile phase and dengue-specific IgM antibodies during the later phase of illness [6–8]. As no specific antiviral therapy is routinely available for dengue, timely recognition of severe disease and appropriate supportive management are essential for reducing complications and mortality [9,10].Serum ferritin has emerged as a potentially useful biomarker of dengue severity. Ferritin is primarily an intracellular iron-storage protein but also functions as an acute-phase reactant, with markedly elevated concentrations occurring during systemic inflammation and immune activation [11]. Hyperferritinemia in dengue has been associated with macrophage activation, coagulation abnormalities, hepatic dysfunction, and severe clinical manifestations. Previous studies have demonstrated substantially elevated ferritin concentrations in severe dengue, suggesting its potential role in early risk stratification [12,13].Lactate dehydrogenase (LDH), a cytoplasmic enzyme widely distributed in the liver, skeletal muscle, heart, kidneys, and blood cells, is released into the circulation following cellular injury. Elevated serum LDH in dengue may therefore reflect the extent of systemic tissue damage, hepatic involvement, and inflammatory injury. Increasing LDH concentrations with greater disease severity may make it another useful biochemical marker of disease progression.
Hepatic involvement is also common in dengue, ranging from mild aminotransferase elevation to severe hepatitis. Both aspartate aminotransferase (AST) and alanine aminotransferase (ALT) may be elevated; however, AST frequently shows a disproportionately greater increase, partly because of concomitant extrahepatic tissue injury. Consequently, the AST/ALT ratio may provide additional information regarding the extent of hepatic and systemic involvement.Since ferritin, LDH, and the AST/ALT ratio represent interconnected processes of inflammation, cellular injury, and hepatic dysfunction, their combined evaluation may provide a practical approach to assessing dengue severity. Therefore, the present study aimed to determine the correlation of serum ferritin, LDH, and the AST/ALT ratio with disease severity in patients with dengue fever and to assess their potential utility as biochemical markers for early risk stratification.
MATERIALS AND METHODS:
This hospital-based observational cross-sectional study was conducted in the Department of Medicine. The study evaluated the correlation of serum ferritin, lactate dehydrogenase (LDH), and aspartate aminotransferase/alanine aminotransferase (AST/ALT) ratio with disease severity in patients with dengue fever.A total of 90 patients with confirmed dengue infection who fulfilled the eligibility criteria were enrolled during the study period.
Inclusion Criteria
Patients aged ≥18 years with clinically suspected dengue fever and laboratory-confirmed dengue infection by NS1 antigen and/or dengue IgM antibody were included. Patients belonging to different categories of dengue severity according to the World Health Organization (WHO) classification were considered eligible for participation.
Exclusion Criteria
Patients with pre-existing chronic liver disease, chronic kidney disease, known hematological disorders, iron-overload disorders, active malignancy, autoimmune or chronic inflammatory diseases, or other concurrent acute infections likely to alter serum ferritin, LDH, or liver enzyme levels were excluded. Patients receiving medications known to significantly affect liver function and those who did not provide consent were also excluded.
Data Collection and Clinical Assessment
After enrolment, detailed demographic and clinical information was recorded using a predesigned data collection form. Data included age, sex, duration of fever, presenting symptoms, warning signs, comorbidities, and relevant treatment history. All patients underwent a detailed general and systemic examination. Vital parameters, evidence of bleeding, hepatomegaly, fluid accumulation, circulatory compromise, and manifestations of organ involvement were documented.
Classification of Dengue Severity
Disease severity was classified according to the WHO dengue classification into dengue without warning signs, dengue with warning signs, and severe dengue. Warning signs included features such as abdominal pain or tenderness, persistent vomiting, clinical fluid accumulation, mucosal bleeding, lethargy or restlessness, liver enlargement, and an increase in hematocrit associated with a rapid decline in platelet count. Severe dengue was identified by severe plasma leakage resulting in shock or respiratory distress, severe bleeding, or severe organ involvement.
Laboratory Investigations
Venous blood samples were collected under aseptic precautions at the time of enrolment. Routine investigations included complete blood count, hemoglobin, hematocrit, total leukocyte count, platelet count, renal function tests, and liver function tests. Dengue infection was confirmed using NS1 antigen and/or dengue IgM antibody testing, as appropriate according to the duration of illness.Serum ferritin, LDH, AST, and ALT levels were measured using standardized laboratory methods in the institutional laboratory. All investigations were performed according to the manufacturer's recommendations and established laboratory quality-control procedures.
Assessment of Serum Ferritin and LDH
Serum ferritin levels were measured and expressed in ng/mL, while serum LDH levels were expressed in U/L. The values obtained at enrolment were recorded and compared across the different categories of dengue severity. The relationship of serum ferritin and LDH levels with clinical and laboratory indicators of disease severity was subsequently evaluated.
Calculation of AST/ALT Ratio
Serum AST and ALT concentrations were measured and expressed in U/L. The AST/ALT ratio was calculated for each patient by dividing the serum AST value by the corresponding serum ALT value. The calculated ratio was compared among patients with dengue without warning signs, dengue with warning signs, and severe dengue.
Outcome Measures
The primary outcome was the correlation of serum ferritin, LDH, and AST/ALT ratio with dengue disease severity. Secondary assessments included comparison of these biomarkers across the three WHO severity categories and evaluation of their relationship with relevant clinical and laboratory parameters. Where appropriate, their diagnostic performance for identifying severe dengue was assessed using receiver operating characteristic (ROC) curve analysis.
Statistical Analysis
Data were entered into Microsoft Excel and analyzed using [SPSS version 25] Continuous variables were expressed as mean ± standard deviation for normally distributed data and median with interquartile range for non-normally distributed data. Categorical variables were expressed as frequencies and percentages. Normality of continuous variables was assessed using the Shapiro–Wilk test.Comparisons of continuous variables among the three dengue severity groups were performed using one-way analysis of variance (ANOVA) for normally distributed variables or the Kruskal–Wallis test for non-normally distributed variables. Categorical variables were compared using the Chi-square test or Fisher's exact test, as appropriate. Correlations between serum ferritin, LDH, AST/ALT ratio, and measures of disease severity were assessed using Pearson's or Spearman's correlation coefficient, depending on data distribution.Receiver operating characteristic (ROC) curve analysis was performed, where applicable, to assess the ability of serum ferritin, LDH, and AST/ALT ratio to discriminate severe dengue from non-severe dengue. The area under the curve (AUC), optimal cut-off value, sensitivity, specificity, positive predictive value, and negative predictive value were determined. A p-value <0.05 was considered statistically significant.
RESULTS:
A total of 90 patients with laboratory-confirmed dengue fever were included in the study. Based on disease severity, 30 (33.3%) patients had dengue without warning signs, 30 (33.3%) had dengue with warning signs, and 30 (33.3%) had severe dengue.
Demographic and Clinical Characteristics
The mean age of the study population was 34.6 ± 13.2 years. The mean age was comparable among patients with dengue without warning signs (32.8 ± 12.4 years), dengue with warning signs (34.7 ± 13.1 years), and severe dengue (36.4 ± 14.0 years; p=0.579). Overall, 55 (61.1%) patients were male and 35 (38.9%) were female, with no significant difference in sex distribution among the three groups (p=0.866). The duration of fever at presentation was significantly greater among patients with severe dengue (5.7 ± 1.5 days) compared with those with warning signs (4.9 ± 1.4 days) and without warning signs (4.3 ± 1.3 days; p<0.001). Abdominal pain, persistent vomiting, mucosal bleeding, hepatomegaly, and clinical fluid accumulation showed an increasing frequency with disease severity (Table 1 and Figure 1).
Table 1. Demographic and clinical characteristics according to dengue severity
|
Parameter |
Dengue without warning signs (n=30) |
Dengue with warning signs (n=30) |
Severe dengue (n=30) |
p-value |
|
Age (years), mean ± SD |
32.8 ± 12.4 |
34.7 ± 13.1 |
36.4 ± 14.0 |
0.579 |
|
Male sex, n (%) |
17 (56.7) |
19 (63.3) |
19 (63.3) |
0.866 |
|
Female sex, n (%) |
13 (43.3) |
11 (36.7) |
11 (36.7) |
|
|
Duration of fever (days), mean ± SD |
4.3 ± 1.3 |
4.9 ± 1.4 |
5.7 ± 1.5 |
<0.001 |
|
Abdominal pain, n (%) |
5 (16.7) |
18 (60.0) |
23 (76.7) |
<0.001 |
|
Persistent vomiting, n (%) |
4 (13.3) |
16 (53.3) |
20 (66.7) |
<0.001 |
|
Mucosal bleeding, n (%) |
2 (6.7) |
8 (26.7) |
15 (50.0) |
<0.001 |
|
Hepatomegaly, n (%) |
3 (10.0) |
10 (33.3) |
18 (60.0) |
<0.001 |
|
Clinical fluid accumulation, n (%) |
1 (3.3) |
7 (23.3) |
17 (56.7) |
<0.001 |
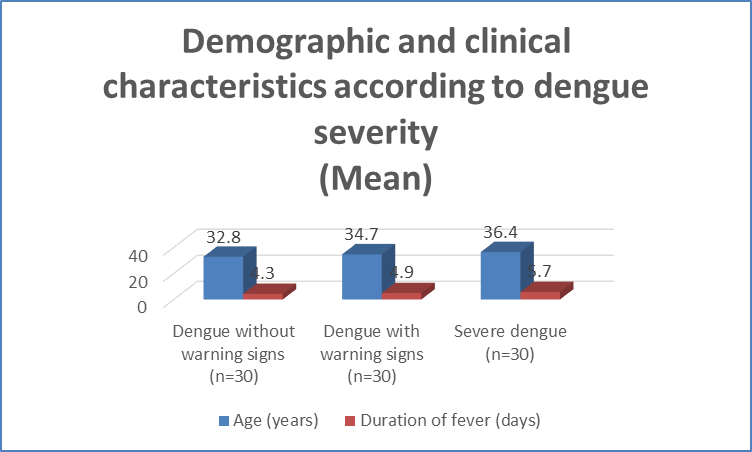
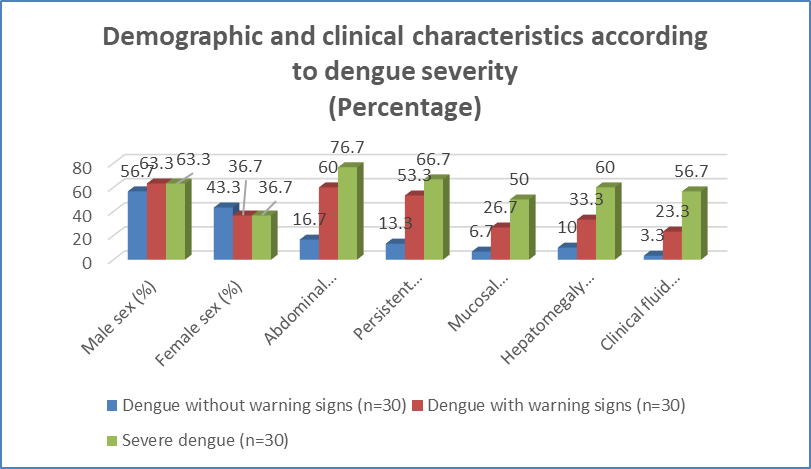
Figure 1 Demographic and clinical characteristics according to dengue severity
Hematological and Biochemical Parameters
Significant differences in hematological and biochemical parameters were observed across the three severity groups. Mean platelet count progressively decreased with increasing disease severity, from 112.6 ± 46.8 ×10³/µL in patients without warning signs to 74.8 ± 35.7 ×10³/µL in those with warning signs and 43.5 ± 27.9 ×10³/µL in patients with severe dengue (p<0.001). Hematocrit was significantly higher in severe dengue (44.6 ± 6.1%) compared with the other groups (p=0.002). AST and ALT concentrations also increased significantly with disease severity. The mean AST level increased from 78.4 ± 39.6 U/L in dengue without warning signs to 146.7 ± 76.5 U/L in dengue with warning signs and 286.5 ± 151.8 U/L in severe dengue (p<0.001). A similar increase was observed for ALT (Table 2 and Figure 2).
Table 2. Hematological and biochemical parameters according to dengue severity
|
Parameter |
Dengue without warning signs (n=30) |
Dengue with warning signs (n=30) |
Severe dengue (n=30) |
p-value |
|
Hemoglobin (g/dL) |
13.5 ± 1.6 |
13.8 ± 1.7 |
14.1 ± 1.8 |
0.412 |
|
Hematocrit (%) |
39.8 ± 5.2 |
42.1 ± 5.6 |
44.6 ± 6.1 |
0.002 |
|
Total leukocyte count (/µL) |
4,580 ± 1,620 |
4,260 ± 1,740 |
4,810 ± 2,130 |
0.511 |
|
Platelet count (×10³/µL) |
112.6 ± 46.8 |
74.8 ± 35.7 |
43.5 ± 27.9 |
<0.001 |
|
AST (U/L) |
78.4 ± 39.6 |
146.7 ± 76.5 |
286.5 ± 151.8 |
<0.001 |
|
ALT (U/L) |
62.3 ± 31.8 |
104.5 ± 57.4 |
178.6 ± 101.2 |
<0.001 |
|
Total bilirubin (mg/dL) |
0.72 ± 0.28 |
0.89 ± 0.37 |
1.24 ± 0.61 |
<0.001 |
|
Serum creatinine (mg/dL) |
0.82 ± 0.19 |
0.88 ± 0.24 |
1.08 ± 0.42 |
0.001 |
Values are expressed as mean ± SD unless otherwise specified.
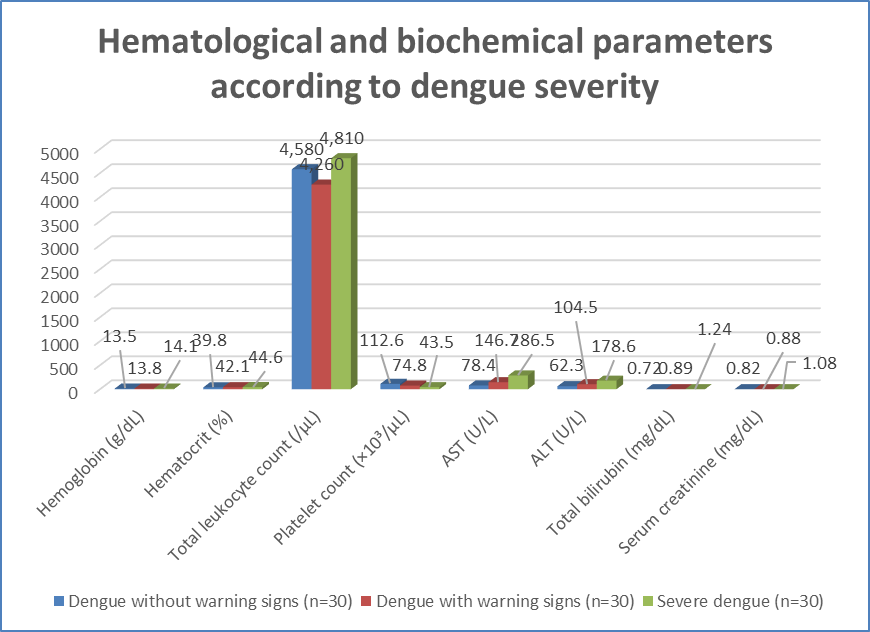
Figure 2 Hematological and biochemical parameters according to dengue severity
Serum Ferritin, LDH, and AST/ALT Ratio According to Disease Severity
All three principal biomarkers demonstrated a progressive increase with dengue severity. Serum ferritin was lowest in patients without warning signs, with a median concentration of 386 ng/mL (IQR: 248–572), and increased to 728 ng/mL (IQR: 486–1,086) in patients with warning signs and 1,486 ng/mL (IQR: 892–2,315) in severe dengue (p<0.001).Similarly, median serum LDH increased significantly from 328 U/L (IQR: 268–414) in dengue without warning signs to 512 U/L (IQR: 396–684) in dengue with warning signs and 824 U/L (IQR: 618–1,096) in severe dengue (p<0.001). The AST/ALT ratio also demonstrated a significant progressive increase across the groups, with median values of 1.21, 1.39, and 1.62, respectively (p<0.001) (Table 3).
Table 3. Comparison of principal biomarkers according to dengue severity
|
Biomarker |
Dengue without warning signs (n=30) |
Dengue with warning signs (n=30) |
Severe dengue (n=30) |
p-value |
|
Serum ferritin (ng/mL), median (IQR) |
386 (248–572) |
728 (486–1,086) |
1,486 (892–2,315) |
<0.001 |
|
LDH (U/L), median (IQR) |
328 (268–414) |
512 (396–684) |
824 (618–1,096) |
<0.001 |
|
AST/ALT ratio, median (IQR) |
1.21 (1.05–1.36) |
1.39 (1.19–1.58) |
1.62 (1.38–1.91) |
<0.001 |
IQR: interquartile range; LDH: lactate dehydrogenase; AST: aspartate aminotransferase; ALT: alanine aminotransferase.
Correlation of Biomarkers with Dengue Severity
Spearman correlation analysis demonstrated significant positive correlations between all three biomarkers and increasing dengue severity. Serum ferritin showed the strongest positive correlation with disease severity (ρ=0.684, p<0.001), followed by LDH (ρ=0.651, p<0.001) and the AST/ALT ratio (ρ=0.472, p<0.001).
Serum ferritin and LDH were also negatively correlated with platelet count (ρ=−0.538 and −0.496, respectively; both p<0.001). Ferritin demonstrated a positive correlation with AST (ρ=0.527, p<0.001), while LDH was positively correlated with AST (ρ=0.561, p<0.001). These findings indicated that increasing concentrations of the studied biomarkers were associated with greater disease severity and biochemical evidence of tissue injury (Table 4).
Table 4. Correlation of serum ferritin, LDH, and AST/ALT ratio with disease severity and selected laboratory parameters
|
Biomarker |
Disease severity ρ (p-value) |
Platelet count ρ (p-value) |
Hematocrit ρ (p-value) |
AST ρ (p-value) |
|
Serum ferritin |
0.684 (<0.001) |
−0.538 (<0.001) |
0.354 (0.001) |
0.527 (<0.001) |
|
LDH |
0.651 (<0.001) |
−0.496 (<0.001) |
0.326 (0.002) |
0.561 (<0.001) |
|
AST/ALT ratio |
0.472 (<0.001) |
−0.318 (0.002) |
0.244 (0.020) |
0.403 (<0.001) |
Spearman's rank correlation coefficient (ρ) was used. Increasing disease severity was coded ordinally.
Diagnostic Performance for Severe Dengue
Receiver operating characteristic (ROC) curve analysis was performed to determine the ability of the studied biomarkers to discriminate severe dengue from non-severe dengue. Serum ferritin demonstrated the highest diagnostic performance, with an area under the curve (AUC) of 0.886 (95% CI: 0.812–0.960). At an optimal cut-off of >950 ng/mL, ferritin showed a sensitivity of 83.3% and specificity of 81.7%.
LDH also demonstrated good discriminatory ability, with an AUC of 0.862 (95% CI: 0.780–0.944). An LDH cut-off of >620 U/L provided a sensitivity of 80.0% and specificity of 78.3%. The AST/ALT ratio showed comparatively moderate discriminatory performance, with an AUC of 0.758 (95% CI: 0.653–0.863). At a cut-off of >1.45, its sensitivity and specificity were 73.3% and 70.0%, respectively (Table 5).
Table 5. ROC curve analysis of biomarkers for prediction of severe dengue
|
Biomarker |
Optimal cut-off |
AUC |
95% CI |
Sensitivity (%) |
Specificity (%) |
PPV (%) |
NPV (%) |
p-value |
|
Serum ferritin |
>950 ng/mL |
0.886 |
0.812–0.960 |
83.3 |
81.7 |
69.4 |
90.7 |
<0.001 |
|
LDH |
>620 U/L |
0.862 |
0.780–0.944 |
80.0 |
78.3 |
64.9 |
88.7 |
<0.001 |
|
AST/ALT ratio |
>1.45 |
0.758 |
0.653–0.863 |
73.3 |
70.0 |
55.0 |
84.0 |
<0.001 |
Association of Biomarkers with Severe Dengue
On univariate logistic regression analysis, elevated serum ferritin, LDH, AST/ALT ratio, low platelet count, and elevated hematocrit were significantly associated with severe dengue. In multivariable analysis, serum ferritin >950 ng/mL remained independently associated with severe dengue (adjusted OR [AOR]: 4.18; 95% CI: 1.48–11.82; p=0.007). LDH >620 U/L was also independently associated with severe disease (AOR: 3.46; 95% CI: 1.22–9.84; p=0.019). An AST/ALT ratio >1.45 showed an increased likelihood of severe dengue, although the association did not remain statistically significant after adjustment (AOR: 2.08; 95% CI: 0.78–5.56; p=0.144). Platelet count <50×10³/µL was independently associated with severe dengue (AOR: 3.72; 95% CI: 1.31–10.57; p=0.014) (Table 6 and Figure 3).
Table 6. Logistic regression analysis of factors associated with severe dengue
|
Variable |
Unadjusted OR (95% CI) |
p-value |
Adjusted OR (95% CI) |
p-value |
|
Ferritin >950 ng/mL |
6.82 (2.54–18.31) |
<0.001 |
4.18 (1.48–11.82) |
0.007 |
|
LDH >620 U/L |
5.64 (2.16–14.72) |
<0.001 |
3.46 (1.22–9.84) |
0.019 |
|
AST/ALT ratio >1.45 |
3.41 (1.37–8.50) |
0.008 |
2.08 (0.78–5.56) |
0.144 |
|
Platelet count <50×10³/µL |
5.12 (1.99–13.18) |
0.001 |
3.72 (1.31–10.57) |
0.014 |
|
Elevated hematocrit* |
2.78 (1.12–6.91) |
0.028 |
1.82 (0.65–5.11) |
0.255 |
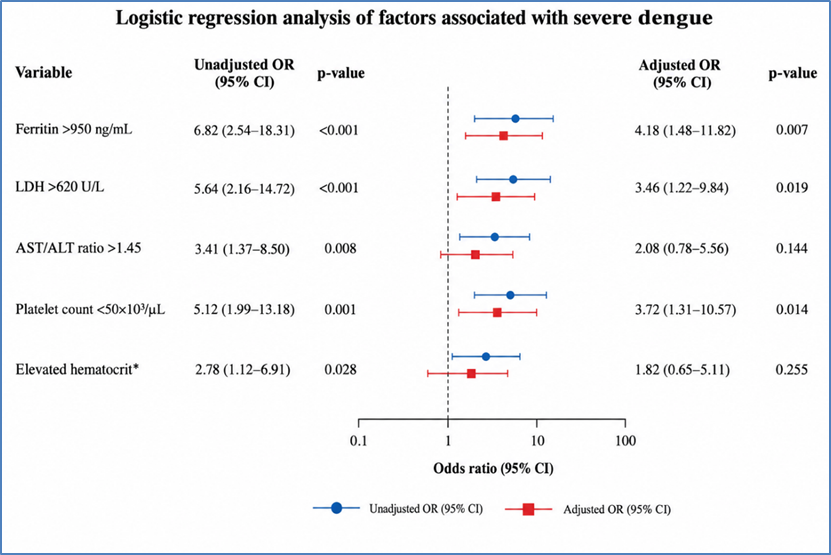
Figure 3 Logistic regression analysis of factors associated with severe dengue
DISCUSSION:
The present study evaluated the association of serum ferritin, LDH, and AST/ALT ratio with disease severity among 90 patients with dengue fever. A progressive worsening of clinical and laboratory parameters was observed across the three severity categories. Platelet count decreased from 112.6 ± 46.8 ×10³/µL in dengue without warning signs to 43.5 ± 27.9 ×10³/µL in severe dengue (p<0.001), whereas hematocrit increased from 39.8 ± 5.2% to 44.6 ± 6.1% (p=0.002). Similarly, abdominal pain, persistent vomiting, mucosal bleeding, and fluid accumulation were more frequent in severe dengue. A systematic review by Sangkaew et al.[14] also found vomiting (OR 2.25), abdominal pain/tenderness (OR 1.92), mucosal bleeding (OR 1.57), and fluid accumulation (OR 4.61) to be associated with progression to severe dengue, while platelet counts were significantly lower among patients who progressed to severe disease.
Serum ferritin showed a strong relationship with disease severity in our study. Median ferritin increased from 386 ng/mL in dengue without warning signs to 728 ng/mL in dengue with warning signs and 1,486 ng/mL in severe dengue (p<0.001). Ferritin showed the strongest correlation with severity (ρ=0.684, p<0.001) and an inverse correlation with platelet count (ρ=−0.538, p<0.001). These observations are consistent with the meta-analysis by Shukla et al.[15], which included 18 studies and demonstrated significantly higher ferritin in severe compared with non-severe dengue (SMD 4.05; 95% CI 2.09–6.00). Ferritin was also higher in dengue with warning signs than without warning signs (SMD 2.01) and in severe dengue compared with dengue with warning signs (SMD 2.66). A prospective North Indian study involving 99 patients similarly demonstrated significantly increasing ferritin across WHO severity categories.
In the present study, ferritin >950 ng/mL predicted severe dengue with an AUC of 0.886, sensitivity of 83.3%, and specificity of 81.7%. This finding closely corresponds with a recent systematic review and meta-analysis of predictive accuracy, which reported a pooled AUC of 0.88 (95% CI 0.82–0.95) for serum ferritin in predicting severe dengue. Furthermore, ferritin >950 ng/mL remained independently associated with severe dengue after adjustment (AOR 4.18; 95% CI 1.48–11.82; p=0.007), reinforcing its potential role in severity assessment.
LDH also demonstrated a progressive increase, from 328 U/L in dengue without warning signs to 512 U/L with warning signs and 824 U/L in severe dengue (p<0.001). LDH correlated positively with severity (ρ=0.651) and negatively with platelet count (ρ=−0.496). At a cut-off >620 U/L, LDH demonstrated an AUC of 0.862, sensitivity of 80.0%, and specificity of 78.3%; it remained independently associated with severe dengue (AOR 3.46; p=0.019). These findings support the concept that increased cellular and tissue injury accompanies progression of dengue and that LDH may provide additional information regarding severity.
Hepatic involvement was also prominent. AST increased from 78.4 ± 39.6 U/L to 286.5 ± 151.8 U/L, while ALT increased from 62.3 ± 31.8 U/L to 178.6 ± 101.2 U/L from the mildest to severe group (both p<0.001). Previous meta-analysis similarly demonstrated significantly higher AST in severe dengue (SMD 0.87; 95% CI 0.36–1.38), while another meta-analysis reported significant associations of both elevated AST and ALT with severe dengue.
The AST/ALT ratio increased from 1.21 to 1.39 and 1.62 across the three severity groups (p<0.001) and showed a moderate correlation with severity (ρ=0.472). However, despite an AUC of 0.758, an AST/ALT ratio >1.45 did not remain independently significant on multivariable analysis (AOR 2.08; p=0.144). Thus, while the AST/ALT ratio reflected increasing hepatic and systemic involvement, its independent predictive ability appeared weaker than that of ferritin and LDH.
CONCLUSION:
The present study demonstrated that serum ferritin, LDH, and AST/ALT ratio increased significantly with increasing severity of dengue fever. Serum ferritin and LDH showed strong positive correlations with disease severity and good discriminatory ability for identifying severe dengue. Elevated ferritin and LDH remained independently associated with severe disease, whereas the AST/ALT ratio showed comparatively lower predictive value. These readily available biomarkers may complement clinical and routine laboratory parameters for early risk stratification and timely management of patients with dengue.
Limitations
The study was limited by its relatively small sample size and single-center design, which may restrict the generalizability of the findings. Biomarkers were assessed primarily at presentation, and serial changes during the course of illness were not evaluated. Potential confounding factors influencing ferritin, LDH, and liver enzymes could not be completely excluded. Larger multicenter prospective studies are required to validate the identified cut-off values and their prognostic utility.
REFERENCES:
1. World Health Organization. Dengue and severe dengue [Internet]. Geneva: World Health Organization; 2024 [cited 2026 Sep 29]. Available from: WHO dengue and severe dengue
2. World Health Organization Regional Office for South-East Asia. Dengue in the South-East Asia [Internet]. New Delhi: World Health Organization Regional Office for South-East Asia; 2024 [cited 2026 Sep 29]. Available from: WHO South-East Asia dengue page
3. World Health Organization. Global strategy for dengue prevention and control 2012-2020. Geneva: World Health Organization; 2012.
4. Gupta N, Srivastava S, Jain A, Chaturvedi UC. Dengue in India. Indian J Med Res. 2012;136(3):373-90.
5. Zhang H, Zhou YP, Peng HJ, Zhang XH, Zhou FY, Liu ZH, et al. Predictive symptoms and signs of severe dengue disease for patients with dengue fever: a meta-analysis. Biomed Res Int. 2014;2014:359308.
6. Centers for Disease Control and Prevention. Laboratory guidance and diagnostic testing [Internet]. Atlanta: Centers for Disease Control and Prevention; 2017 [cited 2026 Sep 29].
7. Muller DA, Depelsenaire AC, Young PR. Clinical and laboratory diagnosis of dengue virus infection. J Infect Dis. 2017;215(Suppl 2):S89-95.
8. Chaudhuri SR, Bhattacharya S, Chakraborty M, Bhattacharjee K. Serum ferritin: a backstage weapon in diagnosis of dengue fever. Interdiscip Perspect Infect Dis. 2017;2017:7463489.
9. Selvamuthukumaran S. Severity of dengue fever and serum ferritin levels: a correlative study in a rural tertiary care medical college and hospital in Tamil Nadu (South India). Ann Int Med Dent Res. 2018;4:52-4.
10. John DV, Lin YS, Perng GC. Biomarkers of severe dengue disease: a review. J Biomed Sci. 2015;22:83.
11. Visalakshy SJ, Saminathan SS, Surendran S, Pillai MG. Hyperferritinemia in dengue fever: correlation between serum ferritin and thrombocytopenia. J Clin Diagn Res. 2018;12.
12. Chaiyaratana W, Chuansumrit A, Atamasirikul K, Tangnararatchakit K. Serum ferritin levels in children with dengue infection. Southeast Asian J Trop Med Public Health. 2008;39(5):832-6.
13. van de Weg CAM, Huits RMHG, Pannuti CS, Brouns RM, van den Berg RWA, van den Ham HJ, et al. Hyperferritinaemia in dengue virus infected patients is associated with immune activation and coagulation disturbances. PLoS Negl Trop Dis. 2014;8(10):e3214.
14. Sangkaew S, Ming D, Boonyasiri A, Honeyford K, Kalayanarooj S, Yacoub S, et al. Risk predictors of progression to severe disease during the febrile phase of dengue: a systematic review and meta-analysis. Lancet Infect Dis. 2021;21(7):1014-26.
15. Shukla S, Jadhav SM, Gurav YK, Parashar D, Alagarasu K. Serum ferritin level as a prognostic biomarker for predicting dengue disease severity: A systematic review and meta-analysis. Rev Med Virol. 2023 Sep;33(5):e2468.