Comparative Study of Clinical and Biochemical Profiles in Alcoholic vs. Non-Alcoholic Steatohepatitis-Related Cirrhosis.
- Dr. Vishwanath Bandargal , Assistant Professor Department of Medicine KMCRI, Hubli
- Dr. Veeresh S. Balehosur , Senior Resident Department of General Medicine JMNMC, Nadia
- Dr. Venkatesh V. Madholli , Senior Resident Department of General Medicine KMCRI, Hubli
Article Information:
Abstract:
Background: Alcoholic liver disease and non-alcoholic steatohepatitis (NASH) are important causes of cirrhosis with overlapping clinical manifestations but distinct etiological and metabolic characteristics. Identification of differences in their clinical and biochemical profiles may facilitate etiological assessment and management. This study compared the clinical and biochemical characteristics of patients with alcoholic and NASH-related cirrhosis. Materials and Methods: This comparative observational study included 98 patients with cirrhosis, comprising 49 patients with alcoholic cirrhosis and 49 with NASH-related cirrhosis. Demographic characteristics, metabolic comorbidities, clinical manifestations, hematological parameters, liver and renal function tests, metabolic parameters, Child–Pugh scores, and MELD scores were compared between the groups. A p-value <0.05 was considered statistically significant. Results: Patients with NASH-related cirrhosis were older than those with alcoholic cirrhosis (55.7±8.9 vs. 49.8±9.6 years; p=0.002) and had higher BMI (28.7±3.8 vs. 23.4±3.1 kg/m²; p<0.001). Diabetes, hypertension, dyslipidaemia, and obesity were significantly more frequent in NASH-related cirrhosis. Alcoholic cirrhosis was associated with higher AST (112.5 vs. 64.7 U/L), AST/ALT ratio (2.21 vs. 1.13), GGT (186.4 vs. 78.6 U/L), and bilirubin (4.8 vs. 2.9 mg/dL) (all p<0.001). Ascites and jaundice were also more frequent in alcoholic cirrhosis. Child–Pugh (9.1 vs. 7.8; p=0.001) and MELD scores (16.8 vs. 13.9; p=0.008) were significantly higher in alcoholic cirrhosis. Conclusion: Alcoholic cirrhosis demonstrated greater biochemical hepatic injury and decompensation, whereas NASH-related cirrhosis was predominantly associated with cardiometabolic abnormalities. These differences may aid etiological characterization and clinical management.
Keywords:
Article :
INTRODUCTION:
Cirrhosis represents the final common pathway of progressive chronic liver injury and is characterized by diffuse fibrosis, regenerative nodule formation, distortion of hepatic architecture, and progressive impairment of liver function [1]. With advancing disease, patients may develop portal hypertension and hepatic decompensation in the form of ascites, variceal bleeding, jaundice, hepatic encephalopathy, and renal dysfunction. Among the important causes of cirrhosis, alcoholic liver disease (ALD) and non-alcoholic steatohepatitis (NASH) contribute substantially to the burden of chronic liver disease. Although both conditions may ultimately progress to cirrhosis, their underlying risk factors, metabolic associations, and biochemical profiles may differ considerably.Alcoholic liver disease encompasses a spectrum ranging from hepatic steatosis and alcoholic hepatitis to progressive fibrosis and cirrhosis. The cumulative quantity and duration of alcohol exposure are important determinants of hepatic injury, although progression is also influenced by nutritional, genetic, metabolic, and host-related factors. Alcohol-related disorders contribute substantially to global morbidity and mortality, with liver disease accounting for an important proportion of alcohol-attributable deaths [1]. In contrast, NASH is strongly associated with metabolic abnormalities, particularly obesity, insulin resistance, type 2 diabetes mellitus, dyslipidaemia, and hypertension. Excessive accumulation of triglycerides within hepatocytes, lipotoxicity, oxidative stress, and chronic inflammation can promote progressive fibrosis and eventually cirrhosis.Despite differences in their etiopathogenesis, alcoholic and NASH-related cirrhosis may exhibit considerable overlap in clinical manifestations, making etiological differentiation challenging, particularly in advanced disease. Biochemical parameters may therefore provide useful supportive information. Alanine aminotransferase (ALT) is predominantly cytosolic, whereas aspartate aminotransferase (AST) is present in both the cytosol and mitochondria of hepatocytes [2–5]. Mitochondrial injury associated with chronic alcohol exposure may contribute to the relative predominance of AST in alcoholic liver disease [6]. Consequently, the AST/ALT ratio has been investigated as a simple biochemical marker for differentiating alcohol-related from non-alcohol-related hepatic injury.In alcoholic hepatitis, AST commonly exceeds ALT, and an AST/ALT ratio greater than 2 has traditionally been associated with alcohol-related hepatic injury [7–11]. In contrast, ALT frequently predominates in NASH, particularly during earlier stages, although this pattern may change with progression to advanced fibrosis and cirrhosis [8,12–15]. Other biochemical markers, including alkaline phosphatase (ALP), gamma-glutamyl transferase (GGT), serum bilirubin, albumin, and coagulation parameters, may further characterize hepatocellular dysfunction and cholestasis [16]. GGT elevation may additionally support chronic or recent excessive alcohol exposure, although it lacks sufficient specificity to be used independently [10]. Given the overlapping clinical presentation but potentially distinct biochemical and metabolic characteristics of these conditions, comparative evaluation may aid etiological characterization and clinical assessment. Therefore, the present study was undertaken to compare the clinical and biochemical profiles of patients with alcoholic cirrhosis and NASH-related cirrhosis.
MATERIALS AND METHODS:
This hospital-based comparative observational study was conducted among patients diagnosed with liver cirrhosis who attended the Department of Medicine/Gastroenterology at a tertiary care teaching hospital. A total of 98 patients with cirrhosis were included in the study. Based on the underlying etiology, patients were divided into two groups:
· Group A: 49 patients with alcoholic cirrhosis.
· Group B: 49 patients with NASH-related cirrhosis.
Patients were recruited consecutively until the required sample size was achieved.
Inclusion Criteria
Adult patients aged ≥18 years with a diagnosis of liver cirrhosis based on clinical findings, biochemical investigations, and/or radiological evidence were included. Group A consisted of patients in whom cirrhosis was attributed predominantly to chronic harmful alcohol consumption based on a detailed history of alcohol intake and exclusion of other major etiologies. Group B consisted of patients with NASH-related cirrhosis based on the presence of metabolic risk factors and appropriate clinical and radiological findings, with no history of significant alcohol consumption.
Exclusion Criteria
Patients with cirrhosis attributable to chronic hepatitis B or C infection, autoimmune hepatitis, Wilson disease, hemochromatosis, drug-induced liver injury, primary biliary or other chronic cholestatic liver diseases were excluded. Patients with hepatocellular carcinoma or other active malignancies and those with insufficient clinical or laboratory data were also excluded. Patients in whom the etiology of cirrhosis remained uncertain or mixed were not included.
Clinical Assessment
A detailed history was recorded for each participant using a predefined proforma. Information regarding age, sex, presenting complaints, duration of liver disease, alcohol consumption, diabetes mellitus, hypertension, dyslipidaemia, obesity, medication use, and other relevant comorbidities was documented.All patients underwent a comprehensive clinical examination. General physical examination included assessment for pallor, icterus, pedal edema, clubbing, and other stigmata of chronic liver disease. Abdominal examination was performed to identify hepatomegaly, splenomegaly, ascites, and other manifestations of portal hypertension. Clinical evidence of hepatic decompensation, including ascites, gastrointestinal bleeding, jaundice, and hepatic encephalopathy, was recorded.
Assessment of Alcohol Consumption
A detailed alcohol history was obtained regarding the type of alcoholic beverage, approximate quantity consumed, frequency of consumption, duration of alcohol use, and time since the last alcohol intake. Where possible, information was corroborated with accompanying family members. Patients were classified as having alcoholic cirrhosis when chronic harmful alcohol exposure was considered the predominant cause of cirrhosis after exclusion of competing major etiologies.
Assessment of NASH-Related Cirrhosis
NASH-related cirrhosis was considered in patients with cirrhosis associated with metabolic risk factors such as obesity, type 2 diabetes mellitus, hypertension, and dyslipidaemia, after exclusion of significant alcohol consumption and other established causes of chronic liver disease. Available previous documentation of fatty liver disease or steatohepatitis and radiological findings were also reviewed when available.
Biochemical and Hematological Investigations
Venous blood samples were collected under standard aseptic precautions. Complete blood count, including hemoglobin, total leukocyte count, and platelet count, was performed. Liver function tests included serum total and direct bilirubin, aspartate aminotransferase (AST), alanine aminotransferase (ALT), alkaline phosphatase (ALP), gamma-glutamyl transferase (GGT), total protein, and serum albumin.The AST/ALT ratio was calculated for each patient. Renal function was assessed using serum urea and creatinine. Prothrombin time and international normalized ratio (INR) were measured to evaluate hepatic synthetic function. Metabolic assessment included fasting blood glucose and/or glycated hemoglobin (HbA1c) and serum lipid profile, wherever applicable. All biochemical investigations were performed using standardized laboratory methods in the institutional laboratory.
Radiological Assessment
Ultrasonography of the abdomen was performed to assess liver size and echotexture, nodularity of the liver surface, portal vein diameter, splenomegaly, ascites, and other features suggestive of chronic liver disease and portal hypertension. Additional imaging investigations were performed when clinically indicated.
Outcome Measures
The primary outcome was the comparison of clinical and biochemical profiles between alcoholic and NASH-related cirrhosis. Clinical variables included presenting manifestations, metabolic comorbidities, and features of hepatic decompensation. Biochemical variables included AST, ALT, AST/ALT ratio, ALP, GGT, bilirubin, serum albumin, INR, renal function, and relevant metabolic parameters.
Statistical Analysis
Data were entered into a Microsoft Excel spreadsheet and analyzed using SPSS .21 statistical software package. Continuous variables were expressed as mean ± standard deviation (SD) for normally distributed data and as median with interquartile range (IQR) for non-normally distributed data. Categorical variables were expressed as frequencies and percentages.Continuous variables between the two groups were compared using the independent-samples Student's t-test for normally distributed variables and the Mann–Whitney U test for non-normally distributed variables. Categorical variables were compared using the Chi-square test or Fisher's exact test, as appropriate. The association between relevant clinical and biochemical parameters was also evaluated where applicable. A p-value <0.05 was considered statistically significant.
RESULTS:
A total of 98 patients with cirrhosis were included, comprising 49 patients with alcoholic cirrhosis and 49 with NASH-related cirrhosis.Patients with NASH-related cirrhosis were significantly older than those with alcoholic cirrhosis (55.7 ± 8.9 vs. 49.8 ± 9.6 years; p=0.002). Male predominance was significantly greater in the alcoholic cirrhosis group (91.8% vs. 59.2%; p<0.001). In contrast, patients with NASH-related cirrhosis had a significantly higher mean BMI (28.7 ± 3.8 vs. 23.4 ± 3.1 kg/m²; p<0.001) and a greater prevalence of obesity (51.0% vs. 14.3%; p<0.001), diabetes mellitus (61.2% vs. 20.4%; p<0.001), hypertension (55.1% vs. 18.4%; p<0.001), and dyslipidaemia (49.0% vs. 16.3%; p=0.001). These findings demonstrated a distinctly greater metabolic risk burden among patients with NASH-related cirrhosis (Table 1).Ascites/abdominal distension was significantly more frequent in patients with alcoholic cirrhosis than in those with NASH-related cirrhosis (71.4% vs. 51.0%; p=0.038). Similarly, jaundice was significantly more common in the alcoholic cirrhosis group (63.3% vs. 38.8%; p=0.015). Pedal edema (57.1% vs. 40.8%), splenomegaly (51.0% vs. 44.9%), upper gastrointestinal bleeding (28.6% vs. 20.4%), hepatic encephalopathy (26.5% vs. 12.2%), and hepatomegaly (32.7% vs. 24.5%) were also numerically more frequent in alcoholic cirrhosis, although these differences did not reach statistical significance (Table 2, Figure 1).Mean hemoglobin was significantly lower in patients with alcoholic cirrhosis compared with those with NASH-related cirrhosis (10.2 ± 2.0 vs. 11.3 ± 1.8 g/dL; p=0.005). The alcoholic cirrhosis group also had a higher mean total leukocyte count (8,460 ± 2,710 vs. 7,620 ± 2,340/mm³) and a lower mean platelet count (112.6 ± 48.7 vs. 131.8 ± 51.4 ×10³/mm³), although these differences were not statistically significant. Anemia was observed in 69.4% versus 51.0% (p=0.063), while thrombocytopenia was present in 63.3% versus 51.0% (p=0.220) of patients with alcoholic and NASH-related cirrhosis, respectively (Table 3).Patients with alcoholic cirrhosis demonstrated significantly greater biochemical evidence of hepatic dysfunction. Mean total bilirubin was significantly higher in alcoholic than NASH-related cirrhosis (4.8 ± 3.2 vs. 2.9 ± 2.1 mg/dL; p<0.001). AST levels (112.5 ± 57.8 vs. 64.7 ± 32.5 U/L; p<0.001), AST/ALT ratio (2.21 ± 0.72 vs. 1.13 ± 0.39; p<0.001), ALP (181.7 ± 73.5 vs. 153.8 ± 61.2 U/L; p=0.044), and GGT (186.4 ± 112.7 vs. 78.6 ± 54.3 U/L; p<0.001) were also significantly higher in the alcoholic cirrhosis group. Conversely, serum albumin was significantly lower (2.7 ± 0.6 vs. 3.1 ± 0.6 g/dL; p=0.001), while INR was significantly higher (1.62 ± 0.42 vs. 1.39 ± 0.34; p=0.004) in alcoholic cirrhosis. ALT and total protein did not differ significantly between the groups (Table 4, Figure 2).Renal function was comparable between the two groups, with no significant differences in serum creatinine (1.18 ± 0.52 vs. 1.10 ± 0.43 mg/dL; p=0.409) or serum urea (38.6 ± 16.8 vs. 35.4 ± 14.2 mg/dL; p=0.311). However, metabolic biochemical parameters were substantially higher in patients with NASH-related cirrhosis. Mean fasting blood glucose (139.7 ± 42.8 vs. 104.8 ± 28.6 mg/dL; p<0.001), HbA1c (7.0 ± 1.4% vs. 5.8 ± 0.9%; p<0.001), total cholesterol (171.8 ± 42.6 vs. 146.7 ± 38.5 mg/dL; p=0.003), triglycerides (164.2 ± 58.4 vs. 121.5 ± 45.7 mg/dL; p<0.001), and LDL-C (103.5 ± 34.8 vs. 82.6 ± 29.7 mg/dL; p=0.002) were significantly higher in the NASH-related cirrhosis group. HDL-C was comparable between the groups (p=0.270) (Table 5, Figure 3).The severity of liver disease was significantly greater among patients with alcoholic cirrhosis. The mean Child–Pugh score was significantly higher in alcoholic cirrhosis than in NASH-related cirrhosis (9.1 ± 2.0 vs. 7.8 ± 1.8; p=0.001), as was the mean MELD score (16.8 ± 5.7 vs. 13.9 ± 4.9; p=0.008). Child–Pugh Class C disease was significantly more frequent in alcoholic cirrhosis (36.7% vs. 18.4%; p=0.043), whereas the difference in Class A was borderline and Class B distribution was comparable. Any hepatic decompensation occurred in 79.6% of patients with alcoholic cirrhosis compared with 61.2% with NASH-related cirrhosis (p=0.047). Furthermore, two or more decompensating events were significantly more frequent in the alcoholic group (46.9% vs. 26.5%; p=0.036) (Table 6).
Table 1. Baseline demographic and metabolic characteristics of the study groups
|
Parameter |
Alcoholic cirrhosis (n=49) |
NASH-related cirrhosis (n=49) |
p-value |
|
Age (years), mean ± SD |
49.8 ± 9.6 |
55.7 ± 8.9 |
0.002 |
|
Male sex, n (%) |
45 (91.8) |
29 (59.2) |
<0.001 |
|
BMI (kg/m²), mean ± SD |
23.4 ± 3.1 |
28.7 ± 3.8 |
<0.001 |
|
Obesity, n (%) |
7 (14.3) |
25 (51.0) |
<0.001 |
|
Diabetes mellitus, n (%) |
10 (20.4) |
30 (61.2) |
<0.001 |
|
Hypertension, n (%) |
9 (18.4) |
27 (55.1) |
<0.001 |
|
Dyslipidaemia, n (%) |
8 (16.3) |
24 (49.0) |
0.001 |
Table 2. Comparison of clinical manifestations between alcoholic and NASH-related cirrhosis
|
Clinical feature |
Alcoholic cirrhosis (n=49), n (%) |
NASH-related cirrhosis (n=49), n (%) |
p-value |
|
Abdominal distension/ascites |
35 (71.4) |
25 (51.0) |
0.038 |
|
Jaundice |
31 (63.3) |
19 (38.8) |
0.015 |
|
Pedal edema |
28 (57.1) |
20 (40.8) |
0.106 |
|
Splenomegaly |
25 (51.0) |
22 (44.9) |
0.544 |
|
Upper GI bleeding |
14 (28.6) |
10 (20.4) |
0.347 |
|
Hepatic encephalopathy |
13 (26.5) |
6 (12.2) |
0.074 |
|
Hepatomegaly |
16 (32.7) |
12 (24.5) |
0.370 |
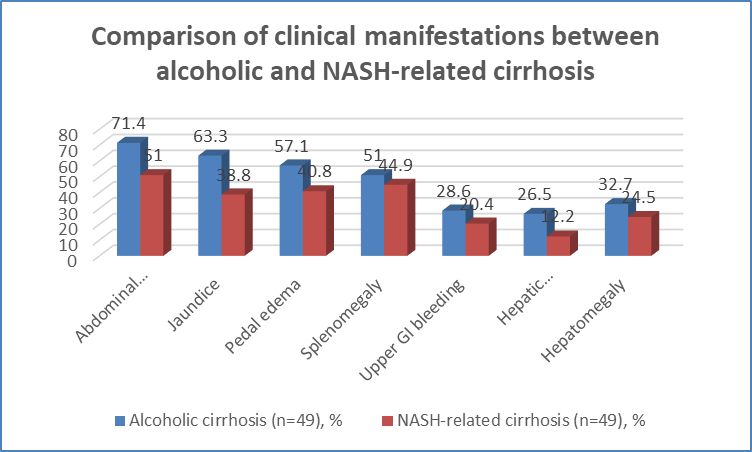
Figure 1 Comparison of clinical manifestations between alcoholic and NASH-related cirrhosis
Table 3. Comparison of hematological parameters between the study groups
|
Parameter |
Alcoholic cirrhosis (n=49) |
NASH-related cirrhosis (n=49) |
p-value |
|
Hemoglobin (g/dL), mean ± SD |
10.2 ± 2.0 |
11.3 ± 1.8 |
0.005 |
|
Total leukocyte count (/mm³), mean ± SD |
8,460 ± 2,710 |
7,620 ± 2,340 |
0.104 |
|
Platelet count (×10³/mm³), mean ± SD |
112.6 ± 48.7 |
131.8 ± 51.4 |
0.061 |
|
Anemia, n (%) |
34 (69.4) |
25 (51.0) |
0.063 |
|
Thrombocytopenia, n (%) |
31 (63.3) |
25 (51.0) |
0.220 |
Table 4. Comparison of liver biochemical parameters between alcoholic and NASH-related cirrhosis
|
Biochemical parameter |
Alcoholic cirrhosis (n=49) |
NASH-related cirrhosis (n=49) |
p-value |
|
Total bilirubin (mg/dL) |
4.8 ± 3.2 |
2.9 ± 2.1 |
<0.001 |
|
AST (U/L) |
112.5 ± 57.8 |
64.7 ± 32.5 |
<0.001 |
|
ALT (U/L) |
51.6 ± 27.4 |
58.9 ± 30.7 |
0.217 |
|
AST/ALT ratio |
2.21 ± 0.72 |
1.13 ± 0.39 |
<0.001 |
|
ALP (U/L) |
181.7 ± 73.5 |
153.8 ± 61.2 |
0.044 |
|
GGT (U/L) |
186.4 ± 112.7 |
78.6 ± 54.3 |
<0.001 |
|
Total protein (g/dL) |
6.3 ± 0.9 |
6.6 ± 0.8 |
0.085 |
|
Serum albumin (g/dL) |
2.7 ± 0.6 |
3.1 ± 0.6 |
0.001 |
|
INR |
1.62 ± 0.42 |
1.39 ± 0.34 |
0.004 |
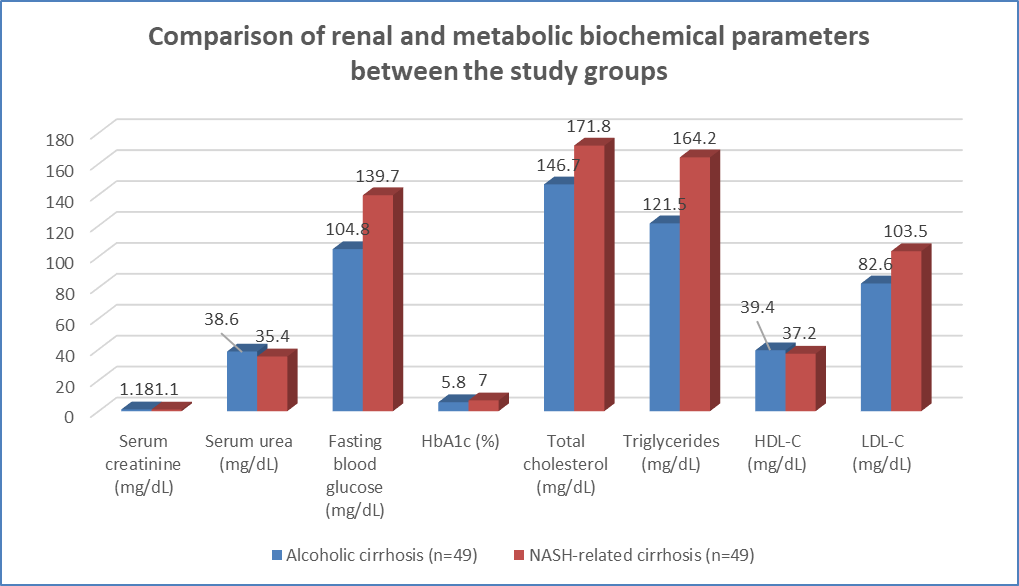
Figure 2 Comparison of liver biochemical parameters between alcoholic and NASH-related cirrhosis
Table 5. Comparison of renal and metabolic biochemical parameters between the study groups
|
Parameter |
Alcoholic cirrhosis (n=49) |
NASH-related cirrhosis (n=49) |
p-value |
|
Serum creatinine (mg/dL) |
1.18 ± 0.52 |
1.10 ± 0.43 |
0.409 |
|
Serum urea (mg/dL) |
38.6 ± 16.8 |
35.4 ± 14.2 |
0.311 |
|
Fasting blood glucose (mg/dL) |
104.8 ± 28.6 |
139.7 ± 42.8 |
<0.001 |
|
HbA1c (%) |
5.8 ± 0.9 |
7.0 ± 1.4 |
<0.001 |
|
Total cholesterol (mg/dL) |
146.7 ± 38.5 |
171.8 ± 42.6 |
0.003 |
|
Triglycerides (mg/dL) |
121.5 ± 45.7 |
164.2 ± 58.4 |
<0.001 |
|
HDL-C (mg/dL) |
39.4 ± 10.1 |
37.2 ± 9.5 |
0.270 |
|
LDL-C (mg/dL) |
82.6 ± 29.7 |
103.5 ± 34.8 |
0.002 |
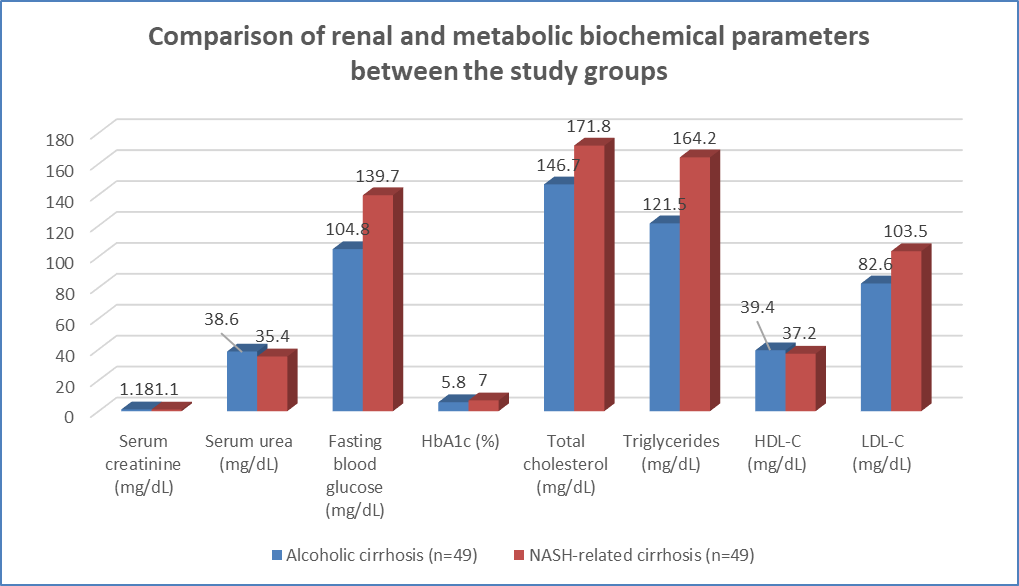
Figure 3 Comparison of renal and metabolic biochemical parameters between the study groups
Table 6. Comparison of severity and hepatic decompensation between alcoholic and NASH-related cirrhosis
|
Parameter |
Alcoholic cirrhosis (n=49) |
NASH-related cirrhosis (n=49) |
p-value |
|
Child–Pugh score, mean ± SD |
9.1 ± 2.0 |
7.8 ± 1.8 |
0.001 |
|
Child–Pugh Class A, n (%) |
8 (16.3) |
16 (32.7) |
0.059 |
|
Child–Pugh Class B, n (%) |
23 (46.9) |
24 (49.0) |
0.840 |
|
Child–Pugh Class C, n (%) |
18 (36.7) |
9 (18.4) |
0.043 |
|
MELD score, mean ± SD |
16.8 ± 5.7 |
13.9 ± 4.9 |
0.008 |
|
Any hepatic decompensation, n (%) |
39 (79.6) |
30 (61.2) |
0.047 |
|
≥2 decompensating events, n (%) |
23 (46.9) |
13 (26.5) |
0.036 |
DISCUSSION:
The present study compared the clinical and biochemical profiles of 98 patients with cirrhosis, including 49 patients with alcoholic cirrhosis and 49 with NASH-related cirrhosis. Significant differences were observed in demographic characteristics, metabolic risk factors, clinical manifestations, biochemical parameters, and severity of liver disease between the two groups.In the present study, patients with NASH-related cirrhosis were significantly older than those with alcoholic cirrhosis (55.7 ± 8.9 vs. 49.8 ± 9.6 years; p=0.002). Alcoholic cirrhosis showed a marked male predominance (91.8% vs. 59.2%; p<0.001). In contrast, NASH-related cirrhosis demonstrated a prominent metabolic phenotype, with significantly higher BMI (28.7 ± 3.8 vs. 23.4 ± 3.1 kg/m²), obesity (51.0% vs. 14.3%), diabetes mellitus (61.2% vs. 20.4%), hypertension (55.1% vs. 18.4%), and dyslipidaemia (49.0% vs. 16.3%). These findings support the well-established association between NASH and cardiometabolic risk factors.Clinical manifestations suggestive of hepatic decompensation were more frequent among patients with alcoholic cirrhosis. Ascites was observed in 71.4% of alcoholic cirrhosis patients compared with 51.0% of NASH-related cirrhosis patients (p=0.038), while jaundice was present in 63.3% and 38.8%, respectively (p=0.015). Hepatic encephalopathy was also more frequent in alcoholic cirrhosis (26.5% vs. 12.2%), although this difference was not statistically significant. These findings indicated a greater burden of clinically overt hepatic dysfunction among alcoholic cirrhosis patients in the present cohort.A particularly important finding was the difference in aminotransferase patterns. Mean AST was significantly higher in alcoholic cirrhosis than in NASH-related cirrhosis (112.5 ± 57.8 vs. 64.7 ± 32.5 U/L; p<0.001), whereas ALT levels were comparable (51.6 ± 27.4 vs. 58.9 ± 30.7 U/L; p=0.217). Consequently, the AST/ALT ratio was significantly higher in alcoholic cirrhosis (2.21 ± 0.72) than in NASH-related cirrhosis (1.13 ± 0.39; p<0.001). Sorbi et al.[17] studied 70 patients with NASH and 70 with alcoholic liver disease and similarly reported a mean AST/ALT ratio of 0.9 in NASH compared with 2.6 in alcoholic liver disease. They also reported mean AST levels of 66 U/L versus 152 U/L and ALT levels of 91 U/L versus 70 U/L in NASH and alcoholic liver disease, respectively. Interestingly, among their NASH patients, the AST/ALT ratio increased from 0.7 in patients without fibrosis to 1.4 in those with cirrhosis, indicating that advanced NASH can also produce AST predominance. The present findings were also comparable with those of Torkadi et al.[18], who evaluated 50 patients with alcoholic liver disease and 35 patients with NASH. They demonstrated that patients with alcoholic liver disease had an AST/ALT ratio >2 and significantly higher GGT and ALP compared with patients with NASH (p<0.05). In our study, GGT was markedly higher in alcoholic cirrhosis (186.4 ± 112.7 vs. 78.6 ± 54.3 U/L; p<0.001), while ALP was also significantly elevated (181.7 ± 73.5 vs. 153.8 ± 61.2 U/L; p=0.044). Thus, the biochemical pattern observed in our patients closely corresponded with previously reported differences between alcoholic and non-alcoholic liver disease.In contrast, metabolic biochemical abnormalities were significantly more pronounced in NASH-related cirrhosis. Fasting blood glucose (139.7 vs. 104.8 mg/dL), HbA1c (7.0% vs. 5.8%), total cholesterol (171.8 vs. 146.7 mg/dL), triglycerides (164.2 vs. 121.5 mg/dL), and LDL-C (103.5 vs. 82.6 mg/dL) were significantly higher in the NASH group. This finding complements the higher prevalence of obesity, diabetes, hypertension, and dyslipidaemia observed in these patients and reinforces the close relationship between NASH and metabolic dysfunction.Alcoholic cirrhosis was also associated with greater severity of liver disease. The mean Child–Pugh score was significantly higher in alcoholic than NASH-related cirrhosis (9.1 ± 2.0 vs. 7.8 ± 1.8; p=0.001), as was the MELD score (16.8 ± 5.7 vs. 13.9 ± 4.9; p=0.008). Child–Pugh class C disease occurred in 36.7% versus 18.4% (p=0.043), while hepatic decompensation was observed in 79.6% versus 61.2% (p=0.047).
CONCLUSION:
The present study demonstrated distinct clinical and biochemical profiles between alcoholic and NASH-related cirrhosis. Alcoholic cirrhosis was associated with greater AST predominance, higher AST/ALT ratio, GGT and bilirubin levels, and more advanced hepatic decompensation. In contrast, NASH-related cirrhosis was characterized by higher BMI and a greater prevalence of diabetes, hypertension, dyslipidaemia, and metabolic abnormalities. These differences may assist in etiological characterization, risk assessment, and appropriate management of patients with cirrhosis.
Limitations
The present study was limited by its relatively small sample size and single-center design, which may restrict the generalizability of the findings. The classification of cirrhosis etiology partly depended on the history of alcohol consumption, which may be subject to recall or reporting bias. Additionally, the cross-sectional nature of the study precluded assessment of disease progression and long-term clinical outcomes.
REFERENCES:
1. Shah SN. Alcoholic liver disease. In: API textbook of medicine. 7th ed. New Delhi: Jaypee Brothers Medical Publishers; 2003. p. 606-15.
2. Rosen HR, Keefe EB. Evaluation of abnormal liver enzymes, use of liver tests and serology of viral hepatitis. In: Liver disease: diagnosis and management. 1st ed. New York: Churchill Livingstone; 2000. p. 24-35.
3. Sherlock S. Assessment of liver function. In: Diseases of the liver and biliary system. 10th ed. London: Blackwell; 1997. p. 17-32.
4. Friedman SF, Martin P, Munoz JS. Laboratory evaluation of the patient with liver disease. In: Hepatology: a textbook of liver disease. Vol. 1. Philadelphia: Saunders; 2003. p. 661-709.
5. Boyde TRC, Lather AL. Starch gel electrophoresis of transaminases in human tissue extracts and serum. Biochem J. 1961;82:52-7.
6. Nalpas B, Vassault A, Charpin S. Serum mitochondrial AST as a marker of chronic alcoholism: diagnostic value and interpretation in a liver unit. Hepatology. 1986;6:608-13.
7. Wong F, Blendis L. Alcoholic liver disease. In: Thomson ABR, Shaffer EA, editors. First principles of gastroenterology: the basis of disease and an approach to management. 3rd ed. Edmonton: Canadian Association of Gastroenterology; 1997. p. 502-6.
8. Bain VG, Ma M. Chronic hepatitis. In: Thomson ABR, Shaffer EA, editors. First principles of gastroenterology: the basis of disease and an approach to management. 3rd ed. Edmonton: Canadian Association of Gastroenterology; 1997. p. 492-501.
9. Mittal A, Sathian B, Kumar A, Chandrasekharan N, Yadav SK. The significance of transaminases and De Ritis ratio for predicting alcoholic liver disease: a hospital based comparative study in western Nepal. Nepal J Epidemiol. 2010;1(1):33-7.
10. Bruha R, Dvorak K, Petrtyl J. Alcoholic liver disease. World J Hepatol. 2012;4(3):81-90.
11. Arthi M, Niranjan G, Hanifah M, Srinivasan AR. Efficacy of De Ritis ratio in diagnosing liver diseases in Puducherry population. Adv Lab Med Int. 2011;1(4):61-8.
12. Laffaine MG, Mauricio LM. Non-alcoholic fatty liver disease. Ann Hepatol. 2004;3(3):93-9.
13. Obika M, Noguchi H. Diagnosis and evaluation of nonalcoholic fatty liver disease. Exp Diabetes Res. 2012;2012:145754.
14. Correia JP, Alves PS, Camilo EA. SGOT-SGPT ratios. Dig Dis Sci. 1981;26(3):284.
15. Barsić N, Lerotić I, Smirčić-Duvnjak L, Tomašić V, Duvnjak M. Overview and developments in noninvasive diagnosis of nonalcoholic fatty liver disease. World J Gastroenterol. 2012;18(30):3945-54.
16. Hagerstrand I. Distribution of ALP activity in healthy and diseased human liver tissues. Acta Pathol Microbiol Scand. 1975;83:519-24.
17. Sorbi D, Boynton J, Lindor KD. The ratio of aspartate aminotransferase to alanine aminotransferase: potential value in differentiating nonalcoholic steatohepatitis from alcoholic liver disease. Am J Gastroenterol. 1999 Apr;94(4):1018-22.
18. Sorbi D, Boynton J, Lindor KD. The ratio of aspartate aminotransferase to alanine aminotransferase: potential value in differentiating nonalcoholic steatohepatitis from alcoholic liver disease. Am J Gastroenterol. 1999 Apr;94(4):1018-22.