Correlation of vitamin D deficiency with glycemic control and insulin resistance in type 2 diabetes.
- Dr. Venkatesh V. Madholli , Senior Resident Department of General Medicine KMCRI, Hubli
- Dr. Veeresh S. Balehosur , Senior Resident Department of General Medicine JMNMC, Nadia
- Dr. Vishwanath Bandargal , Assistant Professor Department of Medicine KMCRI, Hubli
Article Information:
Abstract:
Background: Vitamin D deficiency is frequently observed in patients with type 2 diabetes mellitus (T2DM) and may influence pancreatic β-cell function, insulin sensitivity, and glucose metabolism. This study evaluated the correlation of serum vitamin D levels with glycemic control and insulin resistance in patients with T2DM. Methods: This cross-sectional observational study included 110 patients with T2DM. Demographic and clinical characteristics were recorded, and fasting plasma glucose, postprandial glucose, glycated hemoglobin (HbA1c), serum 25-hydroxyvitamin D [25(OH)D], fasting insulin, and Homeostatic Model Assessment of Insulin Resistance (HOMA-IR) were assessed. Participants were categorized as vitamin D deficient, insufficient, or sufficient. Correlation and multivariable regression analyses were performed. Results: The mean age was 53.6 ± 10.8 years, and 55.5% were males. Vitamin D deficiency was present in 51.8%, insufficiency in 30.9%, and sufficiency in 17.3%. Vitamin D-deficient patients had significantly higher HbA1c (8.78 ± 1.28% vs. 6.95 ± 0.82%), fasting insulin (16.2 ± 5.6 vs. 9.9 ± 3.2 µIU/mL), and HOMA-IR (6.83 ± 2.61 vs. 3.08 ± 1.16) than vitamin D-sufficient patients (all p<0.001). Serum 25(OH)D showed significant inverse correlations with HbA1c (r=−0.486, p<0.001) and HOMA-IR (r=−0.452, p<0.001). HbA1c ≥8% (AOR 2.74), elevated HOMA-IR (AOR 2.51), and BMI ≥25 kg/m² (AOR 2.08) were independently associated with vitamin D deficiency. Conclusion: Vitamin D deficiency was common in T2DM and was significantly associated with poorer glycemic control and greater insulin resistance. Further prospective studies are needed to determine causality and potential benefits of vitamin D supplementation.
Keywords:
Article :
INTRODUCTION:
Type 2 diabetes mellitus (T2DM) is a chronic metabolic disorder characterized by persistent hyperglycemia resulting from insulin resistance, progressive pancreatic β-cell dysfunction, and relative insulin deficiency. It has emerged as a major global public health problem, contributing substantially to morbidity, mortality, and healthcare burden[1]. The prevalence of T2DM is increasing rapidly, particularly in developing countries such as India, emphasizing the need to identify potentially modifiable factors that influence glycemic control and insulin resistance.Vitamin D, commonly referred to as the “sunshine hormone,” is predominantly synthesized in the skin following exposure to ultraviolet-B radiation. Although traditionally recognized for its essential role in calcium and bone metabolism, vitamin D is now known to exert several extraskeletal effects [1,2]. The widespread distribution of vitamin D receptors (VDRs) in various tissues, including pancreatic β-cells, skeletal muscle, and adipose tissue, suggests an important role in metabolic regulation, including glucose and insulin homeostasis [3].
Vitamin D deficiency is a major public health concern worldwide and is highly prevalent in India despite abundant sunlight exposure [4]. Serum 25-hydroxyvitamin D [25(OH)D] is considered the most reliable marker of vitamin D status. Several epidemiological studies have demonstrated an association between low serum 25(OH)D concentrations and impaired glucose tolerance, insulin resistance, metabolic syndrome, and T2DM [5–7]. However, whether vitamin D deficiency contributes directly to poor glycemic control or occurs as a consequence of obesity, sedentary lifestyle, dietary factors, or other metabolic abnormalities remains uncertain.Several biological mechanisms support a possible relationship between vitamin D and glucose metabolism. Vitamin D may enhance pancreatic β-cell function and insulin secretion through VDR-mediated mechanisms and regulation of intracellular calcium, which is essential for insulin exocytosis [8,9]. It may also improve peripheral insulin sensitivity in skeletal muscle and adipose tissue. Furthermore, the immunomodulatory and anti-inflammatory properties of vitamin D may influence insulin resistance by suppressing pro-inflammatory mediators such as interleukin-1, interleukin-6, tumour necrosis factor-alpha, and nuclear factor-kappa B signalling [10,11]. Vitamin D deficiency may additionally impair insulin sensitivity indirectly through secondary elevation of parathyroid hormone [12].Glycated hemoglobin (HbA1c) is an established marker of long-term glycemic control, whereas fasting insulin and the Homeostatic Model Assessment of Insulin Resistance (HOMA-IR) provide useful measures of insulin resistance [13,14]. Previous studies have reported inverse relationships between serum 25(OH)D levels, HbA1c, and HOMA-IR; however, findings have not been entirely consistent across populations.Given the high prevalence of both vitamin D deficiency and T2DM, particularly in India, further evaluation of their relationship is clinically relevant. Therefore, the present study was undertaken to assess the correlation of serum vitamin D levels with glycemic control and insulin resistance in patients with type 2 diabetes mellitus, with particular emphasis on HbA1c, fasting insulin, and HOMA-IR.
MATERIALS AND METHODS:
This hospital-based, cross-sectional observational study was conducted in the Department of General Medicine at in KMCRI Hubballi. The study was carried out among adult patients with type 2 diabetes mellitus (T2DM) attending the outpatient department and/or admitted to the hospital during the study period.
The study included patients with an established diagnosis of T2DM who fulfilled the predefined eligibility criteria. Participants were evaluated for serum vitamin D status, glycemic control, fasting insulin levels, and insulin resistance.A total of 110 patients with type 2 diabetes mellitus were included in the study.
Inclusion Criteria
Patients aged 18 years or above with an established diagnosis of T2DM who attended the study centre during the study period were included. Only patients who provided written informed consent and underwent the required biochemical investigations were enrolled.
Exclusion Criteria
Patients with type 1 diabetes mellitus, gestational diabetes, chronic kidney disease, chronic liver disease, malabsorption disorders, or other major endocrine disorders known to affect vitamin D or glucose metabolism were excluded. Patients receiving vitamin D or calcium supplementation in the recent past and those receiving medications known to significantly alter vitamin D metabolism were also excluded.
Data Collection
After enrolment, demographic and clinical information was recorded using a predefined data collection form. Data included age, sex, duration of diabetes, treatment history, relevant comorbidities, and other pertinent clinical characteristics. A detailed medical history was obtained, followed by a general physical and systemic examination.
Anthropometric Assessment
Height and weight were measured using standard procedures. Body mass index (BMI) was calculated as weight in kilograms divided by the square of height in metres (kg/m²).
Biochemical Investigations
After an overnight fast, venous blood samples were collected under aseptic precautions. Fasting plasma glucose, fasting serum insulin, glycated hemoglobin (HbA1c), and serum 25-hydroxyvitamin D [25(OH)D] concentrations were measured using standard laboratory methods. Other routine biochemical investigations were performed whenever clinically indicated.
Assessment of Vitamin D Status
Serum 25-hydroxyvitamin D [25(OH)D] concentration was used to assess vitamin D status. Participants were categorized according to serum 25(OH)D levels using the predefined laboratory/reference criteria. The relationship between serum vitamin D concentration and measures of glycemic control and insulin resistance was subsequently evaluated.
Assessment of Glycemic Control
Glycemic status was assessed using fasting plasma glucose and HbA1c. HbA1c was considered the principal indicator of long-term glycemic control. Serum 25(OH)D concentrations were correlated with HbA1c and fasting plasma glucose to determine their relationship with glycemic status.
Assessment of Insulin Resistance
Insulin resistance was estimated using the Homeostatic Model Assessment of Insulin Resistance (HOMA-IR). HOMA-IR was calculated from fasting insulin and fasting plasma glucose values using the following formula:
HOMA-IR = Fasting insulin (µIU/mL) × Fasting plasma glucose (mg/dL) / 405
Higher HOMA-IR values indicated greater insulin resistance. The relationship of serum 25(OH)D concentration with fasting insulin and HOMA-IR was evaluated.
Study Outcomes
The primary outcome was the correlation between serum 25(OH)D levels and glycemic control, particularly HbA1c, among patients with T2DM. The relationship between serum 25(OH)D levels and insulin resistance, as assessed by fasting insulin and HOMA-IR, was also evaluated. Secondary analyses compared glycemic and insulin-resistance parameters according to vitamin D status.
Statistical Analysis
Data were entered into a computerized database and analyzed using SPSS.21statistical software. Continuous variables were expressed as mean ± standard deviation (SD) or median with interquartile range (IQR) according to their distribution, while categorical variables were presented as frequencies and percentages. Normality of continuous variables was assessed using the Shapiro–Wilk test.Comparisons of continuous variables between groups were performed using the independent-samples t-test or Mann–Whitney U test, as appropriate. For comparisons involving more than two groups, one-way ANOVA or the Kruskal–Wallis test was used. Categorical variables were compared using the Chi-square test or Fisher’s exact test, as appropriate.
The correlation of serum 25(OH)D levels with HbA1c, fasting plasma glucose, fasting insulin, and HOMA-IR was assessed using Pearson’s or Spearman’s correlation coefficient, depending on data distribution. Where appropriate, multivariable regression analysis was performed to evaluate the independent association of vitamin D status with glycemic control and insulin resistance after adjustment for potential confounding variables. A p-value <0.05 was considered statistically significant.
Ethical Considerations
The study was conducted after obtaining approval from the Institutional Ethics Committee of the study institution. Written informed consent was obtained from all participants before enrolment. Patient confidentiality and privacy were maintained throughout the study, and all procedures were performed in accordance with applicable ethical principles.
RESULTS:
A total of 110 patients with type 2 diabetes mellitus were included in the study. The mean age of the participants was 53.6 ± 10.8 years; 67 (60.9%) were aged >50 years. There were 61 (55.5%) males and 49 (44.5%) females. The mean BMI was 27.1 ± 3.9 kg/m², with 43.6% of participants being overweight and 29.1% obese. The mean duration of diabetes was 7.4 ± 4.6 years, and 56.4% had diabetes for >5 years. Hypertension was present in 42.7%, while 46.4% had a family history of diabetes. The baseline demographic and clinical characteristics are summarized in Table 1.
The mean fasting plasma glucose and postprandial plasma glucose levels were 154.8 ± 39.6 mg/dL and 226.5 ± 58.7 mg/dL, respectively, while the mean HbA1c was 8.12 ± 1.42%. The mean serum 25(OH)D level was 20.7 ± 9.3 ng/mL. Mean fasting serum insulin was 13.8 ± 5.7 µIU/mL, and mean HOMA-IR was 5.31 ± 2.65. The biochemical, glycemic, vitamin D, and insulin-resistance parameters are presented in Table 2 and illustrated in Figure 1.
According to serum 25(OH)D levels, 57 (51.8%) participants were vitamin D deficient, 34 (30.9%) were vitamin D insufficient, and only 19 (17.3%) had sufficient vitamin D levels. Thus, more than four-fifths of the study population had either deficient or insufficient vitamin D levels. The distribution of participants according to vitamin D status is shown in Table 3 and Figure 2.
A significant gradient in glycemic control and insulin resistance was observed across vitamin D categories. Participants with vitamin D deficiency had significantly higher fasting glucose (171.2 ± 38.7 mg/dL), postprandial glucose (249.6 ± 56.8 mg/dL), HbA1c (8.78 ± 1.28%), fasting insulin (16.2 ± 5.6 µIU/mL), and HOMA-IR (6.83 ± 2.61) compared with participants with insufficient or sufficient vitamin D levels. All between-group differences were statistically significant (p<0.001). These findings are presented in Table 4.
Correlation analysis demonstrated that serum 25(OH)D levels were significantly and inversely correlated with fasting plasma glucose (r=−0.421, p<0.001), postprandial plasma glucose (r=−0.398, p<0.001), HbA1c (r=−0.486, p<0.001), fasting serum insulin (r=−0.372, p<0.001), and HOMA-IR (r=−0.452, p<0.001). Significant inverse correlations were also observed with BMI (r=−0.264, p=0.005) and duration of diabetes (r=−0.218, p=0.022). The correlation findings are summarized in Table 5.
On multivariable logistic regression analysis, BMI ≥25 kg/m² was independently associated with vitamin D deficiency (adjusted OR [AOR] 2.08, 95% CI 1.01–4.29; p=0.047). Similarly, HbA1c ≥8% was associated with higher odds of vitamin D deficiency (AOR 2.74, 95% CI 1.30–5.77; p=0.008), while elevated HOMA-IR was independently associated with approximately 2.5-fold higher odds of vitamin D deficiency (AOR 2.51, 95% CI 1.18–5.34; p=0.017). Age >50 years, female sex, diabetes duration >5 years, elevated fasting insulin, and hypertension were not statistically significant after adjustment. The multivariable regression results are presented in Table 6 and graphically illustrated in Figure 3.
Table 1. Baseline demographic and clinical characteristics of study participants (N=110)
|
Parameter |
Value |
|
Age (years), mean ± SD |
53.6 ± 10.8 |
|
Age ≤50 years, n (%) |
43 (39.1) |
|
Age >50 years, n (%) |
67 (60.9) |
|
Male, n (%) |
61 (55.5) |
|
Female, n (%) |
49 (44.5) |
|
BMI (kg/m²), mean ± SD |
27.1 ± 3.9 |
|
Normal BMI, n (%) |
30 (27.3) |
|
Overweight, n (%) |
48 (43.6) |
|
Obese, n (%) |
32 (29.1) |
|
Duration of diabetes (years), mean ± SD |
7.4 ± 4.6 |
|
Duration ≤5 years, n (%) |
48 (43.6) |
|
Duration >5 years, n (%) |
62 (56.4) |
|
Hypertension, n (%) |
47 (42.7) |
|
Family history of diabetes, n (%) |
51 (46.4) |
Table 2. Biochemical, glycemic, vitamin D, and insulin-resistance parameters (N=110)
|
Parameter |
Value, mean ± SD |
|
Fasting plasma glucose (mg/dL) |
154.8 ± 39.6 |
|
Postprandial plasma glucose (mg/dL) |
226.5 ± 58.7 |
|
HbA1c (%) |
8.12 ± 1.42 |
|
Serum 25(OH)D (ng/mL) |
20.7 ± 9.3 |
|
Fasting serum insulin (µIU/mL) |
13.8 ± 5.7 |
|
HOMA-IR |
5.31 ± 2.65 |
|
Serum calcium (mg/dL) |
9.1 ± 0.6 |
|
Serum creatinine (mg/dL) |
0.92 ± 0.21 |
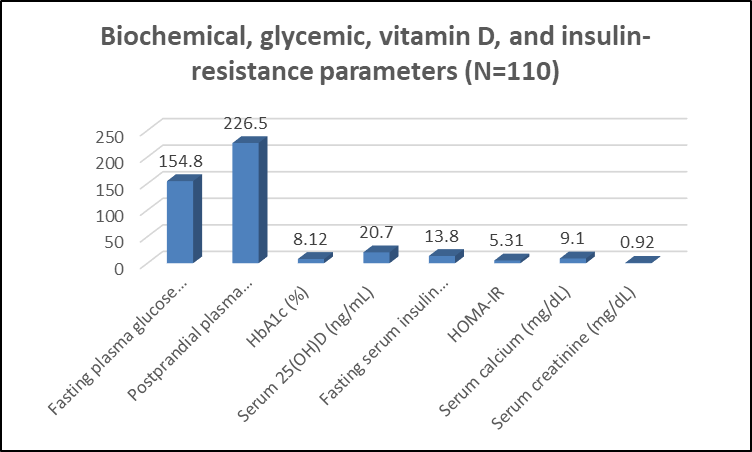
Figure 1 Biochemical, glycemic, vitamin D, and insulin-resistance parameters (N=110)
Table 3. Distribution according to vitamin D status (N=110)
|
Vitamin D status |
Serum 25(OH)D level |
n |
% |
|
Deficient |
<20 ng/mL |
57 |
51.8 |
|
Insufficient |
20–29.9 ng/mL |
34 |
30.9 |
|
Sufficient |
≥30 ng/mL |
19 |
17.3 |
|
Total |
110 |
100.0 |
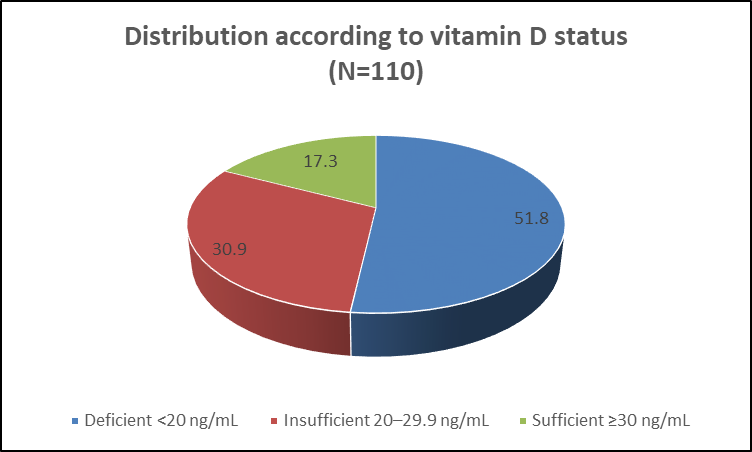
Figure 2 Distribution according to vitamin D status (N=110)
Table 4. Comparison of glycemic control and insulin resistance according to vitamin D status
|
Parameter |
Deficient (n=57) |
Insufficient (n=34) |
Sufficient (n=19) |
p-value |
Test |
|
Fasting glucose (mg/dL) |
171.2 ± 38.7 |
143.8 ± 32.4 |
125.3 ± 25.6 |
<0.001 |
One-way ANOVA |
|
Postprandial glucose (mg/dL) |
249.6 ± 56.8 |
211.7 ± 46.9 |
183.8 ± 39.5 |
<0.001 |
One-way ANOVA |
|
HbA1c (%) |
8.78 ± 1.28 |
7.67 ± 1.05 |
6.95 ± 0.82 |
<0.001 |
One-way ANOVA |
|
Fasting insulin (µIU/mL) |
16.2 ± 5.6 |
11.9 ± 4.1 |
9.9 ± 3.2 |
<0.001 |
One-way ANOVA |
|
HOMA-IR |
6.83 ± 2.61 |
4.23 ± 1.72 |
3.08 ± 1.16 |
<0.001 |
One-way ANOVA |
Table 5. Correlation of serum 25(OH)D with glycemic and insulin-resistance parameters
|
Parameter |
Correlation coefficient (r) |
p-value |
|
Fasting plasma glucose |
−0.421 |
<0.001 |
|
Postprandial plasma glucose |
−0.398 |
<0.001 |
|
HbA1c |
−0.486 |
<0.001 |
|
Fasting serum insulin |
−0.372 |
<0.001 |
|
HOMA-IR |
−0.452 |
<0.001 |
|
BMI |
−0.264 |
0.005 |
|
Duration of diabetes |
−0.218 |
0.022 |
Table 6. Multivariable logistic regression for factors associated with vitamin D deficiency
|
Variable |
Adjusted OR |
95% CI |
p-value |
|
Age >50 years |
1.42 |
0.69–2.94 |
0.341 |
|
Female sex |
1.31 |
0.64–2.68 |
0.459 |
|
BMI ≥25 kg/m² |
2.08 |
1.01–4.29 |
0.047 |
|
Diabetes duration >5 years |
1.62 |
0.79–3.33 |
0.189 |
|
HbA1c ≥8% |
2.74 |
1.30–5.77 |
0.008 |
|
Elevated fasting insulin |
1.83 |
0.88–3.82 |
0.106 |
|
Elevated HOMA-IR |
2.51 |
1.18–5.34 |
0.017 |
|
Hypertension |
1.29 |
0.62–2.68 |
0.495 |
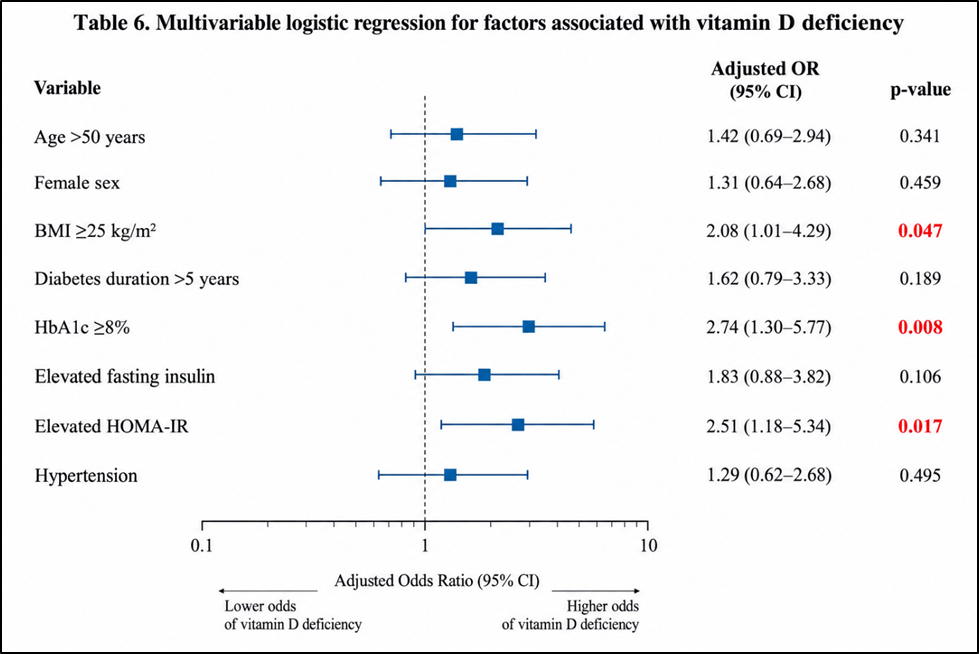
Figure 3 Multivariable logistic regression for factors associated with vitamin D deficiency
DISCUSSION:
The present study evaluated the relationship between vitamin D status, glycemic control, and insulin resistance among 110 patients with type 2 diabetes mellitus (T2DM). The mean age of the participants was 53.6 ± 10.8 years, mean BMI was 27.1 ± 3.9 kg/m², and mean duration of diabetes was 7.4 ± 4.6 years. Vitamin D deficiency (<20 ng/mL) was observed in 51.8% of patients, while 30.9% had vitamin D insufficiency and only 17.3% had sufficient levels. Thus, 82.7% of our patients had suboptimal vitamin D levels, demonstrating the frequent coexistence of hypovitaminosis D and T2DM.
The mean serum 25(OH)D concentration in our study was 20.7 ± 9.3 ng/mL. Sheth et al. [1], in a Western Indian study involving 429 T2DM cases and 483 non-diabetic controls, reported vitamin D deficiency in 91.4% of patients with T2DM and 93.0% of controls. Although the prevalence reported by Sheth et al.[15] was higher than that observed in our study, both studies demonstrate a considerable burden of vitamin D deficiency. However, Sheth et al. found no significant association between vitamin D deficiency and HbA1c (p=0.057) or HOMA-IR (p=0.257) among T2DM patients.
In the present study, mean fasting plasma glucose, postprandial glucose, and HbA1c were 154.8 ± 39.6 mg/dL, 226.5 ± 58.7 mg/dL, and 8.12 ± 1.42%, respectively. Glycemic parameters worsened significantly with decreasing vitamin D levels. Vitamin D-deficient patients had significantly higher fasting glucose than vitamin D-sufficient patients (171.2 ± 38.7 vs. 125.3 ± 25.6 mg/dL), while HbA1c was 8.78 ± 1.28% versus 6.95 ± 0.82%, respectively (p<0.001). These findings indicate a strong association between lower vitamin D status and poorer glycemic control.
A particularly important observation was the association of vitamin D deficiency with insulin resistance. Fasting insulin was significantly higher in vitamin D-deficient than vitamin D-sufficient patients (16.2 ± 5.6 vs. 9.9 ± 3.2 µIU/mL). Similarly, HOMA-IR was 6.83 ± 2.61 among deficient patients compared with 3.08 ± 1.16 among sufficient patients (p<0.001). Serum 25(OH)D showed significant inverse correlations with fasting glucose (r=−0.421), postprandial glucose (r=−0.398), HbA1c (r=−0.486), fasting insulin (r=−0.372), and HOMA-IR (r=−0.452). These findings suggest that decreasing vitamin D concentrations were associated with both worsening glycemic control and increasing insulin resistance.
Our observations are supported by the meta-analysis of 46 randomized controlled trials involving 4,313 participants by Mohamad et al. [16]. Vitamin D supplementation significantly reduced fasting glucose by 5.02 mg/dL, HbA1c by 0.20%, and HOMA-IR by 0.42 units, with more prominent effects among vitamin D-deficient participants. Similarly, Chen et al. [17], in an updated meta-analysis of 39 randomized controlled trials involving 2,982 participants, reported significant reductions in fasting glucose (WMD −0.49 mmol/L), HbA1c (−0.30%), fasting insulin (−1.31 µIU/mL), and HOMA-IR (−0.39) following vitamin D supplementation.
Further supporting these findings, Theik et al. [18] conducted an umbrella review and reported that lower serum 25(OH)D concentrations were associated with a 34% higher relative risk of T2DM (pooled RR 1.34; 95% CI 1.16–1.53). Vitamin D supplementation was associated with improvements in fasting glucose, HbA1c, insulin, and HOMA-IR, with greater improvements in HbA1c (−0.27) and HOMA-IR (−0.52) among vitamin D-deficient patients. An earlier umbrella review by Miao et al. [19], incorporating 37 meta-analyses and 36,197 adults, similarly demonstrated significant reductions in fasting glucose, HbA1c, insulin, and HOMA-IR following vitamin D supplementation.
Nevertheless, the available evidence remains heterogeneous. A recent randomized controlled trial in newly diagnosed T2DM found no significant improvement in HbA1c (p=0.263), fasting glucose, postprandial glucose, fasting insulin, or HOMA-IR after six months of vitamin D supplementation . This contrasts with our observed cross-sectional associations and highlights that an association between low vitamin D and adverse metabolic parameters does not necessarily establish a therapeutic effect of supplementation.
In our multivariable analysis, HbA1c ≥8% (AOR 2.74; 95% CI 1.30–5.77; p=0.008), elevated HOMA-IR (AOR 2.51; 95% CI 1.18–5.34; p=0.017), and BMI ≥25 kg/m² (AOR 2.08; 95% CI 1.01–4.29; p=0.047) were independently associated with vitamin D deficiency. Overall, the findings of the present study demonstrate a significant inverse association of serum vitamin D with both glycemic control and insulin resistance. These observations are broadly consistent with recent meta-analytic evidence, although differences across individual studies may reflect variations in baseline vitamin D status, BMI, ethnicity, duration of diabetes, antidiabetic treatment, vitamin D supplementation protocols, and other metabolic factors.
CONCLUSION:
The present study demonstrated a high prevalence of vitamin D deficiency among patients with type 2 diabetes mellitus. Lower serum 25(OH)D levels were significantly associated with poorer glycemic control, higher fasting insulin levels, and greater insulin resistance. Significant inverse correlations were observed between vitamin D levels and HbA1c and HOMA-IR. These findings suggest that vitamin D status may be an important metabolic correlate in T2DM, although prospective studies are required to establish causality and the benefits of vitamin D supplementation.
LIMITATIONS
The cross-sectional design of the study limited the ability to establish a causal relationship between vitamin D deficiency, poor glycemic control, and insulin resistance. The relatively small sample size and single-centre setting may limit the generalizability of the findings. Potential confounding factors such as dietary vitamin D intake, sunlight exposure, physical activity, seasonal variation, and antidiabetic treatment were not comprehensively assessed.
REFERENCES:
1. Kochupillai N. The physiology of vitamin D. Indian J Med Res. 2008;127:256-262.
2. Nagpal S, Na S, Rathnachalam R. Noncalcemic actions of vitamin D receptor ligands. Endocr Rev. 2005;26:662-687.
3. Zittermann A. Vitamin D in preventive medicine: are we ignoring the evidence? Br J Nutr. 2003;89(5):552-572.
4. Holick MF. Vitamin D deficiency. N Engl J Med. 2007;357:266-281.
5. Takiishi T, Gysemans C, Bouillon R, Mathieu C. Vitamin D and diabetes. Rheum Dis Clin North Am. 2012;38(1):179-206.
6. Knekt P, Laaksonen M, Mattila C, Härkänen T, Marniemi J, Heliövaara M, et al. Serum vitamin D and subsequent occurrence of type 2 diabetes. Epidemiology. 2008;19(5):666-671.
7. Pittas AG, Sun Q, Manson JE, Dawson-Hughes B, Hu FB. Plasma 25-hydroxyvitamin D concentration and risk of incident type 2 diabetes in women. Diabetes Care. 2010;33:2021-2023.
8. Ramachandran A, Snehalatha C. Current scenario of diabetes in India. J Diabetes. 2009;1(1):18-28.
9. Mohan V, Sandeep S, Deepa R, Shah B, Varghese C. Epidemiology of type 2 diabetes: Indian scenario. Indian J Med Res. 2007;125:217-230.
10. Hodgkin P, Hine PM, Kay GH, Lumb GA, Stanbury SW. Vitamin D deficiency in Asians at home and in Britain. Lancet. 1973;2:167-172.
11. Harinarayan CV, Gupta N, Kochupillai N. Vitamin D status in primary hyperparathyroidism in India. Clin Endocrinol (Oxf). 1995;43:351-358.
12. Goswami R, Gupta N, Goswami D, Marwaha RK, Tandon N, Kochupillai N, et al. Prevalence and significance of low 25-hydroxyvitamin D concentration in healthy subjects in Delhi. Am J Clin Nutr. 2000;72:472-475.
13. Harinarayan CV, Ramalakshmi T, Prasad UV, Sudhakar D, Srinivasarao PVLN, Sarma KVS, et al. High prevalence of low dietary calcium, high phytate consumption, and vitamin D deficiency in healthy south Indians. Am J Clin Nutr. 2007;85:1062-1067.
14. Harinarayan CV. Prevalence of vitamin D insufficiency in postmenopausal south Indian women. Osteoporos Int. 2005;16:397-402.
15. Sheth JJ, Shah A, Sheth FJ, Trivedi S, Lele M, Shah N, et al. Does vitamin D play a significant role in type 2 diabetes? BMC Endocr Disord. 2015;15:5.
16. Farahmand MA, Daneshzad E, Fung TT, Zahidi F, Muhammadi M, Bellissimo N, et al. What is the impact of vitamin D supplementation on glycemic control in people with type-2 diabetes: a systematic review and meta-analysis of randomized controlled trails. BMC Endocr Disord. 2023 Jan 16;23(1):15.
17. Chen W, Liu L, Hu F. Efficacy of vitamin D supplementation on glycaemic control in type 2 diabetes: An updated systematic review and meta-analysis of randomized controlled trials. Diabetes Obes Metab. 2024 Dec;26(12):5713-5726.
18. Theik NWY, Raji OE, Shenwai P. The prevention and improvement effects of vitamin D on type 2 diabetes mellitus: evidence from an umbrella review on meta-analyses of cohort studies and randomized controlled trials. Front Nutr. 2024;11:1462535.
19. Miao J, Bachmann KN, Huang S. Effect of vitamin D supplementation on type 2 diabetes biomarkers: an umbrella of interventional meta-analyses. Diabetol Metab Syndr. 2023;15:62.