Effect of Slow-Paced Breathing on Respiratory Sinus Arrhythmia and Cardiovascular Autonomic Function in Healthy Adults: A Prospective Interventional Study.
- Dr. Suva Nath , Assistant Professor, Department of Physiology, SKS Medical College and Bengal Hospital, India.
Article Information:
Abstract:
Background: Slow-paced breathing may enhance cardiorespiratory coupling and autonomic regulation. This study evaluated its acute effects on respiratory sinus arrhythmia (RSA) and cardiovascular autonomic function in healthy adults. Methods: One hundred healthy adults underwent baseline recording, 10 minutes of paced breathing at approximately 6 breaths/min, and immediate recovery assessment. RSA, heart-rate variability (HRV), blood pressure, heart rate, and baroreflex sensitivity were measured. Results: RSA increased from 47.0 [38.4–55.2] ms at baseline to 76.2 [67.9–84.1] ms during paced breathing (p<0.001). RMSSD, SDNN, total HRV power, and baroreflex sensitivity also increased significantly. Heart rate decreased by 3.4 bpm, systolic blood pressure by 2.0 mmHg, and mean arterial pressure by 0.8 mmHg, while diastolic pressure was unchanged. Autonomic indices partially returned toward baseline during recovery. Conclusion: Slow-paced breathing produced marked acute enhancement of RSA and HRV with modest cardiovascular effects.
Keywords:
Article :
INTRODUCTION :
Respiratory sinus arrhythmia (RSA) is the periodic fluctuation of HR during breathing, and is closely related to the parasympathetic modulation of the sinoatrial node. While a large number of indices of cardiovascular autonomic regulation are based on RSA, their magnitude is highly dependent on the respiratory frequency and pattern [1]. It is therefore important to take respiratory influences into account during acquisition and interpretation of HRV data [2] to obtain useful physiological information.
Cardiovascular oscillations can be significantly affected by voluntary slowing of breathing. Vaschillo et al. showed that near an individual resonance frequency, cardiorespiratory oscillations are amplified by the interaction between heart-rate variability and blood-pressure variability and the arterial baroreflex [3]. Slowing breathing rates also generally increased HRV amplitude, as demonstrated by Song and Lehrer [4] who found a larger increase at breathing rates between 4–6 breaths/minute. These observations support the use of approximately 6 breaths per minute as a standardised slow breathing intervention, which has a physiological basis.
Slow breathing can have effects on other aspects of heart-rate variability. In healthy subjects, Bernardi et al. reported improvement in cardiovascular synchronization and increase in baroreflex sensitivity with rhythmic breathing at 6 cycles per minute [5]. Lehrer et al. later showed that HRV biofeedback focused on slow respiratory breathing led to an increase in baroreflex gain, which further supported the hypothesis that repeated amplification of cardiorespiratory oscillations could alter reflex cardiovascular control [6].
Slow breathing also has acute autonomic effects, as evidenced by a synthesis of data from experimental studies. A systematic review of slow breathing techniques by Zaccaro et al. found that HRV and RSA increased consistently along with wider autonomic and psychophysiological modifications [7]. More recently, Laborde et al. analysed 223 eligible studies and reported that vagally mediated HRV increased during breathing, after a single session and following repeated slow breathing sessions [8].
However, caution must be used when interpreting the frequency domain HRV during slow breathing. Respiratory oscillation at 6 breaths/minute is around 0.10 Hz, which is considered a low frequency. Therefore, LF power during paced breathing is not necessarily a measure of increased sympathetic activity, and LF/HF ratio is not a simple measure of sympathovagal balance during paced breathing [2–4].
The present prospective interventional study, therefore, examined the acute effects of slow-paced breathing (6 breaths per minute) on RSA and cardiovascular autonomic function in healthy adults. Time- and frequency-domain HRV, HR, BP, and BRS were analyzed during the paced breathing period and the immediate recovery period, as well as baseline variables that could be related to the magnitude of the RSA response.
PATIENTS AND METHODS:
Study design and participants
The aim of this prospective, single group, interventional repeated measures study was to assess the acute effects of slow paced breathing on respiratory sinus arrhythmia (RSA) and cardiovascular autonomic function (CAF) in healthy adults. The study period was 6 months in 2026 in West Bengal, India. Adults (18–45 years) who were clinically healthy, had resting sinus rhythm and were capable of understanding and following paced-breathing instructions were eligible for inclusion.
Participants were excluded if they had a known cardiovascular disease, treated hypertension, diabetes mellitus, autonomic neuropathy, clinically significant asthma or chronic obstructive pulmonary disease, uncontrolled thyroid disease, chronic renal or hepatic disease, neurological disorders affecting autonomic function, acute febrile illness, clinically significant arrhythmia, an implanted cardiac rhythm device, pregnancy, regular nicotine dependence, or current use of medications known to significantly affect autonomic tone. Participants who failed to follow the breathing protocol or whose ECG and/or respiratory recordings were technically poor were also not included in the final analysis. A total of 108 people were assessed, with 100 people having complete analyzable recordings.
Pre-test standardization and breathing protocol
Participants were tested after 10–15 minutes of rest, mostly in the supine position, in a quiet room with stable ambient conditions. The participants were asked to refrain from strenuous exercise, alcohol and excess caffeine before testing.
This protocol included three consecutive recording periods: 5 minutes of spontaneous breathing (T0), 10 minutes of guided slow-paced breathing (T1), and 5 minutes of spontaneous breathing (T2) during the immediate recovery period. Breathing was paced during the intervention to ~6 breaths/minute with an audiovisual pacer, which resulted in a respiratory cycle of 10 seconds with ~5 seconds of inspiration and 5 seconds of expiration. The respiratory rate was measured during the whole intervention to evaluate adherence to the target rate.
Physiological measurements
During each study period, continuous ECG and respiratory recordings were made. Mean RR interval and mean heart rate were computed for T0, T1, and T2; heart rate was computed with respect to the mean RR interval. RSA was defined as the peak-to-trough inspiratory-expiratory difference in RR interval and was expressed in milliseconds.
Heart-rate variability (HRV) parameters measured in the time domain were the standard deviation of normal-to-normal RR intervals (SDNN), the root mean square of successive RR-interval differences (RMSSD), the percentage of successive RR intervals that vary by more than 50 ms (pNN50), and total HRV power. The frequency domain measures were low frequency (LF) power, high frequency (HF) power, and the LF/HF ratio.
Systolic blood pressure (SBP), diastolic blood pressure (DBP), and mean arterial pressure (MAP) were measured at each time point. MAP was calculated as:
MAP = DBP + (SBP − DBP)/3.
Baroreflex sensitivity was also measured as an exploratory autonomic measure.
Outcomes
Within subject change in RSA from baseline to slow paced breathing was calculated as:
Delta RSA = RSA at T1 − RSA at T0.
Secondary outcomes were changes in RMSSD, SDNN, total HRV power, heart rate, SBP, DBP, MAP, and baroreflex sensitivity. The recovery responses were assessed by comparing T2 to both T0 and T1.
Respiratory-related oscillations fall within the LF frequency band, since breathing at 6 breaths/minute equates to a respiratory frequency of ~0.10 Hz. Therefore, LF power increases during paced breathing were not assumed to reflect increased sympathetic activity and the LF/HF ratio during T1 was not viewed as a direct index of sympathovagal balance.
Statistical analysis
Continuous variables were summarized as mean ± standard deviation or median [interquartile range], according to their distribution, while categorical variables were presented as n (%). Distributional assumptions for paired differences were assessed before hypothesis testing.
The primary T0-to-T1 RSA comparison was performed using the Wilcoxon signed-rank test because the paired RSA differences were not normally distributed. Effect size was expressed as rank-biserial correlation, with a bootstrap 95% confidence interval reported for the median change. Secondary paired comparisons were evaluated using paired t tests or Wilcoxon signed-rank tests, as appropriate, with Holm adjustment for multiple testing.
Changes across T0, T1, and T2 were evaluated using the Friedman test, followed by Holm-adjusted post-hoc pairwise comparisons. Associations between change in RSA and age, body mass index, baseline RSA, baseline RMSSD, habitual physical activity, and baseline heart rate were examined using Spearman rank correlation.
A multivariable linear regression model was used to explore independent predictors of change in RSA. Candidate predictors included age, sex, body mass index, baseline RSA, baseline heart rate, physical activity level, and sleep duration. Regression coefficients were estimated with robust standard errors, and multicollinearity was assessed using variance inflation factors. All tests were two-sided, with p<0.05 considered statistically significant.
RESULTS:
Participant characteristics
Of 108 individuals assessed, 8 were excluded before analysis because of inadequate ECG quality (n=3), inability to maintain paced breathing (n=3), or incomplete recording (n=2), leaving 100 participants for the final analysis. The mean age was 29.8 ± 6.7 years, and 52 (52.0%) participants were female. Baseline demographic and physiological characteristics are summarized in Table 1.
Table 1. Baseline characteristics of the study participants
|
Characteristic |
Overall (N=100) |
|
Age, years |
29.8 ± 6.7 |
|
Sex |
|
|
Female |
52 (52.0%) |
|
Male |
48 (48.0%) |
|
BMI, kg/m² |
23.4 ± 2.5 |
|
Habitual physical activity |
|
|
Low |
29 (29.0%) |
|
Moderate |
51 (51.0%) |
|
High |
20 (20.0%) |
|
Sleep duration previous night, h |
7.2 ± 0.7 |
|
Baseline respiratory rate, breaths/min |
14.4 ± 1.7 |
|
Baseline heart rate, bpm |
70.1 ± 5.4 |
|
Baseline SBP, mmHg |
116.6 ± 7.3 |
|
Baseline DBP, mmHg |
72.4 ± 5.2 |
|
Baseline RSA, ms |
46.8 ± 10.3 |
|
Baseline RMSSD, ms |
46.7 ± 8.4 |
|
Baseline SDNN, ms |
46.2 ± 7.7 |
Values are mean ± SD or n (%), as appropriate. Indented entries are categories within the preceding characteristic. BMI, body mass index; RSA, respiratory sinus arrhythmia; RMSSD, root mean square of successive RR-interval differences; SDNN, standard deviation of normal-to-normal RR intervals.
Adherence to paced breathing and physiological response
Participants maintained the paced-breathing target closely, with a measured T1 respiratory rate of 6.01 ± 0.12 breaths/minute and breath-rate adherence of 97.6 ± 1.9%. Across T0, T1, and T2, respiratory rate, heart rate, RSA, time-domain HRV indices, total power, LF power, SBP, MAP, and baroreflex sensitivity showed significant time effects, whereas DBP did not (Table 2).
Table 2. Physiological variables at baseline, during slow-paced breathing, and during immediate recovery
|
Variable |
T0 baseline |
T1 paced breathing |
T2 recovery |
Global statistic |
p-value |
|
Respiratory rate, breaths/min |
14.4 ± 1.7 |
6.0 ± 0.1 |
14.0 ± 1.8 |
Q=155.85 |
<0.001 |
|
Heart rate, bpm |
70.1 ± 5.4 |
66.7 ± 5.9 |
68.9 ± 5.6 |
Q=92.34 |
<0.001 |
|
Mean RR interval, ms |
860.8 ± 68.3 |
907.0 ± 83.0 |
877.1 ± 72.6 |
Q=92.34 |
<0.001 |
|
RSA, ms |
46.8 ± 10.3 |
75.0 ± 15.1 |
55.3 ± 11.8 |
Q=158.66 |
<0.001 |
|
RMSSD, ms |
46.7 ± 8.4 |
61.7 ± 11.0 |
51.7 ± 9.0 |
Q=160.22 |
<0.001 |
|
SDNN, ms |
46.2 ± 7.7 |
67.2 ± 9.5 |
53.1 ± 8.9 |
Q=178.56 |
<0.001 |
|
pNN50, % |
16.2 ± 5.4 |
24.1 ± 7.3 |
18.9 ± 6.2 |
Q=149.58 |
<0.001 |
|
Total power, ms² |
1999 [1738–2422] |
4328 [3552–5031] |
2722 [2291–3257] |
Q=200.00 |
<0.001 |
|
LF power, ms² |
668 [513–881] |
2553 [1875–3178] |
1244 [914–1581] |
Q=200.00 |
<0.001 |
|
HF power, ms² |
778 [624–1023] |
752 [514–993] |
795 [584–995] |
Q=19.50 |
<0.001 |
|
LF/HF ratio |
0.91 [0.59–1.14] |
3.52 [2.48–4.47] |
1.52 [1.07–2.17] |
Q=196.02 |
<0.001 |
|
SBP, mmHg |
116.6 ± 7.3 |
114.6 ± 9.2 |
115.6 ± 8.0 |
Q=15.26 |
<0.001 |
|
DBP, mmHg |
72.4 ± 5.2 |
72.2 ± 6.0 |
72.3 ± 5.4 |
Q=0.57 |
0.751 |
|
MAP, mmHg |
87.2 ± 4.4 |
86.4 ± 5.0 |
86.7 ± 4.7 |
Q=10.02 |
0.007 |
|
Baroreflex sensitivity, ms/mmHg |
12.1 ± 3.2 |
16.7 ± 3.9 |
13.7 ± 3.4 |
Q=145.46 |
<0.001 |
Values are mean ± SD, except total power, LF power, HF power, and LF/HF ratio, which are median [IQR]. Global comparisons used the Friedman test; Q denotes the Friedman test statistic. Holm-adjusted pairwise comparisons were used for post-hoc testing. T0, baseline spontaneous breathing; T1, slow-paced breathing; T2, immediate recovery. At approximately 0.10-Hz breathing, respiratory oscillations fall within the conventional LF band; therefore, LF power and LF/HF at T1 should not be interpreted as direct indices of sympathetic activity or sympathovagal balance.
Respiratory sinus arrhythmia
RSA showed the largest within-subject autonomic response. Median RSA increased from 47.0 [38.4–55.2] ms at T0 to 76.2 [67.9–84.1] ms at T1, with a median increase of 29.9 ms (bootstrap 95% CI 27.8–33.0; W=10.0, p<0.001; rank-biserial r=0.996). The individual paired responses are shown in Figure 1. During recovery, RSA moved toward baseline while remaining above the pre-intervention level (Table 2).
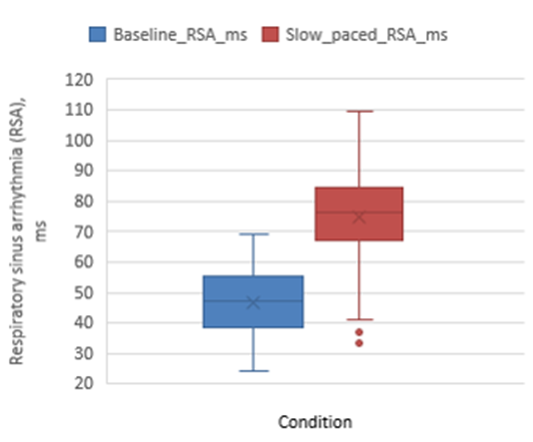
Figure 1. Paired respiratory sinus arrhythmia values at baseline and during slow-paced breathing.
Time-domain HRV, heart rate, and blood pressure
RMSSD and SDNN increased during paced breathing, as did total HRV power; all remained significant after Holm correction. Mean heart rate decreased by 3.4 bpm. SBP showed a modest reduction of 2.0 mmHg and MAP decreased by 0.8 mmHg, whereas DBP showed no meaningful change. Baroreflex sensitivity increased during paced breathing and partially returned toward baseline during recovery (Tables 2 and 3).
Table 3. Primary and secondary paired intervention effects from T0 to T1
|
Variable |
T0 |
T1 |
Change (95% CI) |
Test statistic |
p-value |
Effect size |
|
RSA, ms |
47.0 [38.4–55.2] |
76.2 [67.9–84.1] |
29.9 (27.8 to 33.0) |
W=10.0 |
<0.001 |
Rank-biserial r=0.996 |
|
RMSSD, ms |
46.7 ± 8.4 |
61.7 ± 11.0 |
15.0 (13.6 to 16.4) |
t=20.93 |
<0.001 |
Cohen dz=2.09 |
|
SDNN, ms |
46.2 ± 7.7 |
67.2 ± 9.5 |
21.0 (19.6 to 22.4) |
t=29.71 |
<0.001 |
Cohen dz=2.97 |
|
Total power, ms² |
1999 [1738–2422] |
4328 [3552–5031] |
2200 (2062 to 2582) |
W=0.0 |
<0.001 |
Rank-biserial r=1.00 |
|
Heart rate, bpm |
70.1 ± 5.4 |
66.7 ± 5.9 |
-3.4 (-4.0 to -2.9) |
t=-12.86 |
<0.001 |
Cohen dz=-1.29 |
|
SBP, mmHg |
116.6 ± 7.3 |
114.6 ± 9.2 |
-2.0 (-2.8 to -1.2) |
t=-4.73 |
<0.001 |
Cohen dz=-0.47 |
|
DBP, mmHg |
73.2 [68.5–75.6] |
72.3 [68.0–76.7] |
0.2 (-0.3 to 0.8) |
W=2407.5 |
0.949 |
Rank-biserial r=-0.01 |
|
MAP, mmHg |
87.2 ± 4.4 |
86.4 ± 5.0 |
-0.8 (-1.3 to -0.3) |
t=-3.00 |
0.007 |
Cohen dz=-0.30 |
The primary RSA comparison used the Wilcoxon signed-rank test because the paired difference was non-normal. Secondary p-values are Holm-adjusted across the prespecified secondary T0-to-T1 comparisons. Paired t tests were used for approximately normal paired differences; Wilcoxon signed-rank tests were used otherwise. CI, confidence interval; dz, paired-samples Cohen effect size.
Frequency-domain heart-rate variability
LF power increased markedly during slow-paced breathing, while HF power changed less consistently and the LF/HF ratio increased. Because 6 breaths/minute corresponds to approximately 0.10 Hz, the respiratory oscillation is located within the conventional LF band. Accordingly, the increase in LF power during paced breathing should not be interpreted as increased sympathetic activity, and the LF/HF ratio at T1 should not be interpreted as a direct index of sympathovagal balance.
Factors associated with the RSA response
Baseline RSA showed a weak inverse association with the magnitude of the RSA increase, whereas age, BMI, baseline RMSSD, habitual physical activity, and baseline heart rate were not clearly associated with the response (Table 4). The relationship between baseline RSA and within-subject RSA change is illustrated in Figure 2.
Table 4. Associations between baseline factors and change in RSA during paced breathing
|
Factor |
Spearman rho with Delta RSA T1-T0 |
p-value |
|
Age |
0.016 |
0.876 |
|
BMI |
0.062 |
0.538 |
|
Baseline RSA |
-0.202 |
0.044 |
|
Baseline RMSSD |
-0.126 |
0.211 |
|
Physical activity level |
0.064 |
0.529 |
|
Baseline heart rate |
0.120 |
0.236 |
Correlations are Spearman rank correlations. Physical activity was treated ordinally as low, moderate, and high. RSA, respiratory sinus arrhythmia.
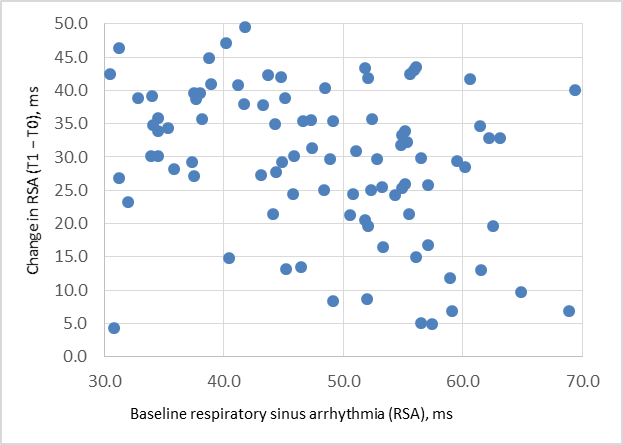
Figure 2. Association between baseline RSA and the change in RSA during slow-paced breathing.
Multivariable analysis
In the multivariable model, no prespecified demographic or baseline physiological factor showed a statistically robust independent association with the RSA response. Baseline RSA retained an inverse association of borderline precision, while habitual physical activity showed a positive but imprecise association. The model explained little of the between-participant variability (adjusted R²=0.004) (Table 5).
Table 5. Multivariable linear regression for change in RSA from T0 to T1
|
Predictor |
B |
Standardized β |
95% CI |
Test statistic |
p-value |
VIF |
|
Age, years |
0.005 |
0.003 |
-0.476 to 0.487 |
z=0.02 |
0.983 |
1.11 |
|
Female sex |
2.237 |
0.089 |
-3.096 to 7.570 |
z=0.82 |
0.411 |
1.02 |
|
BMI, kg/m² |
-0.281 |
-0.055 |
-1.460 to 0.898 |
z=-0.47 |
0.641 |
1.15 |
|
Baseline RSA, ms |
-0.244 |
-0.199 |
-0.515 to 0.028 |
z=-1.76 |
0.078 |
1.26 |
|
Baseline heart rate, bpm |
0.397 |
0.170 |
-0.249 to 1.043 |
z=1.20 |
0.228 |
1.31 |
|
Physical activity level (ordinal) |
3.613 |
0.199 |
-0.746 to 7.972 |
z=1.62 |
0.104 |
1.38 |
|
Sleep duration, h |
-0.827 |
-0.048 |
-4.385 to 2.731 |
z=-0.46 |
0.649 |
1.01 |
Outcome: change in RSA from T0 to T1. Regression coefficients use HC3 robust standard errors. Model R²=0.074; adjusted R²=0.004; maximum VIF=1.38. Physical activity was entered as an ordinal variable. VIF, variance inflation factor.
DISCUSSION:
In this cohort, a significant acute effect was observed on the cardiorespiratory autonomic indices with slow breathing (6 breaths/min). In addition to increases in RMSSD, SDNN, total HRV power, and baroreflex sensitivity, and modest decreases in heart rate, systolic blood pressure, and mean arterial pressure, RSA increased from a median of 47.0 to 76.2 ms. Most effects reduced during recovery, but were still somewhat elevated. Diastolic blood pressure, however, had little change. The absence of strong demographic predictors of RSA response indicates that the immediate autonomic effect was not limited to a particular sub-group of this relatively young and healthy sample.
The marked rise in RSA is similar to resonance-frequency studies in healthy adults. Steffen et al. randomly assigned 95 subjects to breathing at individual resonance frequency, one breath/min above resonance or quiet sitting. Resonance-frequency breathing increased HRV-related oscillatory activity compared to control after 15 minutes, and decreased systolic blood pressure during the cognitive stressor and recovery [9]. Our results corroborate this trend by showing that there was a significant within-subject RSA increase during a fixed 6-breaths/min protocol and partial retention during immediate recovery.
This rise in baroreflex sensitivity needs to be interpreted with caution. Tzeng et al. studied 30 healthy adults at 0.10 and 0.25 Hz and found that slow breathing increased the spontaneous α-index by 8.1±14 ms/mmHg and up-sequence BRS by 10±11 ms/mmHg. However, BRS measured with the modified Oxford method did not increase [10]. The distinction is important because our increase from 12.1 to 16.7 ms/mmHg was clearly associated with increased spontaneous pressure–RR coupling, but not necessarily with a similar increase in intrinsic baroreflex gain.
Horsman et al. gave more support to this methodological distinction. Breathing frequency was then independently varied at 6 and 10 breaths/min in 14 healthy subjects while blood-pressure oscillations were externally imposed at 0.06 or 0.10 Hz. The breathing rate itself was not found to have a significant main effect on estimated BRS (p=0.28), while the frequency of the imposed blood-pressure oscillation was found to be significant (p=0.01) and there was no interaction between the two factors (p=0.59) [11]. Therefore, the increased spontaneous BRS observed in our study could be due to the increased 0.1-Hz coupling induced by respiration, but not necessarily to an acute change in the baroreflex apparatus.
Respiratory timing may be less important than respiratory frequency for many of these responses. Wang et al. investigated 14 healthy young adults at 0.10 and 0.25 Hz breathing with various I/E ratios in both sitting and supine positions. Inspiratory/expiratory ratio (I/E ratio) did not significantly affect spectral HRV and spontaneous BRS measures, while HRV at the respiratory frequency and positive-sequence BRS were higher at 0.10 Hz than 0.25 Hz breathing [12]. This confirms the use of a simple 5-s inspiration/5-s expiration protocol in our study and points to the fact that the central autonomic response was mainly due to the slow respiratory frequency.
The frequency domain results also have to be physiologically interpreted. The power of LF increased from a median of 668 to 2553 ms² and the LF/HF ratio increased significantly during paced breathing, whereas the power of HF remained relatively unchanged. Kromenacker et al. directly investigated this phenomenon in six healthy adults breathing 4–9 breaths/min during autonomic blockade. During parasympathetic blockade, the power at the breathing frequency decreased from 69.5±8.1 under placebo to 4.1±2.1 (p=0.001) while during sympathetic blockade the power remained essentially unchanged (70.2±9.1; p=0.671) [13]. Their findings strongly suggest the large LF oscillation that occurs during slow breathing is primarily vagally mediated. The LF/HF ratio in our study, therefore, cannot be interpreted as a predominance of sympathetic activity.
The small cardiovascular responses seen in conjunction with the HRV response are also consistent with previous physiological studies. Joseph et al. compared 20 patients with essential hypertension and 26 controls during spontaneous breathing and controlled breathing at 6 and 15 breaths/min. At 6 breaths/min, BRS rose from 10.9±1.0 to 16.0±1.5 ms/mmHg in controls and from 5.8±0.7 to 10.3±2.0 ms/mmHg in the hypertensive patients. Among hypertensive patients, systolic pressure fell from 149.7±3.7 to 141.1±4.0 mmHg and diastolic pressure from 82.7±3.0 to 77.8±3.7 mmHg [14]. In our normotensive participants, only a small decrease in systolic pressure was observed (2.0 mmHg), and no change in diastolic pressure was observed, which is reasonable because they had lower baseline pressure and were not hypertensive.
Slow breathing doesn't always have the same cardiovascular effects. Gholamrezaei et al. studied four breathing strategies at 0.1 Hz, including pursed-lips, unilateral nostril, and inspiratory-loaded breathing. The inspiratory-loaded breathing produced the highest blood-pressure variability and the highest values of RSA, and the breathing with pursed lips also increased the RSA compared to some other breathing techniques. Importantly, the baroreflex sensitivity was not significantly different between breathing conditions and the effect of breathing pattern on RSA was partially mediated by blood-pressure variability [15]. The results suggest that the amplitude of RSA can be altered by changes in respiratory mechanics, tidal volume and/or pressure oscillations even at constant respiratory frequency.
Our study found that the magnitude of the changes in the RSA and time-domain HRV was quite large: about 30 ms in RSA, 15 ms in RMSSD, and 21 ms in SDNN. The almost universal direction of change in RSA is consistent with a strong respiratory entrainment, and the very large paired effect is best interpreted in the context of the very tightly standardized protocol and the limited sample of participants who were able to hold the target rate. Prior to analysis, 8 subjects were excluded, three of whom were unable to maintain paced breathing, three who had poor quality ECGs, and two who had incomplete recordings, which may have resulted in a cohort that was more likely to show the physiological response.
The weak inverse relationship between baseline RSA and subsequent increase in RSA could be due to a ceiling effect or regression to the mean. Baseline RSA was no longer statistically significant in the multivariable model; however, age, sex, BMI, habitual activity, heart rate and sleep duration accounted for little between-participant variability. This indicates that short-term responsiveness at 0.1 Hz could be more sensitive to individual resonance frequency, tidal volume, respiratory mechanics and cardiorespiratory phase coupling than to simple demographic factors. Assessment of these mechanisms was limited in the present study because the resonance frequency was not individualized and tidal volume was not measured.
Strengths include the prospective within-subject design, high adherence to the target breathing frequency, synchronized assessment of RSA and conventional HRV variables, inclusion of blood pressure and baroreflex indices, and a recovery phase that demonstrated partial reversibility after paced breathing ceased. The explicit recognition that 0.10-Hz respiratory oscillations migrate into the conventional LF band also avoids a common error in HRV interpretation. Limitations include the absence of a spontaneous-breathing or alternative-rate control group, restriction to young healthy adults, a single short intervention, and lack of tidal-volume or end-tidal CO₂ measurements. The spontaneous baroreflex measure cannot establish that intrinsic baroreflex gain increased, and the findings cannot be extrapolated directly to patients with cardiovascular or autonomic disease.
CONCLUSION:
Slow-paced breathing at approximately 6 breaths/min significantly increased respiratory sinus arrhythmia and heart-rate variability, enhanced spontaneous baroreflex sensitivity, and modestly reduced heart rate and systolic blood pressure in healthy adults. These findings support slow-paced breathing as a simple acute intervention for modulating cardiovascular autonomic function.
REFERENCES:
1. Grossman P, Taylor EW. Toward understanding respiratory sinus arrhythmia: relations to cardiac vagal tone, evolution and biobehavioral functions. Biol Psychol. 2007;74(2):263-285. doi: 10.1016/j.biopsycho.2005.11.014.
2. Shaffer F, Ginsberg JP. An overview of heart rate variability metrics and norms. Front Public Health.2017;5:258. doi: 10.3389/fpubh.2017.00258.
3. Vaschillo E, Lehrer P, Rishe N, Konstantinov M. Heart rate variability biofeedback as a method for assessing baroreflex function: a preliminary study of resonance in the cardiovascular system. Appl Psychophysiol Biofeedback. 2002;27(1):1-27. doi: 10.1023/A:1014587304314.
4. Song HS, Lehrer PM. The effects of specific respiratory rates on heart rate and heart rate variability. Appl Psychophysiol Biofeedback. 2003;28(1):13-23. doi: 10.1023/A:1022312815649.
5. Bernardi L, Sleight P, Bandinelli G, Cencetti S, Fattorini L, Wdowczyc-Szulc J, Lagi A. Effect of rosary prayer and yoga mantras on autonomic cardiovascular rhythms: comparative study. BMJ. 2001;323(7327):1446-1449. doi: 10.1136/bmj.323.7327.1446.
6. Lehrer PM, Vaschillo E, Vaschillo B, Lu SE, Eckberg DL, Edelberg R, et al. Heart rate variability biofeedback increases baroreflex gain and peak expiratory flow. Psychosom Med. 2003;65(5):796-805. doi: 10.1097/01.PSY.0000089200.81962.19.
7. Zaccaro A, Piarulli A, Laurino M, Garbella E, Menicucci D, Neri B, Gemignani A. How breath-control can change your life: a systematic review on psycho-physiological correlates of slow breathing. Front Hum Neurosci.2018;12:353. doi: 10.3389/fnhum.2018.00353.
8. Laborde S, Allen MS, Borges U, Dosseville F, Hosang TJ, Iskra M, et al. Effects of voluntary slow breathing on heart rate and heart rate variability: a systematic review and a meta-analysis. NeurosciBiobehav Rev.2022;138:104711. doi: 10.1016/j.neubiorev.2022.104711.
9. Steffen PR, Austin T, DeBarros A, Brown T. The impact of resonance frequency breathing on measures of heart rate variability, blood pressure, and mood. Front Public Health.2017;5:222. doi: 10.3389/fpubh.2017.00222.
10. Tzeng YC, Sin PYW, Lucas SJE, Ainslie PN. Respiratory modulation of cardiovagal baroreflex sensitivity. J Appl Physiol. 2009;107(3):718-724. doi: 10.1152/japplphysiol.00548.2009.
11. Horsman HM, Peebles KC, Tzeng YC. Interactions between breathing rate and low-frequency fluctuations in blood pressure and cardiac intervals. J Appl Physiol. 2015;119(7):793-798. doi: 10.1152/japplphysiol.00525.2015.
12. Wang YP, Kuo TBJ, Lai CT, Chu JW, Yang CCH. Effects of respiratory time ratio on heart rate variability and spontaneous baroreflex sensitivity. J Appl Physiol. 2013;115(11):1648-1655. doi: 10.1152/japplphysiol.00163.2013.
13. Kromenacker BW, Sanova AA, Marcus FI, Allen JJB, Lane RD. Vagal mediation of low-frequency heart rate variability during slow yogic breathing. Psychosom Med. 2018;80(6):581-587. doi: 10.1097/PSY.0000000000000603.
14. Joseph CN, Porta C, Casucci G, Casiraghi N, Maffeis M, Rossi M, Bernardi L. Slow breathing improves arterial baroreflex sensitivity and decreases blood pressure in essential hypertension. Hypertension. 2005;46(4):714-718. doi: 10.1161/01.HYP.0000179581.68566.7d.
15. Gholamrezaei A, Van Diest I, Aziz Q, Vlaeyen JWS, Van Oudenhove L. Psychophysiological responses to various slow, deep breathing techniques. Psychophysiology. 2021;58(2):e13712. doi: 10.1111/psyp.13712.