An inverted U-shaped relationship between haemoglobin and HbA1c in non-diabetic individuals with and without microcytic hypochromic anaemia: implications for HbA1c-based diabetes screening in South India.
- Dr. Sanket Patil G , Assistant Professor, Department of General Medicine, Raichur institute of medical sciences (Rims), Raichur, Karnataka, India
- Dr. Sharanabasavaraj Devareddy , Senior Resident, Department of General Medicine, Sri Siddhartha Institute of Medical Sciences & Research Centre, Bangalore, Karnataka, India.
Article Information:
Abstract:
Introduction: HbA1c-based screening assumes that HbA1c reflects glycaemia alone. In India, where iron deficiency anaemia and diabetes are both common, a haemoglobin-dependent bias could misclassify people near diagnostic thresholds. We examined how HbA1c varies across the haemoglobin range in non-diabetic individuals with and without microcytic hypochromic anaemia. Methods: Case–control study of 50 non-diabetic patients with microcytic hypochromic anaemia and 50 non-anaemic controls at a teaching hospital in Raichur. HbA1c was measured by turbidimetric inhibition immunoassay alongside a complete blood count and fasting and postprandial glucose. HbA1c was modelled against haemoglobin with linear and quadratic regression, and compared across WHO severity strata. Results: Fasting and postprandial glucose did not differ between groups. A linear model showed no association between haemoglobin and HbA1c (R²=0.012; p=0.291), whereas a quadratic model fitted substantially better (R²=0.230; likelihood-ratio p<0.001). HbA1c peaked at a haemoglobin of 10.41 g/dL (bootstrap 95% CI 10.00 to 10.75) and was lower at both extremes. HbA1c rose by 0.177% per g/dL among anaemic participants but fell by 0.174% per g/dL among controls (interaction p<0.001). Mean HbA1c was 5.11%, 5.33% and 5.55% across ascending haemoglobin tertiles of the anaemic group, and 5.14% in controls. Overall, anaemic participants had higher HbA1c than controls (adjusted difference 0.314%, 95% CI 0.115 to 0.513), an effect driven by moderate anaemia (0.34%, 95% CI 0.16 to 0.52) and absent in severe anaemia (−0.02%, 95% CI −0.21 to 0.17). Conclusion: HbA1c follows an inverted U across the haemoglobin range, so iron deficiency can bias it upward or not at all depending on severity. A single correction factor is inappropriate; glucose-based testing should be preferred in anaemic individuals with borderline HbA1c.
Keywords:
Article :
INTRODUCTION:
Screening for diabetes in India increasingly relies on a single blood test. HbA1c can be drawn at any time of day, needs no glucose load and summarises glycaemia over the preceding two to three months, which makes it attractive for opportunistic and programme-based screening in busy outpatient settings1,2. The scale of the task is large: the most recent national survey estimated that 11.4% of Indian adults have diabetes and a further 15.3% have prediabetes3. Any systematic error in the screening test is multiplied across this population.
There is already evidence that HbA1c behaves differently in Asian Indians. In the Chennai Urban Rural Epidemiology Study, applying the HbA1c criterion of 6.5% yielded a diabetes prevalence of 12.8%, roughly double the 6.1% obtained with fasting glucose, and identified a partly different group of people4. The same cohort found that HbA1c values in people with normal glucose tolerance overlapped extensively with those in glucose intolerance, and that an HbA1c of 5.6% identified impaired glucose regulation with less than 70% accuracy5. Glucose-independent determinants of HbA1c are therefore of direct practical importance in this population.
Chief among these determinants is the biology of the red cell. HbA1c is not a direct measurement of glucose but of how much haemoglobin has been glycated, and the amount of glycation depends on how long each erythrocyte has circulated6. Variation in erythrocyte lifespan among haematologically normal adults is large enough to change HbA1c by clinically relevant amounts at the same mean glucose7, and the discordance between HbA1c and other glycaemic markers, termed the glycation gap, is reproducible within individuals8. Assay standardisation has narrowed between-laboratory differences, but it cannot remove biological sources of variation of this kind9.
Iron deficiency is the condition most likely to introduce such variation in India. Anaemia affects nearly a quarter of the world's population, with dietary iron deficiency the leading cause10, and its prevalence among Indian women has risen in recent national surveys11 despite the Anaemia Mukt Bharat programme launched in 201812. Studies of iron deficiency and HbA1c have produced conflicting results. Several have reported higher HbA1c in iron deficiency anaemia, falling after iron replacement13,14,15,16. Others have found no difference17 or a lower HbA1c that rose with treatment18. In population data from the United States, HbA1c increased steadily with haemoglobin19, while iron deficiency in women was associated with an upward shift of the HbA1c distribution20. In young adults from Pune, low haemoglobin predicted a higher HbA1c and inflated the prevalence of HbA1c-defined prediabetes21.
Pooled analyses mirror this inconsistency. One meta-analysis found no significant difference in HbA1c in iron deficiency22; a larger, recent one estimated an increase of 0.66%23; and a review restricted to non-diabetic adults found no conclusive overall effect and inconsistent associations with anaemia severity24. A systematic review of anaemia and erythrocyte indices concluded that the degree of anaemia at which HbA1c becomes unreliable is unknown25. Most primary studies have compared anaemic and non-anaemic groups as two categories. That approach implicitly assumes that the effect of anaemia is monotonic. If, instead, the relationship between haemoglobin and HbA1c changes direction at some point, group comparisons would yield different answers depending on the severity of anaemia in each sample, which is exactly the pattern seen in the literature.
There is also a methodological reason to look beyond group comparisons. Dichotomising a continuous exposure such as haemoglobin discards information and can conceal a relationship that changes direction within the exposure range: if HbA1c is raised at intermediate haemoglobin and not at the extremes, a comparison of ‘anaemic’ with ‘non-anaemic’ individuals will average the effect away or produce a small difference whose size depends on the case mix. Modelling haemoglobin as a continuous variable, and allowing for curvature, avoids that problem and asks a question that is more useful clinically: at what haemoglobin levels does HbA1c become unreliable, and in which direction?
The question is particularly pressing for adolescents and young women. They carry the highest burden of iron deficiency in India10,11, and they are increasingly screened for dysglycaemia because type 2 diabetes is appearing at younger ages. In young adults from Pune, HbA1c classified 23.3% as prediabetic against 7.8% by the oral glucose tolerance test, and lower haemoglobin and ferritin were independent predictors of HbA1c21. A false label of prediabetes in a young woman has consequences for counselling, follow-up burden and anxiety, whereas a false reassurance in a severely anaemic person could delay diagnosis.
We therefore examined the shape of the relationship between haemoglobin and HbA1c across a wide range of haemoglobin concentrations, from severe microcytic anaemia to normal, in non-diabetic individuals whose glycaemia was measured directly.
OBJECTIVES
The primary objective was to characterise the relationship between haemoglobin concentration and HbA1c in non-diabetic individuals with and without microcytic hypochromic anaemia, and specifically to test whether the relationship was non-linear. Secondary objectives were to compare HbA1c between anaemic and non-anaemic participants overall and across WHO anaemia severity strata, to estimate the proportion of participants with HbA1c in the prediabetes range in each stratum, and to examine whether the anaemia-related difference in HbA1c varied by sex and age.
MATERIALS AND METHODS:
Design, setting and reporting
This case–control study was carried out over six months in the Department of Internal Medicine of, Raichur institute of medical sciences (Rims), Raichur, Karnataka, India. Reporting follows the STROBE recommendations26.
Selection of cases and controls
Cases (n=50) were non-diabetic outpatients or inpatients with microcytic hypochromic anaemia, defined by haemoglobin below 13 g/dL (men) or 12 g/dL (women), mean corpuscular volume (MCV) below 76 fL, mean corpuscular haemoglobin below 27 pg, mean corpuscular haemoglobin concentration below 33 g/dL and a microcytic hypochromic peripheral smear. Controls (n=50) were non-anaemic attendees of the same departments with normal red-cell indices and smear, chosen to be comparable in age and sex.
People with any of the following were not enrolled: known or treated diabetes, or diabetic symptoms with fasting glucose above 126 mg/dL or postprandial glucose above 200 mg/dL; acute blood loss, haemolysis, known haemoglobinopathy or recent surgery; renal, hepatic, endocrine or other major systemic disease; pregnancy, confirmed by urine testing when menses were delayed; transfusion within two months; and blood urea above 20 mg/dL or serum creatinine above 1.2 mg/dL (men) or 0.9 mg/dL (women).
Operational definitions
Non-diabetic status required the absence of a diagnosis of diabetes or glucose-lowering treatment, together with fasting and postprandial plasma glucose below the exclusion thresholds; in practice, every participant had a fasting glucose below 100 mg/dL. HbA1c was the outcome variable and was interpreted against the ADA thresholds of 5.7% for prediabetes and 6.5% for diabetes2. Haemoglobin was the principal exposure. Anaemia status, severity stratum, sex and age group were treated as potential effect modifiers, and BMI, age, sex and fasting glucose as potential confounders.
Measurements
Age, sex, occupation, diet and, for women, history of menorrhagia were recorded on a structured proforma. Height and weight were measured, body mass index (BMI) was calculated, and BMI below 18.5 kg/m² was classed as underweight. Venous samples were analysed for haemoglobin, red blood cell (RBC) count, MCV, red cell distribution width (RDW), platelet and white cell counts on a Sysmex automated analyser; for fasting and postprandial plasma glucose; for serum creatinine; and for HbA1c by turbidimetric inhibition immunoassay. The Mentzer index (MCV/RBC) was calculated to screen for thalassaemia trait, a value above 13 favouring iron deficiency27.
Exposure definitions
Haemoglobin was analysed as a continuous variable and, among cases, in two categorical forms: WHO severity strata (severe below 8.0 g/dL; moderate 8.0–10.9 g/dL; mild 11.0 g/dL to the sex-specific anaemia threshold)28, with mild and moderate combined because only one case had mild anaemia; and tertiles of the case haemoglobin distribution. Mean corpuscular haemoglobin and concentration were recorded in the study database only as derived values, several of which were implausible, and were not analysed.
Data verification
The master chart was transcribed independently from the source record and checked against the summary tables prepared at the time of the original analysis; all group means and standard deviations for haematological and glycaemic variables were reproduced. Records were then screened for internal consistency (for example, agreement between recorded HbA1c, haemoglobin and the derived absolute HbA1c) and for possible duplicate entries, which were handled in a sensitivity analysis rather than deleted.
Rationale for the modelling strategy
We specified the quadratic model in advance of fitting the adjusted models because the published literature contains reports of both higher and lower HbA1c in iron deficiency, which is the pattern expected if the relationship is curvilinear. A quadratic term is the simplest departure from linearity and yields an interpretable turning point; the spline model was fitted only to check that a more flexible form did not describe the data better. Age, sex, BMI and fasting glucose were chosen as covariates because each is an established determinant of HbA1c or differed between groups. Postprandial glucose was not included in the primary adjusted model because it was obtained without a standardised glucose load. We report estimates with 95% confidence intervals and exact p values, and interpret subgroup results cautiously because the study was not powered for them.
Statistical methods
Data are summarised as mean ± standard deviation (SD) or number (%). Two-group comparisons used Welch's t-test and Pearson's χ² or Fisher's exact test; three-group comparisons across controls and the two severity strata used one-way analysis of variance with the Kruskal–Wallis test as a check. The shape of the haemoglobin–HbA1c relationship was examined in the full sample of 100 participants by comparing a linear regression of HbA1c on haemoglobin with a model adding a squared haemoglobin term. The models were compared with a likelihood-ratio test and the Akaike information criterion (AIC), and the quadratic model was checked against a natural cubic spline with three degrees of freedom. The haemoglobin concentration at which predicted HbA1c was highest (the vertex, −B₁/2B₂) was estimated with a 95% confidence interval from 2000 bootstrap resamples. The quadratic model was then adjusted for age, sex, BMI and fasting glucose. Separate linear slopes were estimated within cases and within controls, and their difference was tested with a haemoglobin × group interaction term. A trend in HbA1c across case haemoglobin tertiles was assessed with Spearman's correlation.
Anaemic and non-anaemic participants were also compared directly, unadjusted and with adjustment for age, sex, BMI and fasting glucose, and subgroup differences were estimated by sex, age (20 years or younger vs older) and severity stratum. Heteroskedasticity-consistent (HC3) standard errors were used for all regression models. Subgroup and stratified analyses were exploratory. Sensitivity analyses excluded five control women whose creatinine (1.0 mg/dL) exceeded the female threshold and nine records that duplicated another record's demographic and glycaemic values. There were no missing data. Analyses used Python 3.13.17 with SciPy 1.18.1 and statsmodels 0.15.0; p<0.05 (two-sided) was considered significant.
Ethics
The Institutional Ethics Committee of , Raichur institute of medical sciences (Rims), Raichur, Karnataka, India approved the study. All participants gave written informed consent. The study conformed to the Declaration of Helsinki.
RESULTS:
Study population
All 100 participants contributed complete data (Figure 1). Their ages ranged from 12 to 65 years (median 17), and 76 were women. Anaemic participants and controls were similar in age, sex distribution, occupation and diet, but anaemic participants were thinner and were more often underweight (26.0% vs 6.0%; p=0.012) (Table 1). Every case had a Mentzer index above 13 (mean 22.9 ± 2.5).
Table 2 sets out the profile of controls and of the two severity strata. Of the 50 cases, 22 had severe anaemia (mean haemoglobin 6.99 ± 0.91 g/dL) and 28 moderate or mild anaemia (9.07 ± 0.91 g/dL). Red-cell indices deteriorated progressively from controls through moderate to severe anaemia: MCV fell from 91.20 to 70.68 and 68.26 fL, and RDW rose from 13.21% to 18.77% and 20.77%. BMI declined in the same order (22.51, 20.81 and 18.78 kg/m²; p<0.001), and the proportion underweight rose from 6.0% to 17.9% and 36.4%. Fasting glucose was lower in the severe stratum (75.36 mg/dL) than in controls (81.14 mg/dL) or moderate anaemia (81.36 mg/dL) (ANOVA p=0.027), whereas postprandial glucose did not differ (p=0.104). The proportion of women did not differ across strata (p=0.595). Serum creatinine was lower in both anaemic strata than in controls (0.68 and 0.64 vs 0.83 mg/dL; p<0.001), consistent with the lower body mass and female predominance of the anaemic participants, while platelet and white cell counts were similar across the three groups.
Shape of the haemoglobin–HbA1c relationship
Across all 100 participants, a straight-line model detected no relationship between haemoglobin and HbA1c (B −0.0161% per g/dL, 95% CI −0.0460 to 0.0138; R²=0.012; p=0.291). Adding a squared term transformed the fit (Table 3; Figure 2). Both the linear (B 0.6698, 95% CI 0.5195 to 0.8201) and quadratic (B −0.0322, 95% CI −0.0390 to −0.0253) coefficients were significant (p<0.001), R² rose to 0.230, AIC fell from 125.4 to 102.5, and the likelihood-ratio test strongly favoured the quadratic model (χ²=24.93; p<0.001). A natural cubic spline offered no further improvement (R²=0.234; AIC 102.0).
Predicted HbA1c rose from 4.91% at a haemoglobin of 6 g/dL to 5.35% at 8 g/dL and 5.53% at 10 g/dL, then fell to 5.45% at 12 g/dL and 5.12% at 14 g/dL. The estimated peak lay at a haemoglobin of 10.41 g/dL (bootstrap 95% CI 10.00 to 10.75). No participant had a haemoglobin between 11.0 and 12.4 g/dL, so the shape of the curve in that interval is interpolated. Adjustment for age, sex, BMI and fasting glucose did not alter the curvature (quadratic B −0.0343, 95% CI −0.0426 to −0.0260; p<0.001; R²=0.297); BMI was the only covariate independently associated with HbA1c (B 0.0318, 95% CI 0.0103 to 0.0532; p=0.004).
Group-specific slopes confirmed the change of direction. Among cases, HbA1c increased by 0.177% for each 1 g/dL rise in haemoglobin (95% CI 0.137 to 0.217); among controls it decreased by 0.174% per g/dL (95% CI −0.256 to −0.092). The difference between slopes was 0.351% per g/dL (95% CI 0.260 to 0.443; p<0.001).
HbA1c across haemoglobin categories
Within the anaemic group, mean HbA1c rose stepwise across haemoglobin tertiles: 5.11 ± 0.31% in the lowest tertile (haemoglobin 5.4–7.8 g/dL), 5.33 ± 0.22% in the middle tertile (7.9–8.6 g/dL) and 5.55 ± 0.27% in the highest (8.7–11.0 g/dL) (ρ=0.59; p<0.001) (Table 4; Figure 3). Mean HbA1c in controls (5.14 ± 0.53%) resembled that of the lowest anaemic tertile. By WHO stratum, HbA1c was 5.48 ± 0.27% in moderate or mild anaemia and 5.12 ± 0.29% in severe anaemia (three-group ANOVA p=0.002).
The proportion of participants with HbA1c of 5.7% or above was 25.0% in moderate or mild anaemia and 22.0% in controls, but none of the 22 participants with severe anaemia reached this value. No participant had HbA1c of 6.5% or above.
Comparison of anaemic and non-anaemic participants
Taken as a single group, anaemic participants had a higher mean HbA1c than controls (5.32 ± 0.33% vs 5.14 ± 0.53%; difference 0.18%, 95% CI 0.005 to 0.357; p=0.044), with similar fasting (78.72 vs 81.14 mg/dL; p=0.185) and postprandial (124.68 vs 126.32 mg/dL; p=0.348) glucose. The rank-based comparison was not significant (p=0.158), reflecting the wider spread of HbA1c among controls. Adjustment for age, sex, BMI and fasting glucose increased the difference to 0.314% (95% CI 0.115 to 0.513; p=0.002) (Table 5).
The distribution of HbA1c differed in shape as well as location. Controls showed a wider spread (SD 0.53% vs 0.33%; Levene p<0.001), with 13 controls but only three anaemic participants having HbA1c of 4.6% or lower; median HbA1c was 5.35% (IQR 5.20–5.57) among anaemic participants and 5.10% (IQR 4.65–5.50) among controls. Within the anaemic group, HbA1c was correlated with haemoglobin (r=0.75; p<0.001) and inversely with RDW (r=−0.51; p<0.001), but not with MCV (r=0.12; p=0.396), RBC count (r=−0.05; p=0.738), fasting glucose (r=0.03; p=0.840) or BMI (r=0.22; p=0.133). Among controls, HbA1c was inversely correlated with RBC count (r=−0.39; p=0.005) and positively with BMI (r=0.38; p=0.006).
Subgroup estimates are shown in Figure 4 and Table 5. The difference was present in moderate or mild anaemia (0.34%, 95% CI 0.16 to 0.52; p<0.001) but not in severe anaemia (−0.02%, 95% CI −0.21 to 0.17; p=0.827). It was evident in women (0.26%, 95% CI 0.06 to 0.47; p=0.014) but not in men (−0.09%, 95% CI −0.47 to 0.28; p=0.611), and in participants aged 20 years or younger (0.28%, 95% CI 0.06 to 0.49; p=0.012) but not in older participants (0.09%, 95% CI −0.18 to 0.36; p=0.481). Excluding the five control women with creatinine above threshold (adjusted B 0.308, 95% CI 0.101 to 0.515) or nine possible duplicate records (adjusted B 0.321, 95% CI 0.126 to 0.517) did not change the conclusions.
Table 1. Characteristics of participants with microcytic hypochromic anaemia and non-anaemic controls
|
Characteristic |
Microcytic anaemia (n = 50) |
Controls (n = 50) |
p |
|
Age, years, mean ± SD |
26.0 ± 15.8 |
21.4 ± 13.0 |
0.117ᵃ |
|
Female sex, n (%) |
40 (80.0) |
36 (72.0) |
0.349ᵇ |
|
Occupation, n (%) |
|
|
0.362ᵇ |
|
Student |
29 (58.0) |
34 (68.0) |
|
|
Homemaker |
7 (14.0) |
3 (6.0) |
|
|
Employed |
14 (28.0) |
13 (26.0) |
|
|
Vegetarian diet, n (%) |
8 (16.0) |
5 (10.0) |
0.372ᵇ |
|
Menorrhagia, women, n/N (%) |
25/40 (62.5) |
22/36 (61.1) |
0.901ᵇ |
|
BMI, kg/m², mean ± SD |
19.92 ± 3.72 |
22.51 ± 3.06 |
<0.001ᵃ |
|
Underweight (BMI <18.5 kg/m²), n (%) |
13 (26.0) |
3 (6.0) |
0.012ᶜ |
|
Fasting plasma glucose, mg/dL |
78.72 ± 10.14 |
81.14 ± 7.81 |
0.185ᵃ |
|
Postprandial plasma glucose, mg/dL |
124.68 ± 8.96 |
126.32 ± 8.43 |
0.348ᵃ |
|
Mentzer index (MCV/RBC), mean ± SD |
22.9 ± 2.5 |
— |
— |
ᵃ Welch's t-test. ᵇ Pearson's χ² test. ᶜ Fisher's exact test. BMI, body mass index; MCV, mean corpuscular volume; RBC, red blood cell count; SD, standard deviation.
Table 2. Clinical and laboratory profile of controls and of participants by anaemia severity
|
Variable |
Controls (n = 50) |
Moderate/mild anaemia (n = 28) |
Severe anaemia (n = 22) |
p |
|
Age, years |
21.4 ± 13.0 |
29.9 ± 18.0 |
21.1 ± 11.0 |
0.031 |
|
Female, n (%) |
36 (72.0) |
23 (82.1) |
17 (77.3) |
0.595ᵇ |
|
BMI, kg/m² |
22.51 ± 3.06 |
20.81 ± 3.72 |
18.78 ± 3.48 |
<0.001 |
|
Underweight, n (%) |
3 (6.0) |
5 (17.9) |
8 (36.4) |
— |
|
Haemoglobin, g/dL |
13.71 ± 0.83 |
9.07 ± 0.91 |
6.99 ± 0.91 |
<0.001 |
|
RBC count, ×10⁶/µL |
4.53 ± 0.49 |
3.18 ± 0.41 |
2.96 ± 0.21 |
<0.001 |
|
MCV, fL |
91.20 ± 3.67 |
70.68 ± 2.24 |
68.26 ± 3.68 |
<0.001 |
|
RDW, % |
13.21 ± 0.68 |
18.77 ± 2.67 |
20.77 ± 2.80 |
<0.001 |
|
Platelets, ×10⁵/µL |
2.95 ± 0.95 |
3.26 ± 0.85 |
3.17 ± 0.82 |
0.304 |
|
White blood cells, /µL |
6796 ± 1752 |
6736 ± 1466 |
7223 ± 2144 |
0.574 |
|
Fasting plasma glucose, mg/dL |
81.14 ± 7.81 |
81.36 ± 10.72 |
75.36 ± 8.44 |
0.027 |
|
Postprandial plasma glucose, mg/dL |
126.32 ± 8.43 |
122.61 ± 9.73 |
127.32 ± 7.25 |
0.104 |
|
Serum creatinine, mg/dL |
0.83 ± 0.12 |
0.68 ± 0.14 |
0.64 ± 0.11 |
<0.001 |
Values are mean ± SD unless stated. p from one-way ANOVA unless marked; ᵇ Pearson's χ² test. Severity by WHO thresholds (severe <8.0 g/dL; moderate 8.0–10.9 g/dL; one participant with mild anaemia, haemoglobin 11.0 g/dL, is included in the moderate/mild group). RDW, red cell distribution width; other abbreviations as in Table 1.
Table 3. Regression models for the relationship between haemoglobin and HbA1c
|
Model |
Term |
B (95% CI) |
p |
Fit |
|
A. Linear, all participants (n = 100) |
Haemoglobin, per g/dL |
−0.0161 (−0.0460 to 0.0138) |
0.291 |
R² 0.012; AIC 125.4 |
|
B. Quadratic, all participants (n = 100) |
Haemoglobin |
0.6698 (0.5195 to 0.8201) |
<0.001 |
R² 0.230; AIC 102.5 |
|
|
Haemoglobin² |
−0.0322 (−0.0390 to −0.0253) |
<0.001 |
LR χ² 24.93 vs A, p<0.001 |
|
C. Model B adjusted ᵃ |
Haemoglobin |
0.7008 (0.5179 to 0.8837) |
<0.001 |
R² 0.297 |
|
|
Haemoglobin² |
−0.0343 (−0.0426 to −0.0260) |
<0.001 |
|
|
|
BMI, per kg/m² |
0.0318 (0.0103 to 0.0532) |
0.004 |
|
|
D. Linear, anaemic participants (n = 50) |
Haemoglobin, per g/dL |
0.177 (0.137 to 0.217) |
<0.001 |
R² 0.557 |
|
E. Linear, controls (n = 50) |
Haemoglobin, per g/dL |
−0.174 (−0.256 to −0.092) |
<0.001 |
|
|
F. Slope difference (D vs E) |
Haemoglobin × anaemia |
0.351 (0.260 to 0.443) |
<0.001 |
|
Ordinary least squares with HC3 standard errors; B in HbA1c percentage points. ᵃ Adjusted for age, sex, BMI and fasting plasma glucose (age, sex and glucose p>0.1). Peak of Model B: haemoglobin 10.41 g/dL (bootstrap 95% CI 10.00 to 10.75; 2000 resamples). Natural cubic spline (3 df): R² 0.234, AIC 102.0. AIC, Akaike information criterion; LR, likelihood ratio.
Table 4. HbA1c by anaemia category and haemoglobin tertile
|
Group |
n |
Haemoglobin range, g/dL |
HbA1c, %, mean ± SD |
HbA1c ≥5.7%, n (%) |
|
Non-anaemic controls |
50 |
12.4–15.2 |
5.14 ± 0.53 |
11 (22.0) |
|
All microcytic anaemia |
50 |
5.4–11.0 |
5.32 ± 0.33 |
7 (14.0) |
|
By WHO severity |
|
|
|
|
|
Moderate/mild |
28 |
8.0–11.0 |
5.48 ± 0.27 |
7 (25.0) |
|
Severe |
22 |
5.4–7.9 |
5.12 ± 0.29 |
0 (0.0) |
|
By haemoglobin tertile (anaemic participants) |
|
|
|
|
|
Tertile 1 |
18 |
5.4–7.8 |
5.11 ± 0.31 |
— |
|
Tertile 2 |
15 |
7.9–8.6 |
5.33 ± 0.22 |
— |
|
Tertile 3 |
17 |
8.7–11.0 |
5.55 ± 0.27 |
— |
Three-group comparison (controls, moderate/mild, severe): ANOVA p=0.002. Trend across tertiles: Spearman ρ=0.59, p<0.001. No participant had HbA1c ≥6.5%.
Table 5. Difference in mean HbA1c between anaemic participants and controls, overall and by subgroup
|
Comparison |
n (anaemia vs controls) |
Difference, % (95% CI) |
p |
|
Overall, unadjusted |
50 vs 50 |
0.18 (0.005 to 0.357) |
0.044 |
|
Overall, adjusted ᵃ |
50 vs 50 |
0.314 (0.115 to 0.513) |
0.002 |
|
Moderate/mild anaemia vs controls |
28 vs 50 |
0.34 (0.16 to 0.52) |
<0.001 |
|
Severe anaemia vs controls |
22 vs 50 |
−0.02 (−0.21 to 0.17) |
0.827 |
|
Women |
40 vs 36 |
0.26 (0.06 to 0.47) |
0.014 |
|
Men |
10 vs 14 |
−0.09 (−0.47 to 0.28) |
0.611 |
|
Age ≤20 years |
27 vs 36 |
0.28 (0.06 to 0.49) |
0.012 |
|
Age >20 years |
23 vs 14 |
0.09 (−0.18 to 0.36) |
0.481 |
|
Sensitivity: excluding 5 controls with creatinine >0.9 mg/dL ᵃ |
50 vs 45 |
0.308 (0.101 to 0.515) |
0.004 |
|
Sensitivity: excluding 9 possible duplicate records ᵃ |
47 vs 44 |
0.321 (0.126 to 0.517) |
0.001 |
Unadjusted differences from Welch's t-test. ᵃ Linear regression adjusted for age, sex, BMI and fasting plasma glucose, HC3 standard errors. Subgroup analyses were exploratory.
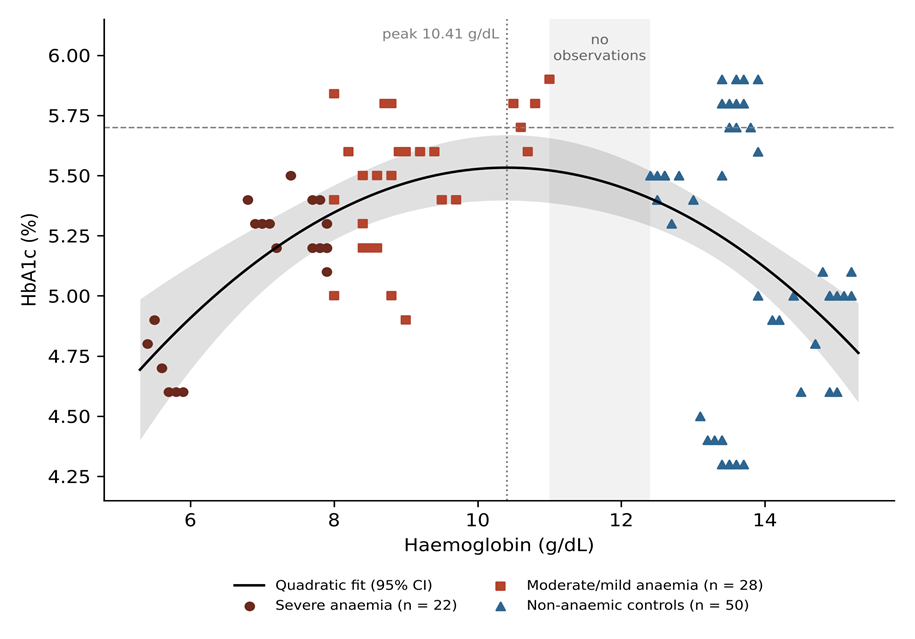
Figure 1. Participant flow (STROBE).
Cases met the haematological definition of microcytic hypochromic anaemia; controls had normal red-cell indices and peripheral smear. Severity by WHO haemoglobin thresholds.
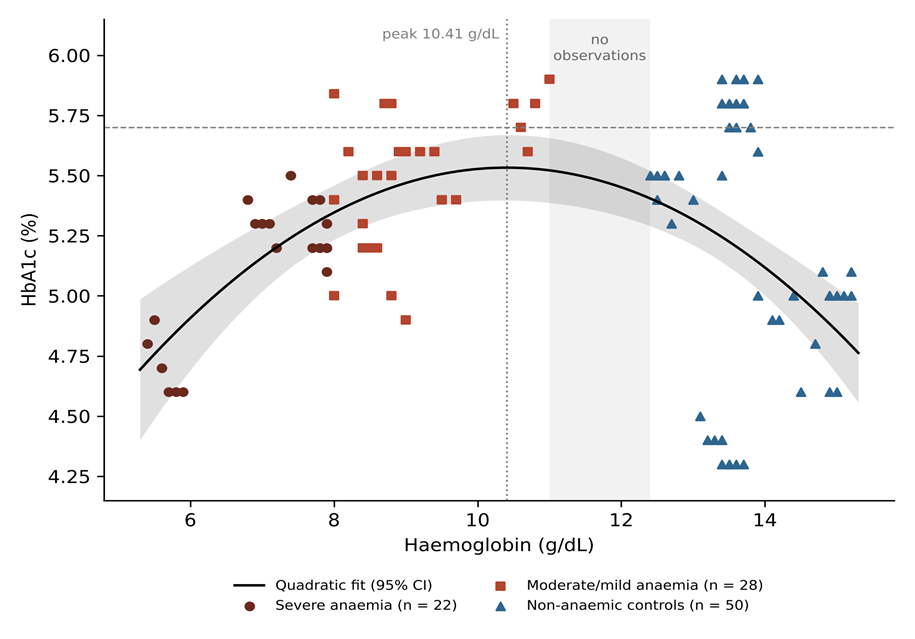
Figure 2. Relationship between haemoglobin and HbA1c in all 100 participants.
Solid line and shaded band: quadratic regression and its 95% confidence interval. The dotted vertical line marks the estimated peak (10.41 g/dL); the grey band marks the haemoglobin interval with no observations (11.0–12.4 g/dL); the dashed horizontal line marks the 5.7% prediabetes threshold.
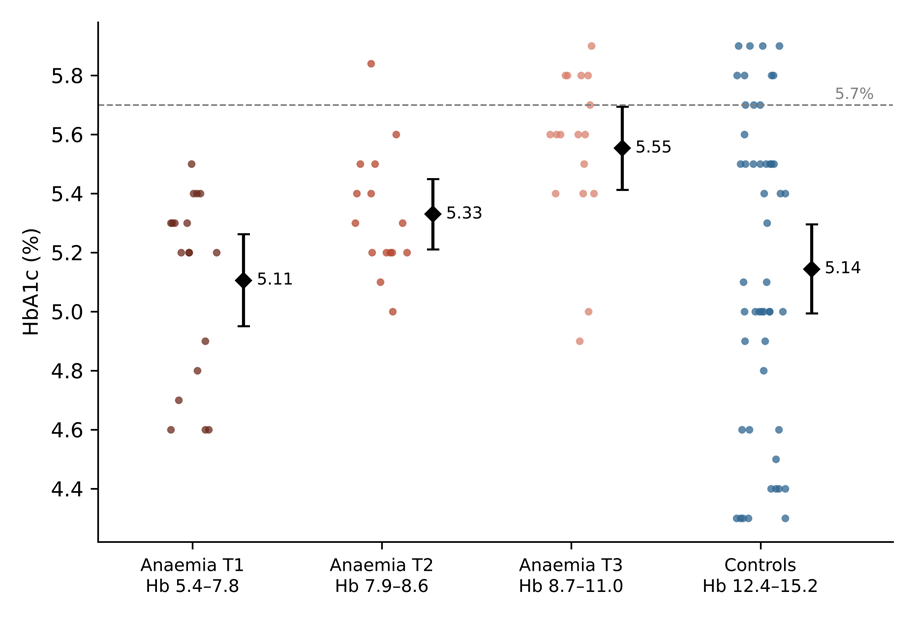
Figure 3. HbA1c by haemoglobin tertile among anaemic participants, and in controls.
Dots are individual participants; diamonds and bars are means with 95% confidence intervals. The dashed line marks the 5.7% prediabetes threshold.
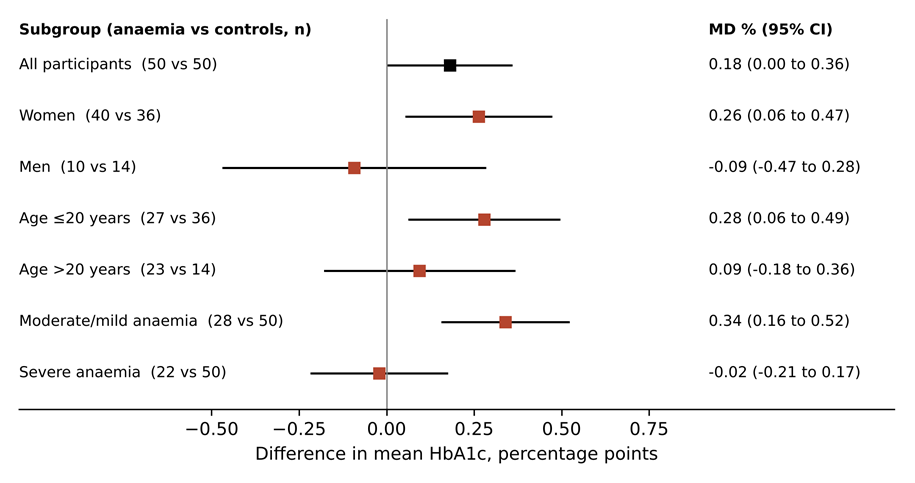
Figure 4. Difference in mean HbA1c between anaemic participants and controls, overall and by subgroup.
Squares are differences in means (anaemia minus controls) and lines are 95% confidence intervals from Welch's t-test. Severity subgroups are compared with all 50 controls; sex and age subgroups with controls of the same sex or age group.
DISCUSSION:
The central finding of this study is that HbA1c in non-diabetic individuals does not change monotonically with haemoglobin. Across a haemoglobin range of roughly 5 to 15 g/dL, HbA1c traced an inverted U, peaking at about 10.4 g/dL and declining towards both severe anaemia and the upper normal range. A linear model missed this relationship entirely. Because glucose was comparable across groups and the curvature persisted after adjustment for fasting glucose and BMI, the pattern is best explained by non-glycaemic, red-cell-related influences on HbA1c.
How the inverted U reconciles previous findings
The literature on iron deficiency and HbA1c has been read as contradictory. Studies reporting higher HbA1c in iron deficiency anaemia14,15,29,30 and studies reporting no difference or lower values17,18,31 have generally been treated as competing answers to one question. Our data suggest they may be sampling different parts of the same curve. A study whose anaemic participants cluster at moderate haemoglobin levels will observe an elevated HbA1c; one weighted towards severe anaemia will observe little difference or a lower value; and a population survey spanning mild anaemia and normal haemoglobin may observe HbA1c rising with haemoglobin, as reported from NHANES19. In our own sample, the overall comparison produced a modest 0.18% difference only because it averaged a clear elevation in moderate anaemia with no elevation in severe anaemia. This interpretation is consistent with reviews that have flagged anaemia severity as the unresolved variable24,25 and with the heterogeneity reported in recent meta-analyses22,23. To our knowledge, a curvilinear relationship of this kind has rarely been demonstrated directly within a single sample, and it provides a hypothesis that existing datasets could test.
The direction of the slope within controls also deserves comment. Among non-anaemic participants, HbA1c fell as haemoglobin and RBC count rose. Ford and colleagues found the opposite gradient in NHANES19. Our control group was young and narrowly distributed, and the descending limb of the curve rests on 50 participants, so this observation needs confirmation. It is nonetheless compatible with the glycation-gap concept: individuals with more rapid red-cell turnover, who may maintain higher RBC counts and haemoglobin, would carry a younger erythrocyte population and therefore less HbA1c at the same glucose7,8.
Biological interpretation
The ascending limb of the curve, from severe to moderate anaemia, and the elevation of moderate anaemia above normal are the features most relevant to screening. The widely accepted explanation for raised HbA1c in iron deficiency is prolonged red-cell exposure to glucose: when iron limits marrow output, fewer young cells enter the circulation, the mean erythrocyte age increases, and glycation accumulates6,7. The prompt fall in HbA1c after iron or vitamin B12 therapy, which floods the circulation with new cells, supports this mechanism17,32. Oxidative stress may contribute: lipid peroxidation is increased in iron deficiency and can promote protein glycation independently of glucose33.
The loss of this elevation in severe anaemia is harder to explain, and our interpretation is necessarily provisional. Severely iron-deficient erythrocytes are small, poorly haemoglobinised and mechanically fragile, and their survival may be shortened enough to offset the reduced rate of production. Severe anaemia is also likely to be more recent or more variable in its course, with intermittent bursts of erythropoiesis lowering mean cell age. The higher RDW of the severe stratum is in keeping with a more heterogeneous red-cell population. Finally, immunoassays report HbA1c as a ratio to total haemoglobin measured in the same specimen, and the behaviour of that ratio at very low haemoglobin concentrations is less well characterised9. Measurements of erythrocyte survival, reticulocyte counts and HbA1c by a chromatographic reference method across the severity range would separate these explanations.
The magnitude of the effect at the peak of the curve, about one third of a percentage point, is smaller than in several earlier Indian and international reports. In Chennai, Shanthi and colleagues reported a mean HbA1c of 7.6% in iron deficiency anaemia compared with 5.5% in controls15, and Coban and colleagues found 7.4% versus 5.9%14. In diabetic patients with controlled glucose in Mangalore, the increase associated with iron deficiency was greatest in those with fasting glucose of 100–126 mg/dL29. Our participants were uniformly normoglycaemic, and because glycation is driven by glucose, a given prolongation of red-cell life adds less HbA1c at lower glucose concentrations. Differences in assay method, in the severity mix of anaemic participants and in the definition of iron deficiency are further plausible sources of the variation across studies23.
Two other observations bear on interpretation. Participants with severe anaemia had a slightly lower fasting glucose, which would lower HbA1c, but the curvature was unchanged after adjustment for fasting glucose, and glucose was not associated with HbA1c among anaemic participants. Severely anaemic participants were also more often underweight. BMI was positively associated with HbA1c, and undernutrition and anaemia cluster together in India11, so some residual confounding by nutritional status is possible.
Robustness of the curvilinear finding
Several features of the analysis argue against the inverted U being a statistical artefact. The improvement in fit with the quadratic term was large, a more flexible spline did not suggest a different shape, the curvature persisted after adjustment, and the turning point was estimated with a narrow bootstrap interval. The rising limb is also visible within the anaemic group alone, in the stepwise increase across haemoglobin tertiles, and the falling limb within controls alone. Nevertheless, the two limbs come from groups recruited by different criteria, and the absence of observations between 11.0 and 12.4 g/dL means that the exact location of the peak depends on extrapolation from both sides. A population sample with continuous coverage of haemoglobin would provide a stronger test.
Sex and age
The anaemia-related elevation in HbA1c was evident in women and in participants aged 20 or younger, but not in men or older participants. These subgroups overlap substantially, because most young participants were women, and the male subgroup was small. The pattern is consistent with NHANES, in which the HbA1c shift associated with iron deficiency was concentrated in women20, and with the findings in young Indian adults from Pune21. Chronic menstrual iron loss in adolescent and young women may produce precisely the long-standing, moderate iron-restricted erythropoiesis that sits at the peak of the curve.
What the curve means for an individual patient
The fitted curve can be read as a guide to the direction of bias at different haemoglobin levels. At the same normal glycaemia, the model predicts an HbA1c of 5.35% at a haemoglobin of 8 g/dL and 5.53% at 10 g/dL, compared with 5.12% at 14 g/dL. For a woman with moderate iron deficiency anaemia whose true glycaemic status lies just below the prediabetes range, an upward shift of this size is enough to move her across the 5.7% threshold. The same woman, if her haemoglobin fell to 6 g/dL, would have a predicted HbA1c of 4.91%, lower than that of most non-anaemic people. The practical consequence is that an HbA1c value in an anaemic patient cannot be interpreted without knowing the haemoglobin, and that the direction of any correction changes with severity. These predictions are derived from a modest sample and should not be used as correction factors; they illustrate why a single adjustment would be misleading.
Alternative glycaemic markers
If HbA1c is unreliable in anaemia, the obvious alternatives are glucose itself and glycated serum proteins. Glycated albumin and fructosamine reflect glycaemia over two to three weeks and are independent of erythrocyte lifespan; in α-thalassaemia (haemoglobin H disease), for example, HbA1c was markedly lower than in healthy adults across five assay methods, whereas glycated albumin did not differ34. Glycated proteins are not entirely free of interference in iron deficiency, however: fructosamine is raised in iron deficiency anaemia and falls with iron therapy, apparently through oxidative mechanisms33. Fasting glucose and the oral glucose tolerance test therefore remain the most defensible confirmatory tests in anaemic individuals, and the inverted-U pattern we observed strengthens the case for using them whenever HbA1c and haemoglobin are both borderline.
Implications for screening
For HbA1c-based screening, the practical message is that the bias introduced by microcytic anaemia is neither constant nor predictable from the presence of anaemia alone. Moderate anaemia, the most common form in community settings, pushed HbA1c up by about a third of a percentage point, a magnitude sufficient to move individuals across the 5.7% prediabetes threshold, in a population where HbA1c already identifies more people as dysglycaemic than glucose-based tests4,5. Severe anaemia showed no upward bias, and none of these participants had HbA1c in the prediabetes range. A fixed correction factor would therefore over-correct some patients and under-correct others. Where HbA1c is used for screening, a concurrent haemoglobin measurement, which is inexpensive and usually available, should be used to flag results that need confirmation with fasting glucose or an oral glucose tolerance test, as the ADA recommends when red-cell turnover is abnormal2. Integrating such a flag into programmes that already test haemoglobin, such as Anaemia Mukt Bharat12, would be a low-cost safeguard. In people with established diabetes, evidence on iron deficiency and HbA1c is mixed35, and an unexplained rise in HbA1c in an iron-deficient patient should prompt assessment of iron status before treatment is intensified.
Strengths
Glycaemia was measured directly in all participants and was comparable between groups. Haemoglobin spanned a wide range, from 5.4 to 15.2 g/dL, allowing its relationship with HbA1c to be modelled continuously rather than only as a dichotomy. Model selection used formal tests and was checked against a flexible spline, the location of the peak was estimated with a bootstrap confidence interval, and the main estimates were stable in adjusted and sensitivity analyses.
Limitations
The case–control design produced a gap in the haemoglobin distribution between 11.0 and 12.4 g/dL, so the location and shape of the curve near its peak are partly interpolated, and the two limbs of the curve come from differently selected groups. A sample spanning the full haemoglobin range continuously would test the finding more rigorously. Iron studies and haemoglobin electrophoresis were not performed, so iron deficiency was inferred from red-cell indices and the Mentzer index, and thalassaemia trait or anaemia of inflammation cannot be fully excluded. Vitamin B12 and folate, reticulocyte counts and erythrocyte survival were not measured. HbA1c was measured once by a single immunoassay, and postprandial glucose was not obtained under standardised oral glucose tolerance test conditions. The sample was modest, young and hospital-based, with few anaemic men, and the subgroup analyses were exploratory. Five control women slightly exceeded the creatinine exclusion threshold and nine records may have been duplicates, although excluding them did not change the results. Mean corpuscular haemoglobin and concentration could not be analysed. Because cases were selected for clear-cut microcytic anaemia and controls for clearly normal indices, the study is subject to spectrum bias: people with mild anaemia or borderline indices, who are numerous in the community, were scarcely represented, and the effect in that range is inferred from the fitted curve rather than observed.
Clinical implications
Clinicians and screening programmes should not assume that anaemia biases HbA1c in a single direction. A borderline HbA1c in a person with haemoglobin in the moderate-anaemia range is likely to overstate glycaemia, whereas in severe anaemia HbA1c may be falsely reassuring relative to the expected upward bias. Glucose-based confirmation is advisable in both situations.
Future research
Individual-participant data from existing cohorts that recorded haemoglobin, iron indices and HbA1c, including Indian population studies, could be re-analysed with flexible models to test for curvature without new recruitment. Population-based studies sampling the full continuum of haemoglobin, with iron indices, haemoglobin electrophoresis, oral glucose tolerance testing and HbA1c measured by more than one method, are needed to confirm the inverted-U relationship and locate its peak precisely. Longitudinal studies following HbA1c through iron repletion from severe anaemia would show whether individuals move along the curve as haemoglobin recovers.
CONCLUSION:
In non-diabetic individuals with comparable glycaemia, HbA1c showed an inverted U-shaped relationship with haemoglobin, rising from severe to moderate microcytic anaemia, peaking at about 10.4 g/dL and declining through the normal range. Moderate anaemia was associated with a clinically relevant upward bias in HbA1c that was absent in severe anaemia. Haemoglobin should be measured alongside HbA1c in screening, and borderline HbA1c values in anaemic individuals should be confirmed with glucose-based tests.
REFERENCES:
1. International Expert Committee. International Expert Committee report on the role of the A1C assay in the diagnosis of diabetes. Diabetes Care. 2009;32(7):1327-34. doi:10.2337/dc09-9033
2. American Diabetes Association Professional Practice Committee. 2. Diagnosis and classification of diabetes: Standards of Care in Diabetes—2025. Diabetes Care. 2025;48(Suppl 1):S27-49. doi:10.2337/dc25-S002
3. Anjana RM, Unnikrishnan R, Deepa M, Pradeepa R, Tandon N, Das AK, et al. Metabolic non-communicable disease health report of India: the ICMR-INDIAB national cross-sectional study (ICMR-INDIAB-17). Lancet Diabetes Endocrinol. 2023;11(7):474-89. doi:10.1016/S2213-8587(23)00119-5
4. Nazir A, Papita R, Anbalagan VP, Anjana RM, Deepa M, Mohan V. Prevalence of diabetes in Asian Indians based on glycated hemoglobin and fasting and 2-h post-load (75-g) plasma glucose (CURES-120). Diabetes Technol Ther. 2012;14(8):665-8. doi:10.1089/dia.2012.0059
5. Mohan V, Vijayachandrika V, Gokulakrishnan K, Anjana RM, Ganesan A, Weber MB, et al. A1C cut points to define various glucose intolerance groups in Asian Indians. Diabetes Care. 2010;33(3):515-9. doi:10.2337/dc09-1694
6. Radin MS. Pitfalls in hemoglobin A1c measurement: when results may be misleading. J Gen Intern Med. 2014;29(2):388-94. doi:10.1007/s11606-013-2595-x
7. Cohen RM, Franco RS, Khera PK, Smith EP, Lindsell CJ, Ciraolo PJ, et al. Red cell life span heterogeneity in hematologically normal people is sufficient to alter HbA1c. Blood. 2008;112(10):4284-91. doi:10.1182/blood-2008-04-154112
8. Cohen RM, Holmes YR, Chenier TC, Joiner CH. Discordance between HbA1c and fructosamine: evidence for a glycosylation gap and its relation to diabetic nephropathy. Diabetes Care. 2003;26(1):163-7. doi:10.2337/diacare.26.1.163
9. Little RR, Rohlfing CL. The long and winding road to optimal HbA1c measurement. Clin Chim Acta. 2013;418:63-71. doi:10.1016/j.cca.2012.12.026
10. GBD 2021 Anaemia Collaborators. Prevalence, years lived with disability, and trends in anaemia burden by severity and cause, 1990-2021: findings from the Global Burden of Disease Study 2021. Lancet Haematol. 2023;10(9):e713-34. doi:10.1016/S2352-3026(23)00160-6
11. Ghosh K, Chakraborty AS, Haloi B, Zakir S. Spatial clustering of malnutrition and anemia among reproductive women and its associated risk factors in India: evidence from National Family Health Survey-5. Food Nutr Bull. 2024;45(1):3-11. doi:10.1177/03795721241234086
12. Bansal PG, Mazumder S, Sharma N, Kulkarni R, Thankachan P, Prasad P, et al. Implementation research to develop and optimize delivery models for evidence-based anemia control interventions in India: protocol for the precision-driven response for anemia control and sustainable health (PRAKASH) study. PLoS One. 2026;21(6):e0351414. doi:10.1371/journal.pone.0351414
13. Brooks AP, Metcalfe J, Day JL, Edwards MS. Iron deficiency and glycosylated haemoglobin A. Lancet. 1980;2(8186):141. doi:10.1016/s0140-6736(80)90019-7
14. Coban E, Ozdogan M, Timuragaoglu A. Effect of iron deficiency anemia on the levels of hemoglobin A1c in nondiabetic patients. Acta Haematol. 2004;112(3):126-8. doi:10.1159/000079722
15. Shanthi B, Revathy C, Manjula Devi AJ, Subhashree. Effect of iron deficiency on glycation of haemoglobin in nondiabetics. J Clin Diagn Res. 2013;7(1):15-7. doi:10.7860/JCDR/2012/4881.2659
16. Tarim O, Küçükerdoğan A, Günay U, Eralp O, Ercan I. Effects of iron deficiency anemia on hemoglobin A1c in type 1 diabetes mellitus. Pediatr Int. 1999;41(4):357-62. doi:10.1046/j.1442-200x.1999.01083.x
17. Gram-Hansen P, Eriksen J, Mourits-Andersen T, Olesen L. Glycosylated haemoglobin (HbA1c) in iron- and vitamin B12 deficiency. J Intern Med. 1990;227(2):133-6. doi:10.1111/j.1365-2796.1990.tb00131.x
18. Sinha N, Mishra TK, Singh T, Gupta N. Effect of iron deficiency anemia on hemoglobin A1c levels. Ann Lab Med. 2012;32(1):17-22. doi:10.3343/alm.2012.32.1.17
19. Ford ES, Cowie CC, Li C, Handelsman Y, Bloomgarden ZT. Iron-deficiency anemia, non-iron-deficiency anemia and HbA1c among adults in the US. J Diabetes. 2011;3(1):67-73. doi:10.1111/j.1753-0407.2010.00100.x
20. Kim C, Bullard KM, Herman WH, Beckles GL. Association between iron deficiency and A1C levels among adults without diabetes in the National Health and Nutrition Examination Survey, 1999-2006. Diabetes Care. 2010;33(4):780-5. doi:10.2337/dc09-0836
21. Hardikar PS, Joshi SM, Bhat DS, Raut DA, Katre PA, Lubree HG, et al. Spuriously high prevalence of prediabetes diagnosed by HbA(1c) in young Indians partly explained by hematological factors and iron deficiency anemia. Diabetes Care. 2012;35(4):797-802. doi:10.2337/dc11-1321
22. Cavagnolli G, Pimentel AL, Freitas PA, Gross JL, Camargo JL. Factors affecting A1C in non-diabetic individuals: review and meta-analysis. Clin Chim Acta. 2015;445:107-14. doi:10.1016/j.cca.2015.03.024
23. Souza EMC, Domingueti CP. Interference of iron deficiency in glycated hemoglobin testing and its clinical implications: a systematic review and meta-analysis. Biochem Med (Zagreb). 2026;36(3):030503. doi:10.11613/BM.2026.030503
24. Hag Elagib MA, Ahmed RA, Eltom H, Abdelrahman MF, Mohammed MMEA, Ahmed A, et al. Iron deficiency, iron deficiency anemia, and HbA1c levels in nondiabetic adults: a systematic review and meta-analysis. Cureus. 2026;18(8):e115191. doi:10.7759/cureus.115191
25. English E, Idris I, Smith G, Dhatariya K, Kilpatrick ES, John WG. The effect of anaemia and abnormalities of erythrocyte indices on HbA1c analysis: a systematic review. Diabetologia. 2015;58(7):1409-21. doi:10.1007/s00125-015-3599-3
26. Von Elm E, Altman DG, Egger M, Pocock SJ, Gøtzsche PC, Vandenbroucke JP; STROBE Initiative. The Strengthening the Reporting of Observational Studies in Epidemiology (STROBE) statement: guidelines for reporting observational studies. Lancet. 2007;370(9596):1453-7. doi:10.1016/S0140-6736(07)61602-X
27. Mentzer WC Jr. Differentiation of iron deficiency from thalassaemia trait. Lancet. 1973;1(7808):882. doi:10.1016/s0140-6736(73)91446-3
28. World Health Organization. Haemoglobin concentrations for the diagnosis of anaemia and assessment of severity. Vitamin and Mineral Nutrition Information System (WHO/NMH/NHD/MNM/11.1) [Internet]. Geneva: WHO; 2011 [cited 2026 Oct 23]. Available from: https://www.who.int/publications/i/item/WHO-NMH-NHD-MNM-11.1
29. Christy AL, Manjrekar PA, Babu RP, Hegde A, Rukmini MS. Influence of iron deficiency anemia on hemoglobin A1c levels in diabetic individuals with controlled plasma glucose levels. Iran Biomed J. 2014;18(2):88-93. doi:10.6091/ibj.1257.2014
30. Rafat D, Rabbani TK, Ahmad J, Ansari MA. Influence of iron metabolism indices on HbA1c in non-diabetic pregnant women with and without iron-deficiency anemia: effect of iron supplementation. Diabetes Metab Syndr. 2012;6(2):102-5. doi:10.1016/j.dsx.2012.05.011
31. Bindayel IA. Influence of iron deficiency anemia on glycated hemoglobin levels in non-diabetic Saudi women. J Int Med Res. 2021;49(2):300060521990157. doi:10.1177/0300060521990157
32. AlQarni AM, Alghamdi AA, Aljubran HJ, Bamalan OA, Abuzaid AH, AlYahya MA. The effect of iron replacement therapy on HbA1c levels in diabetic and nondiabetic patients: a systematic review and meta-analysis. J Clin Med. 2023;12(23):7287. doi:10.3390/jcm12237287
33. Sundaram RC, Selvaraj N, Vijayan G, Bobby Z, Hamide A, Rattina Dasse N. Increased plasma malondialdehyde and fructosamine in iron deficiency anemia: effect of treatment. Biomed Pharmacother. 2007;61(10):682-5. doi:10.1016/j.biopha.2007.06.013
34. He D, Kuang W, Yang X, Xu M. Association of hemoglobin H (HbH) disease with hemoglobin A1c and glycated albumin in diabetic and non-diabetic patients. Clin Chem Lab Med. 2021;59(6):1127-32. doi:10.1515/cclm-2020-1563
35. Kuang L, Li W, Xu G, You M, Wu W, Li C. Systematic review and meta-analysis: influence of iron deficiency anemia on blood glycosylated hemoglobin in diabetic patients. Ann Palliat Med. 2021;10(11):11705-13. doi:10.21037/apm-21-2944.