The Association of Non-Alcoholic Fatty Liver Disease with Diabetic Retinopathy in Persons with Type 2 Diabetes Mellitus in Central Kerala: an Unmatched Case-Control Study.
- Dr. Manju Abraham , Professor, Department of Ophthalmology, Government Medical College (GMC), Ernakulam, Kerala, India.
- Dr. Juliet Roseline John , Associate Professor, Department of Radiodiagnosis, Government Medical College (GMC), Ernakulam, Kerala, India.
- Dr. Dhanya V.S. , Associate Professor, Department of Ophthalmology, Government Medical College (GMC), Ernakulam, Kerala, India.
- Dr. Deepa M.G. , Assistant Professor, Department of Ophthalmology, Government Medical College (GMC), Ernakulam, Kerala, India.
- Dr. Shobha Shalini , Lecturer, Department of Microbiology, Government Medical College (GMC), Ernakulam, Kerala, India.
Article Information:
Abstract:
Background: Non-alcoholic fatty liver disease (NAFLD) and type-2-diabetes mellitus (T2DM) share a bidirectional, insulin-resistance-driven pathophysiology, but whether NAFLD independently predicts diabetic retinopathy (DR) remains unsettled. This study aimed to determine the direction and magnitude of association between NAFLD and DR among patients with T2DM. Methods: In this unmatched case-control study, T2DM patients with ultrasonographically confirmed NAFLD (cases) were compared with T2DM patients without NAFLD (controls), recruited consecutively from ophthalmology and radiology departments. The study graded DR by dilated fundus examination using ETDRS criteria. Quantitative variables (anthropometric, glycaemic, hepatic, and lipid profiles) were compared between groups, and qualitative variables, including DR prevalence and grade distribution, were compared with unadjusted odds ratios (OR) and 95% confidence intervals (CI) calculated for key outcomes. Results: Sixty-six cases and 66 controls were enrolled. Cases were significantly younger (Mean (SD), 56.4 (7.81) vs 62.2 (8.13) years, p<0.001) with shorter diabetes duration (9.94 (5.76) vs 13.2 (7.57) years, P=0.007), higher BMI (26.9 (4.24) vs 24.6 (3.34) kg/m2, P<0.001), higher fasting glucose, cholesterol, triglycerides and LDL, and more dyslipidemia, but less hypertension, CKD and insulin use than controls. The DR was present in 23 cases (34.8%) and 30 controls (45.5%) (OR 1.56, 95% CI 0.77-3.14; P=0.214); DR-grade distribution did not differ significantly (P=0.198). Conclusion: In this cohort, NAFLD was not significantly associated with DR, with a non-significant trend toward lower DR prevalence among cases; NAFLD nonetheless marked an adverse metabolic profile. Age/duration imbalance between groups limits causal interpretation; larger, adjusted, prospective studies are warranted.
Keywords:
Article :
INTRODUCTION:
Non-alcoholic fatty liver disease (NAFLD), currently known as metabolic dysfunction-associated steatotic liver disease (MASLD), is the leading cause of chronic liver disease worldwide, defined by triglyceride accumulation in 5% or more of hepatocytes in the absence of significant alcohol consumption or other identifiable causes of hepatic steatosis. The disease spans a spectrum from simple steatosis to non-alcoholic steatohepatitis, progressive fibrosis, cirrhosis, and, in a subset, hepatocellular carcinoma. Metabolic syndrome, insulin resistance, obesity, hypertension, dyslipidemia, and type 2 diabetes mellitus (T2DM) are shared antecedents closely linked to NAFLD.[1] The global prevalence of NAFLD is estimated at approximately 38% among adults and 7-14% among children.[2] Community-based surveys from Asian countries have reported prevalence estimates ranging from 15% to 49.8%.[1]
Obesity and T2DM are among the strongest risk factors for NAFLD, which affects an estimated 50-75% of individuals with T2DM.[3] The relationship between NAFLD and T2DM is bidirectional: NAFLD is both a consequence and a driver of insulin resistance, and the two conditions interact to accelerate atherosclerosis, chronic kidney disease (CKD), and diabetic retinopathy (DR).[1] India carries a disproportionate share of the global diabetes burden, with an estimated 589 million people with diabetes worldwide; 89.8 million reside in India.[4] The pathophysiological link between NAFLD and T2DM is generally explained by insulin resistance and compensatory hyperinsulinemia, which drive both hepatic triglyceride accumulation and progressive pancreatic β-cell dysfunction. Once established, NAFLD in a person with T2DM appears to independently raise the risk of cardiovascular disease and diabetic vascular complications.[5] The DR, a microvascular complication of diabetes, remains a leading cause of preventable blindness among working-age adults. National survey data place the prevalence of DR in India at 16.9%, with sight-threatening disease affecting 3.6% of diabetic patients.[6] A meta-analysis of observational studies similarly reported that the direction of the NAFLD-DR association differs by population subgroup: East Asian cohorts from China, Korea, and Iran have generally shown a lower risk of DR among patients with NAFLD, whereas cohorts from South India and Italy have shown the opposite, an increased risk.[7] Consistent with the East Asian pattern, separate Chinese studies reported a negative correlation between NAFLD and both diabetes duration and DR.[8,9] Given these conflicting regional findings, this study aimed to examine the direction and magnitude of the NAFLD-DR association among Indian patients with T2DM.
MATERIALS AND METHODS:
Study Design
This unmatched case-control study was conducted in the Departments of Ophthalmology and Radiodiagnosis, Government Medical College, Ernakulam, a public-sector tertiary-care teaching hospital in Central Kerala, India, over a period of two years from January 2022 to December 2024, after obtaining clearance from the Institutional Ethics Committee (IEC No: 92/2021).
Study Population and Sampling
Patients with T2DM attending the diabetic clinic were referred consecutively to the ophthalmology and radiology departments for routine screening of diabetic complications. A case was defined as a patient with T2DM found to have NAFLD on screening abdominal ultrasonography; a control was a patient with T2DM without ultrasonographic evidence of NAFLD. Recruitment proceeded consecutively: once a case was identified, the next eligible patient with T2DM but without NAFLD was enrolled as a control, generating an unmatched 1:1 case-to-control ratio. Patients with T2DM who first presented to the radiology department for an abdominal ultrasound for an unrelated indication, and who otherwise met eligibility criteria, were also referred to ophthalmology for retinal assessment and enrolled using the same procedure.
Study Objective
The primary objective of this study was to determine the association between NAFLD and DR among patients with T2DM by comparing the prevalence of DR between patients with and without NAFLD. The secondary objectives were to compare demographic, anthropometric, glycemic, hepatic, and lipid profile parameters between cases (patients with NAFLD) and controls (patients without NAFLD), and to evaluate the association of NAFLD with other diabetes-related comorbidities, including hypertension, dyslipidemia, CKD, and coronary artery disease (CAD).
Eligibility Criteria
Patients aged 40 years and above with T2DM, who had undergone both an ultrasonographic assessment for NAFLD and a retinal assessment for DR, and provided informed consent, were included in the study. Patients were excluded if they had alcohol-related steatosis, a prior history of liver disease (including viral hepatitis or jaundice), a history of obesity-related bariatric or intestinal surgery, past use of hepatotoxic medication, an incomplete ultrasonographic or retinal assessment, or if they declined consent.
Sample Size
The sample size was calculated for an unmatched case-control design using estimates from a study reporting a retinopathy prevalence of 29.4% among diabetic patients with NAFLD and 9.8% among those without NAFLD, corresponding to an adjusted odds ratio of 3.46 [10]. Assuming 80% power, a two-sided significance level of 95%, a 1:1 allocation ratio, and a minimum detectable odds ratio of 3, a sample of 65 cases and 65 controls (130 in total) was required.
Sample size was calculated using the formula:

Where: Proportion of controls with exposure (p0)
Proportion of cases with exposure (p1)
Proportion of controls without exposure (q0)
Proportion of cases without exposure (q1)
Odds Ratio = 3
Z1-α /2 = 1.96
Z1-β = 0.84
Data Collection
A structured proforma was used to record demographic details (age, sex, urban/rural residence), anthropometric measurements (height, weight, body mass index [BMI]), duration of diabetes, blood pressure, and diabetes treatment (oral hypoglycaemic agents (OHA), insulin). Fasting and postprandial blood glucose (FBS and PPBS) and glycated haemoglobin (HbA1c) were recorded. Liver function tests included total bilirubin, aspartate and alanine aminotransferase (AST and ALT), alkaline phosphatase (ALP), total protein, albumin, and globulin, which were measured. A lipid profile, total cholesterol, triglycerides, HDL, and LDL, was calculated. Comorbidities recorded included hypertension, dyslipidemia, thyroid disorder, CKD, and CAD, defined by documented diagnosis or ongoing treatment. Abdominal ultrasonography was used to diagnose NAFLD, with grading into absent, mild, moderate, or severe categories according to liver echotexture and the clarity of visualization of the portal vein wall and diaphragm.
All patients underwent visual acuity testing, refraction, slit-lamp biomicroscopy with a +90D lens, and dilated indirect ophthalmoscopy with a +20D lens after instillation of tropicamide eye drops. The status of the worse eye was used to grade overall severity. DR was classified according to the Early Treatment Diabetic Retinopathy Study (ETDRS) criteria into no DR, mild, moderate, or severe non-proliferative DR (NPDR), proliferative DR (PDR), and diabetic macular oedema (DME); DR was also analyzed as a binary present/absent variable for the primary analysis. All ophthalmic examinations were performed by trained ophthalmologists in the study department using a standardized protocol to minimize inter-observer variation in grading.
Statistical Analysis
Data were examined for normality before selecting parametric or non-parametric tests for bivariate comparisons. Quantitative variables are presented as mean (standard deviation [SD]) and were compared between cases and controls using the independent-samples Student's t-test. Qualitative variables are presented as n (%) and were compared using the Chi-square test, with continuity correction or Fisher's exact test applied where expected cell counts were small (typically <5). Unadjusted odds ratios (OR) with 95% confidence intervals (CI) were calculated for the association between NAFLD and DR, and for other categorical comorbidities. A two-tailed P-value of less than 0.05 was considered statistically significant throughout. Computer software (Jamovi) was used in statistical analysis.
RESULTS:
A total of 132 patients with T2DM were enrolled, 66 with NAFLD (cases) and 66 without NAFLD (controls). Cases and controls were recruited in parallel from the diabetic clinic, ophthalmology outpatient department, and radiology department over the study period.
Demographic and Clinical Characteristics
Cases were significantly younger than controls (Mean (SD) age, 56.4 (7.81) vs 62.2 (8.13) years, 95% CI -8.50 to -3.01; P<0.001) and had a significantly shorter duration of diabetes (9.94 (5.76) vs 13.2 (7.57) years; P=0.007). Cases also had a significantly higher BMI than controls (mean (SD): 26.9 (4.24) vs 24.6 (3.34) kg/m²; P<0.001), consistent with the established link between obesity and NAFLD. Systolic and diastolic Blood Pressure (SBP and DBP) did not differ significantly between groups (SBP: mean (SD), 140 (18.7) vs 136 (19.8) mmHg, P=0.322; DBP: 85.7 (10.2) vs 85.3 (10.6) mmHg, P=0.803) (Table 1).
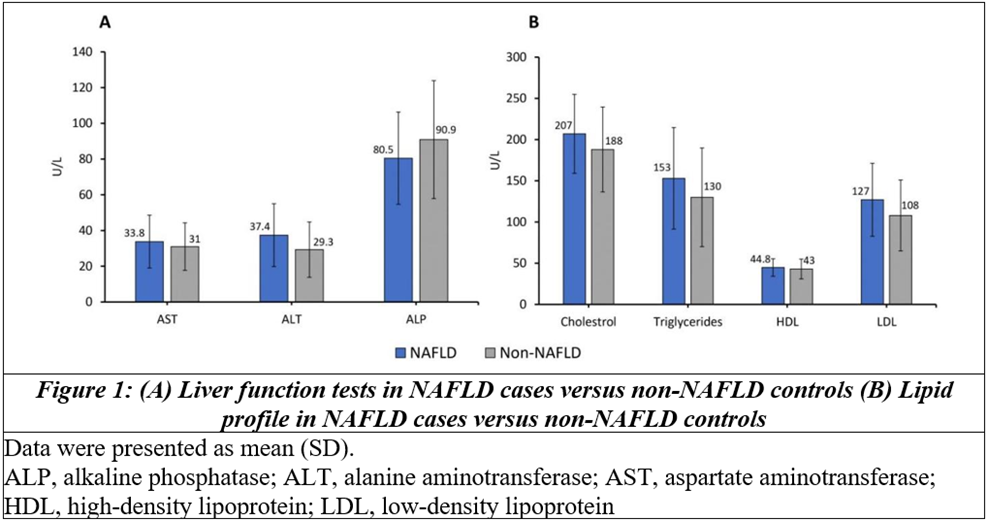
Regarding liver function, ALT level was significantly higher among cases than controls (mean (SD), 37.4 (17.6) vs 29.3 (15.5) U/L; P=0.006), while ALP was significantly lower in cases (80.5 (25.8) vs 90.9 (33.0) U/L; P=0.045). The AST did not differ significantly between groups (33.8 (14.8) vs 31.0 (13.3) U/L; P=0.246) (Figure 1A). Serum albumin was significantly higher among cases (4.30 (0.37) vs 3.94 (0.65) g/dL; P<0.001), while total protein and globulin did not differ significantly between groups (P=0.650 and P=0.200, respectively) (Table 1).
Cases also had a significantly more adverse lipid profile than controls, with higher total cholesterol (207 (47.9) vs 188 (51.5) mg/dL; P=0.031), triglycerides (153 (61.6) vs 130 (59.8) mg/dL; P=0.027), and LDL-cholesterol (127 (44.3) vs 108 (43.0) mg/dL; P=0.013). HDL-cholesterol did not differ significantly between groups (44.8 (10.6) vs 43.0 (12.0) mg/dL; P=0.371) (Figure 1B).
Sex distribution (45.5% vs 50.0% male; P=0.601) and urban residence (56.1% vs 60.6%; P=0.596) were comparable between groups. Hypertension was significantly less frequent among cases than controls (40.9% vs 59.1%; P=0.037), while dyslipidemia was significantly more frequent among cases (51.5% vs 30.3%; CI 1.20-4.99; P=0.013). Thyroid disorder prevalence was similar between groups (10.6% vs 7.6%; CI 0.43-4.82; P=0.545). Chronic Kidney Disease was significantly less frequent among cases (4.5% vs 21.2%; CI 0.05-0.65), whereas CAD prevalence did not differ significantly between groups (16.7% vs 27.3%; CI 0.23-1.24; P=0.141). Use of OHA was higher among cases (92.4% vs 81.8%; CI 0.90-8.19; P=0.069), while insulin use was significantly lower among cases (24.6% vs 50.0%; CI 0.16-0.69; P=0.003) (Table 2).
Association of NAFLD with Diabetic Retinopathy
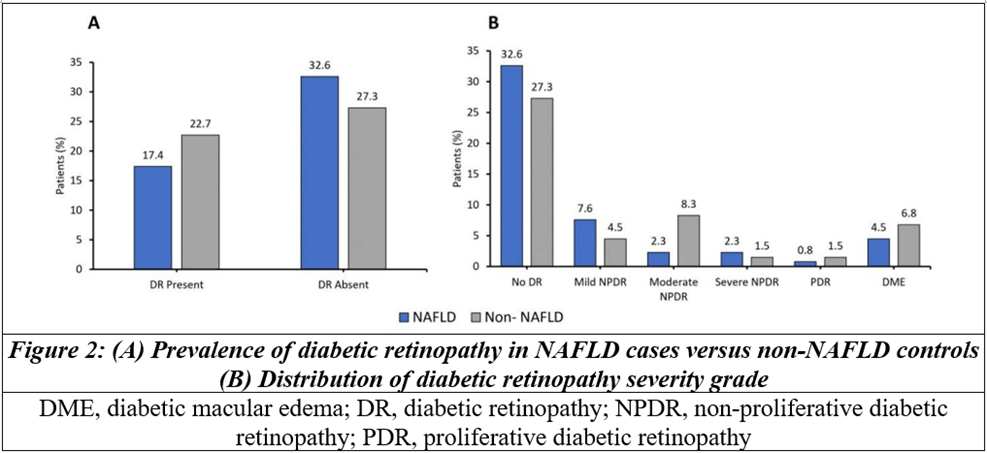
Ultrasonographic grading among the 66 NAFLD cases showed mild (grade 1) steatosis in 58 (87.9%) and moderate (grade 2) steatosis in 8 (12.1%); no case had severe (grade 3) steatosis. Among all patients, DR was present in 23 (34.8%) cases and 30 (45.5%) controls (Figure 2A). This corresponded to an unadjusted OR of 1.5 for DR among controls relative to cases, a non-significant trend toward lower prevalence of DR among patients with NAFLD. Across the six-category, “no DR” was recorded in 43 (65.2%) cases and 36 (54.5%) controls; mild NPDR in 10 (15.2%) and 6 (9.1%); moderate NPDR in 3 (4.5%) and 11 (16.7%); severe NPDR in 3 (4.5%) and 2 (3.0%); PDR in only 1 (1.5%) and 2 (3.0%); and DME in 6 (9.1%) and 9 (13.6%) of cases and controls, respectively (Figure 2B).
Table 1: Comparison of continuous demographic, glycaemic, and hepatic parameters between NAFLD cases and non-NAFLD controls
|
Variable |
Cases (NAFLD+, n=66) |
Controls (non-NAFLD, n=66) |
Mean difference |
p-value |
|
Age (years) |
56.4 (7.81) |
62.2 (8.13) |
-5.76 |
<0.001 |
|
Duration of diabetes (years) |
9.94 (5.76) |
13.2 (7.57) |
-3.21 |
0.007 |
|
BMI (kg/m2) |
26.9 (4.24) |
24.6 (3.34) |
2.26 |
<0.001 |
|
SBP (mmHg) |
140 (18.7) |
136 (19.8) |
3.33 |
0.322 |
|
DBP (mmHg) |
85.7 (10.2) |
85.3 (10.6) |
0.46 |
0.803 |
|
FBS (mg/dL) |
156 (55.5) |
137 (44.0) |
19.85 |
0.024 |
|
PPBS (mg/dL) |
235 (79.9) |
215 (67.9) |
19.85 |
0.127 |
|
HbA1c (%) |
8.30 (1.71) |
7.96 (1.45) |
0.34 |
0.222 |
|
Total protein (g/dL) |
7.63 (0.48) |
8.04 (7.41) |
-0.42 |
0.650 |
|
Albumin (g/dL) |
4.30 (0.37) |
3.94 (0.65) |
0.36 |
<0.001 |
|
Globulin (g/dL) |
3.75 (3.55) |
3.18 (0.43) |
0.57 |
0.200 |
|
Data presented as mean (SD). BMI, body mass index; DBP, diastolic blood pressure; FBS, fasting blood sugar; HbA1c, glycated hemoglobin; NAFLD, non-alcoholic fatty liver disease; PPBS, postprandial blood sugar; SBP, systolic blood pressure |
||||
Table 2: Comparison of categorical demographic variables and comorbidities between NAFLD cases and non-NAFLD controls
|
Variable |
Cases (NAFLD+, n=66) |
Controls (non-NAFLD, n=66) |
P-value |
OR |
|
Male sex |
30 (45.5) |
33 (50.0) |
0.601 |
0.83 |
|
Urban residence |
37 (56.1) |
40 (60.6) |
0.596 |
0.84 |
|
Hypertension |
27 (40.9) |
39 (59.1) |
0.037 |
0.48 |
|
Dyslipidemia |
34 (51.5) |
20 (30.3) |
0.013 |
2.44 |
|
Thyroid disorder |
07 (10.6) |
05 (07.6) |
0.545 |
1.45 |
|
CKD |
03 (04.5) |
14 (21.2) |
0.004 |
0.18 |
|
CAD |
11 (16.7) |
18 (27.3) |
0.141 |
0.53 |
|
OHA |
61 (92.4) |
54 (81.8) |
0.069 |
2.71 |
|
Insulin use |
16 (24.6) |
33 (50.0) |
0.003 |
0.33 |
|
Data presented as n (%). CAD, coronary artery disease; CKD, chronic kidney disease; NAFLD, non-alcoholic fatty liver disease; OHA, oral hypoglycemic agents; OR, odds ratio. |
||||
DISCUSSION:
In this hospital-based unmatched case-control study of 132 patients with T2DM, NAFLD was not significantly associated with DR; the estimate suggested a lower prevalence of DR among patients with NAFLD. This finding contrasts with an earlier South Indian report that found a markedly higher prevalence of retinopathy among diabetic patients with NAFLD.[10] However, it is consistent with several East Asian studies. A meta-analysis of observational studies noted that the direction of the NAFLD-DR association varies by population subgroup: cohorts from China, Korea, and Iran have generally shown a reduced risk of DR in NAFLD patients, while cohorts from India and Italy have shown an increased risk.[7] Two Chinese studies similarly reported an inverse relationship between NAFLD and both diabetes duration and DR.[8,9] More recent evidence reinforces this heterogeneity: a systematic review and meta-analysis of sixteen studies reported a modestly lower risk of retinopathy among T2DM patients with NAFLD, alongside a paradoxically increased risk of nephropathy, suggesting divergent microvascular pathways for the liver-kidney and liver-eye axes.[11] A large Japanese cross-sectional study using AI-based fundus grading likewise found no consistent positive association between MASLD and DR severity.[12] The present study results from a South Indian population diverge from the earlier South Indian report[10] and instead align more closely with the East Asian pattern, underscoring that the relationship between these two common conditions is genuinely heterogeneous rather than uniformly positive, and may be modified by unmeasured, population-specific factors such as body-fat distribution, genetic polymorphisms affecting hepatic lipid handling, dietary patterns, or the stage of NAFLD and diabetes at which patients are typically diagnosed.
Cases in the present study were significantly younger and had a shorter duration of diabetes than controls, despite carrying a higher BMI and a more adverse lipid profile. This pattern is compatible with a hypothesis: NAFLD, driven principally by obesity and insulin resistance, tends to manifest earlier in the course of metabolic disease, while DR, a slowly progressive microvascular complication, accumulates with longer diabetes duration and older age largely irrespective of hepatic steatosis.[9,13] The controls of this study were, on average, roughly six years older and had approximately three years' longer diabetes duration; part of the higher unadjusted DR prevalence observed among controls could reflect this age/duration imbalance rather than a true protective effect of NAFLD. This is an important caveat: since the study was an unmatched design, and age and diabetes duration are among the most consistently reported determinants of DR risk, residual confounding by these variables cannot be excluded from the unadjusted analysis.
CONCLUSION:
In this case-control study of patients with T2DM, NAFLD was not significantly associated with DR, with the point estimate suggesting a non-significant trend toward lower DR prevalence among NAFLD cases, a pattern more consistent with reports from East Asia. A distinctly adverse metabolic profile, characterized by higher BMI, elevated fasting blood sugar, dyslipidemia, and altered liver enzymes, was associated with NAFLD, reaffirming its role as a marker of metabolic risk in T2DM even though its independent relationship with microvascular retinal disease remains uncertain. The presence of NAFLD coincided with a markedly adverse metabolic profile, including elevated BMI, higher FBS, dyslipidemia, and abnormal liver enzymes, underscoring its value as a marker of metabolic risk in T2DM despite uncertainty regarding its independent association with microvascular retinal disease. Given the imbalance in age and diabetes duration between groups, these findings should be regarded as preliminary; multivariable-adjusted, prospective, multicentric studies are warranted before NAFLD can be recommended, or dismissed, as a marker for retinopathy screening in patients with T2DM.
REFERENCES:
1. Kumar R, Priyadarshi RN, Anand U. Non-alcoholic Fatty Liver Disease: Growing Burden, Adverse Outcomes and Associations. J Clin Transl Hepatol 2020;8:76-86.
2. Younossi ZM, Kalligeros M, Henry L. Epidemiology of metabolic dysfunction-associated steatotic liver disease. Clin Mol Hepatol 2025;31:S32-50.
3. Beyazal Polat H, Beyazal M, Arpa M, et al. Exploring the prevalence and risk factors of MASLD in patients with newly diagnosed diabetes mellitus: a comprehensive investigation. J Clin Med 2025;14:3513.
4. Diabetes Atlas. 11th edn. Brussels: International Diabetes Federation; 2025. Available on:https://media.idf.org/media/uploads/sites/3/2025/10/IDF_Diabetes_Atlas_11th_Edition_2025_WEB.pdf
5. Dai W, Ye L, Liu A, et al. Prevalence of nonalcoholic fatty liver disease in patients with type 2 diabetes mellitus: A meta-analysis. Medicine (Baltimore) 2017;96:e8179.
6. Vashist P, Senjam SS, Gupta V, et al. Prevalence of diabetic retinopathy in India: Results from the National Survey 2015-19. Indian J Ophthalmol 2021;69:3087-94.
7. Song D, Li C, Wang Z, Zhao Y, Shen B, Zhao W. Association of non-alcoholic fatty liver disease with diabetic retinopathy in type 2 diabetic patients: A meta-analysis of observational studies. J Diabetes Investig 2021;12:1471-9.
8. Lv WS, Sun RX, Gao YY, et al. Nonalcoholic fatty liver disease and microvascular complications in type 2 diabetes. World J Gastroenterol 2013;19:3134-42.
9. Zhang M, Li L, Chen J, et al. Presence of diabetic retinopathy is lower in type 2 diabetic patients with non-alcoholic fatty liver disease. Medicine (Baltimore) 2019;98:e15362.
10. Viswanathan V, Kadiri M, Medimpudi S, et al. Association of non-alcoholic fatty liver disease with diabetic microvascular and macrovascular complications in South Indian diabetic subjects. Int J Diab Dev Ctries 2010;30:208.
11. Shao J, Zhou M, Xie X, et al. Association between fatty liver disease and risk of microvascular complications in Type-2 diabetes mellitus: a systematic review and meta-analysis. Pakistan Journal of Medical Sciences 2025;41:902-9.
12. Komatsu K, Sano K, Fukai K, et al. Standardized evaluation of diabetic retinopathy using artificial intelligence and its association with metabolic dysfunction-associated steatotic liver disease in Japan: A cross-sectional study. PLoS One 2024;19:e0315752.
13. Orfanidou M, Polyzos SA. Retinopathy in metabolic dysfunction-associated steatotic liver disease. Medicina 2025;61:38.