Determinants of low-grade inflammation and insulin resistance, and patterns of metformin use, in adults with prediabetes: a cross-sectional study from Mumbai, India.
- Mayur Mewada , Associate Professor, Department of General Medicine, K. J. Somaiya Medical College & Research Centre, Mumbai, Maharashtra, India
- Jitesh Katyura , Junior Resident, Department of General Medicine, K. J. Somaiya Medical College & Research Centre, Mumbai, Maharashtra, India
- Niharika Gill , Professor and Head, Department of General Medicine, K. J. Somaiya Medical College & Research Centre, Mumbai, Maharashtra, India
Article Information:
Abstract:
Background: Low-grade inflammation and insulin resistance link prediabetes to cardiovascular disease and to progression to diabetes. Their clinical determinants in Indian outpatients with prediabetes, and whether treatment choice reflects metabolic risk, are poorly described. Methods: Cross-sectional study of 180 consecutive adults with prediabetes (fasting plasma glucose [FPG] 100–125 mg/dL and HbA1c 5.7–6.4%) at a tertiary centre in Mumbai (October 2023–October 2025). We measured high-sensitivity C-reactive protein (hsCRP) and HOMA-IR, identified their determinants by multiple linear regression, and compared clinical profiles across management strategies: lifestyle modification alone, metformin alone, or both. Results: Mean hsCRP was 2.49 ± 0.69 mg/L; 45 participants (25.0%) had hsCRP >3 mg/L. hsCRP correlated with BMI (r = 0.65) and systolic blood pressure (BP) (r = 0.55), but not with FPG, HbA1c or lipids. BMI (β = 0.56) and systolic BP (β = 0.45) independently explained 59% of hsCRP variance. High hsCRP occurred in 34/78 (43.6%) obese participants with hypertension-range BP versus 1/57 (1.8%) non-obese participants. HOMA-IR (3.61 ± 0.57) was independently related to BMI, FPG, lower HDL-C and younger age. Metformin was prescribed to 88 (48.9%), including 37 (20.6%) without documented lifestyle advice. Age, BMI, FPG, HbA1c, HOMA-IR and hsCRP did not differ between treatment groups, and all four participants with BMI ≥35 kg/m² received lifestyle advice only. Conclusions: In prediabetes, low-grade inflammation was related to adiposity and BP rather than to glycaemia. Metformin was prescribed frequently but without apparent regard to metabolic risk or guideline criteria, which supports the adoption of risk-stratified treatment protocols.
Keywords:
Article :
INTRODUCTION:
Prediabetes is defined by a fasting plasma glucose (FPG) of 100–125 mg/dL, a 2-hour plasma glucose of 140–199 mg/dL or an HbA1c of 5.7–6.4% [1], and it marks people at high risk of type 2 diabetes [2]. Across 15 Indian states, 10.3% of adults had prediabetes by World Health Organization criteria [3]. The condition is also independently associated with higher all-cause mortality and cardiovascular disease [1,2].
Two closely linked processes are thought to explain much of this risk. One is chronic low-grade inflammation. Raised C-reactive protein predicts type 2 diabetes [4,5], and a high-sensitivity CRP (hsCRP) above 3 mg/L indicates high cardiovascular risk [6]. Much of this inflammation is thought to come from expanded adipose tissue [7]. The other is insulin resistance, which can be estimated in the clinic from fasting glucose and insulin. Indian studies have found higher hsCRP in people with prediabetes than in normoglycaemic controls [8–10]. Few, however, have asked which clinical features explain why hsCRP and insulin resistance vary among people who already have prediabetes. The answer has practical consequences. If hsCRP mainly mirrors glycaemia, it adds little to a glucose test; if it mirrors adiposity and blood pressure (BP), treatment priorities change.
A second question concerns treatment. Lifestyle modification and metformin both reduce progression to diabetes [11,12]. The American Diabetes Association recommends lifestyle intervention for everyone and suggests considering metformin for those at highest risk, especially people aged 25–59 years with BMI ≥35 kg/m², FPG ≥110 mg/dL and HbA1c ≥6.0% [13]. In the United States, metformin is seldom prescribed for prediabetes, even to people who meet these criteria [14,15]. In India, little is known about how often metformin is used in outpatient practice or whether its use follows metabolic risk.
We studied adults with prediabetes attending a tertiary care centre in Mumbai. Our aims were to describe hsCRP and insulin resistance (measured by HOMA-IR), to identify their independent clinical determinants, and to compare the clinical and metabolic profiles of patients according to the initial treatment chosen by their physicians. Lipid abnormalities, BP and risk factor clustering in the same patients are reported in a separate paper.
MATERIALS AND METHODS:
Design, setting and participants
This descriptive cross-sectional study is reported in line with the STROBE recommendations [16]. It was conducted in the general medicine outpatient department of K.J. Somaiya Medical College and Research Centre, Mumbai, from October 2023 to October 2025. Adults aged 18 years or older with prediabetes by American Diabetes Association criteria [1] were recruited consecutively. We excluded people with diagnosed type 1 or type 2 diabetes, pregnant women and those with severe comorbid illness. All 180 participants had both FPG (100–125 mg/dL) and HbA1c (5.7–6.4%) in the prediabetic range. The sample size of 180 was set for the parent study (160 participants plus 10% for non-response), which gives a 95% confidence interval no wider than ±7.3 percentage points for the proportions reported here.
Measurements
Age, sex and socioeconomic status (SES; low, middle or high, by family monthly income) were recorded on a structured form. BP was measured in the seated position after rest, and height and weight were measured to calculate body mass index (BMI). After an overnight fast, venous blood was taken for FPG, HbA1c, lipid profile, fasting insulin and hsCRP, all analysed in the hospital’s accredited laboratory. HOMA-IR was calculated as fasting insulin (µU/mL) × FPG (mg/dL) / 405 [17].
Definitions
hsCRP was classified by the AHA/CDC scheme as <1 mg/L (low), 1–3 mg/L (average) and >3 mg/L (high cardiovascular risk) [6]. Because published HOMA-IR thresholds for insulin resistance differ by age and sex even within a single population [18], HOMA-IR was analysed as a continuous variable and in tertiles. BMI was classified with the WHO Asia-Pacific cut-offs used in Indian population studies: normal <23, overweight 23–24.9 and obese ≥25 kg/m² [19]. BP was classified according to the 2018 ESC/ESH guideline as normal (<130/85 mmHg, combining the optimal and normal categories), high-normal (130–139/85–89 mmHg), grade 1 hypertension (140–159/90–99 mmHg) or grade 2 hypertension (≥160/100 mmHg), and BP ≥140/90 mmHg was defined as hypertension-range BP [20].
The management strategy advised at enrolment by the treating physician was recorded as lifestyle modification alone, metformin alone, or lifestyle modification plus metformin. Treatment was not allocated by protocol. To judge alignment with guidance, we recorded the high-risk features named in the American Diabetes Association recommendation on metformin: age 25–59 years, BMI ≥35 kg/m², FPG ≥110 mg/dL and HbA1c ≥6.0% [13].
Statistical analysis
Data from the case record forms were entered into a spreadsheet and checked for entry errors before analysis. Continuous data are shown as mean ± standard deviation, and categorical data as number (%). Groups were compared with Welch’s t-test, one-way ANOVA (with Kruskal–Wallis as a sensitivity check) and the χ² test. Correlations were assessed with Pearson and Spearman coefficients, with 95% CIs by Fisher’s z transformation.
Independent determinants of hsCRP and HOMA-IR were examined by multiple linear regression. Covariates were chosen a priori: age, sex, BMI, systolic and diastolic BP, FPG, HbA1c, triglycerides and HDL-C, with HOMA-IR in the hsCRP model and hsCRP in the HOMA-IR model. Multicollinearity was checked with variance inflation factors. Factors associated with hsCRP >3 mg/L were examined by logistic regression, with discrimination assessed by the area under the ROC curve (AUC). The BMI value best separating high from lower hsCRP was found by the Youden index, with a 95% CI for the AUC from 2,000 bootstrap samples. Factors associated with any metformin prescription were examined by logistic regression adjusted for age, sex, BMI, SES, FPG, HbA1c, HOMA-IR and hsCRP. Tests were two-sided, with p <0.05 considered significant.
Ethics
The Institutional Ethics Committee (Academic) of K.J. Somaiya Medical College and Hospital approved the study on 20 December 2023. All participants gave written informed consent.
RESULTS:
hsCRP distribution and participant characteristics
The 180 participants (93 women, 51.7%) had a mean age of 51.7 ± 15.8 years and mean BMI of 27.1 ± 3.7 kg/m² (Table 1). Mean hsCRP was 2.49 ± 0.69 mg/L (median 2.46, IQR 2.00–3.00; range 1.10–4.00). No participant had hsCRP <1 mg/L; 135 (75.0%) were in the average-risk range and 45 (25.0%; 95% CI 19.2–31.8) had hsCRP >3 mg/L.
Participants with high hsCRP had a higher BMI (30.4 vs 26.0 kg/m²), higher systolic BP (145.6 vs 130.2 mmHg) and slightly higher HOMA-IR (3.77 vs 3.55), all p ≤0.03. They did not differ in age, sex, SES, diastolic BP, FPG, HbA1c or any lipid measure. Of the 45 with high hsCRP, 44 (97.8%) were obese.
Table 1. Characteristics of participants, overall and by hsCRP category
|
Characteristic |
All (n = 180) |
hsCRP ≤3 mg/L (n = 135) |
hsCRP >3 mg/L (n = 45) |
p |
|
Age, years |
51.7 ± 15.8 |
52.0 ± 15.6 |
50.6 ± 16.3 |
0.610 |
|
Sex |
|
|
|
0.547 |
|
Female |
93 (51.7) |
72 (53.3) |
21 (46.7) |
|
|
Male |
87 (48.3) |
63 (46.7) |
24 (53.3) |
|
|
Socioeconomic status |
|
|
|
0.598 |
|
Low |
55 (30.6) |
40 (29.6) |
15 (33.3) |
|
|
Middle |
92 (51.1) |
68 (50.4) |
24 (53.3) |
|
|
High |
33 (18.3) |
27 (20.0) |
6 (13.3) |
|
|
BMI, kg/m² |
27.1 ± 3.7 |
26.0 ± 3.3 |
30.4 ± 3.0 |
<0.001 |
|
BMI category |
|
|
|
<0.001 |
|
Normal (<23) |
21 (11.7) |
21 (15.6) |
0 (0.0) |
|
|
Overweight (23–24.9) |
36 (20.0) |
35 (25.9) |
1 (2.2) |
|
|
Obese (≥25) |
123 (68.3) |
79 (58.5) |
44 (97.8) |
|
|
Systolic BP, mmHg |
134.0 ± 15.1 |
130.2 ± 13.8 |
145.6 ± 13.0 |
<0.001 |
|
Diastolic BP, mmHg |
84.3 ± 9.1 |
84.7 ± 9.2 |
83.2 ± 8.7 |
0.317 |
|
BP category (ESC/ESH 2018) |
|
|
|
0.016 |
|
Normal |
38 (21.1) |
34 (25.2) |
4 (8.9) |
|
|
High-normal |
33 (18.3) |
27 (20.0) |
6 (13.3) |
|
|
Grade 1 hypertension |
97 (53.9) |
68 (50.4) |
29 (64.4) |
|
|
Grade 2 hypertension |
12 (6.7) |
6 (4.4) |
6 (13.3) |
|
|
FPG, mg/dL |
113.3 ± 7.0 |
113.3 ± 7.1 |
113.4 ± 6.7 |
0.914 |
|
HbA1c, % |
6.05 ± 0.22 |
6.06 ± 0.22 |
6.03 ± 0.21 |
0.469 |
|
HOMA-IR |
3.61 ± 0.57 |
3.55 ± 0.57 |
3.77 ± 0.57 |
0.030 |
|
Total cholesterol, mg/dL |
196.2 ± 27.4 |
196.9 ± 27.4 |
194.2 ± 27.4 |
0.570 |
|
LDL-C, mg/dL |
117.0 ± 25.8 |
117.9 ± 25.7 |
114.2 ± 26.3 |
0.420 |
|
HDL-C, mg/dL |
45.2 ± 8.2 |
45.0 ± 8.1 |
45.9 ± 8.5 |
0.533 |
|
Triglycerides, mg/dL |
170.8 ± 40.8 |
170.8 ± 42.0 |
170.9 ± 37.3 |
0.980 |
|
hsCRP, mg/L |
2.49 ± 0.69 |
2.20 ± 0.51 |
3.39 ± 0.25 |
<0.001 |
Values are mean ± SD or n (%). p from Welch’s t-test or χ² test. No participant had hsCRP <1 mg/L.
Determinants of hsCRP
hsCRP correlated strongly with BMI (r = 0.65, 95% CI 0.55–0.72) and moderately with systolic BP (r = 0.55, 0.44–0.64), weakly with HOMA-IR (r = 0.18), and not with age, diastolic BP, FPG, HbA1c or lipids (Table 2). Each association with BMI and systolic BP held after accounting for the other (partial r = 0.65 and 0.56; Figure 1).
Mean hsCRP rose across BMI categories (1.84, 1.99 and 2.75 mg/L; p <0.001) and BP categories (2.13, 2.38, 2.63 and 2.89 mg/L from normal to grade 2; p <0.001). High hsCRP was found in none of 21 normal-weight participants, 1 of 36 overweight participants and 44 of 123 (35.8%) obese participants. Combining the two factors, high hsCRP affected 0 of 26 non-obese participants with lower BP, 1 of 31 (3.2%) non-obese with hypertension-range BP, 10 of 45 (22.2%) obese with lower BP and 34 of 78 (43.6%) obese with hypertension-range BP (Figure 2).
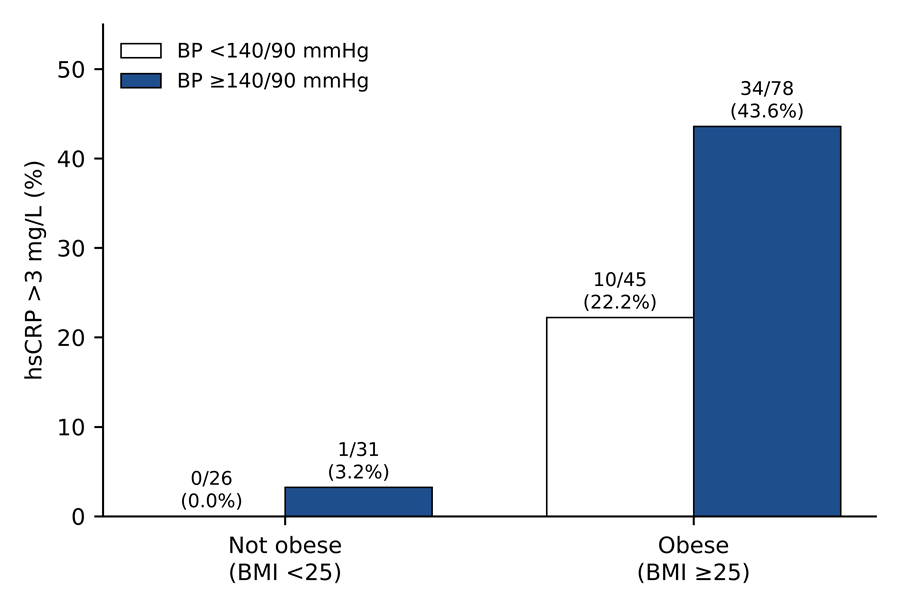
Figure 1. hsCRP against BMI in 180 adults with prediabetes. Filled points: BP ≥140/90 mmHg; open points: BP <140/90 mmHg. Dashed lines mark BMI 25 kg/m² and hsCRP 3 mg/L; the solid line is the least-squares fit.
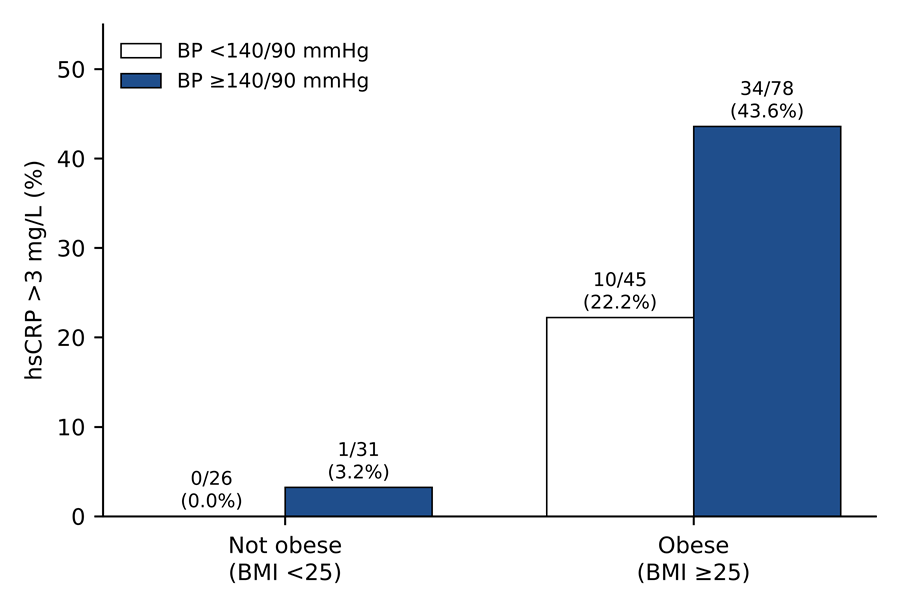
Figure 2. Proportion of participants with hsCRP >3 mg/L, by obesity (BMI ≥25 kg/m²) and blood pressure status (≥140/90 mmHg).
Table 2. Correlation of hsCRP and HOMA-IR with clinical and laboratory variables
|
Variable |
hsCRP: r (95% CI) |
p |
HOMA-IR: r (95% CI) |
p |
|
Age |
−0.03 (−0.18 to 0.11) |
0.650 |
−0.17 (−0.31 to −0.02) |
0.024 |
|
BMI |
0.65 (0.55 to 0.72) |
<0.001 |
0.29 (0.15 to 0.42) |
<0.001 |
|
Systolic BP |
0.55 (0.44 to 0.64) |
<0.001 |
0.09 (−0.05 to 0.24) |
0.219 |
|
Diastolic BP |
−0.08 (−0.23 to 0.06) |
0.272 |
−0.03 (−0.18 to 0.12) |
0.674 |
|
FPG |
−0.03 (−0.17 to 0.12) |
0.697 |
0.30 (0.16 to 0.43) |
<0.001 |
|
HbA1c |
0.00 (−0.15 to 0.14) |
0.961 |
−0.10 (−0.25 to 0.04) |
0.165 |
|
Total cholesterol |
0.04 (−0.11 to 0.18) |
0.612 |
−0.08 (−0.23 to 0.06) |
0.266 |
|
LDL-C |
0.03 (−0.12 to 0.17) |
0.736 |
−0.04 (−0.18 to 0.11) |
0.635 |
|
HDL-C |
−0.01 (−0.15 to 0.14) |
0.909 |
−0.17 (−0.31 to −0.03) |
0.022 |
|
Triglycerides |
0.06 (−0.09 to 0.20) |
0.426 |
0.01 (−0.14 to 0.16) |
0.898 |
|
HOMA-IR |
0.18 (0.04 to 0.32) |
0.013 |
— |
|
|
hsCRP |
— |
|
0.18 (0.04 to 0.32) |
0.013 |
Pearson correlation coefficients, n = 180. Spearman coefficients gave the same pattern.
In multiple regression, BMI (β = 0.56) and systolic BP (β = 0.45) were the only independent determinants of hsCRP (both p <0.001), and the model explained 59% of its variance (Table 3). Once BMI was included, HOMA-IR no longer contributed (p = 0.754). BMI alone explained 42% and systolic BP alone 30% of the variance; together they explained 60%. In logistic regression, the odds of hsCRP >3 mg/L rose 1.69-fold per kg/m² of BMI (95% CI 1.39–2.04) and 2.71-fold per 10 mmHg of systolic BP (1.81–4.05), independent of age, sex, HOMA-IR and HbA1c (AUC 0.91; Hosmer–Lemeshow p = 0.46). BMI alone discriminated high hsCRP with an AUC of 0.83 (95% CI 0.76–0.89); a BMI of 28.5 kg/m² gave 75.6% sensitivity and 77.8% specificity.
Determinants of insulin resistance
Mean HOMA-IR was 3.61 ± 0.57 (range 1.64–5.19); 176 participants (97.8%) exceeded the commonly used threshold of 2.5. HOMA-IR rose across BMI categories (3.14, 3.53 and 3.71; p <0.001) and was lower in those aged 60 or over (3.46 vs 3.72 under 45; p = 0.032). In regression, BMI (β = 0.32), FPG (β = 0.29), lower HDL-C (β = −0.18) and younger age (β = −0.16) were independently associated with HOMA-IR, which together explained 20% of its variance (Table 3). Across HOMA-IR tertiles, mean hsCRP was 2.35, 2.47 and 2.67 mg/L (p = 0.029), but this gradient disappeared after adjustment for BMI.
Table 3. Multiple linear regression: independent determinants of hsCRP and HOMA-IR
|
Variable |
hsCRP: B (95% CI) |
β |
p |
HOMA-IR: B (95% CI) |
β |
p |
|
Age (per year) |
−0.0042 (−0.0084 to 0.0001) |
−0.10 |
0.056 |
−0.0058 (−0.0107 to −0.0009) |
−0.16 |
0.021 |
|
Female sex |
−0.037 (−0.173 to 0.098) |
−0.03 |
0.585 |
0.008 (−0.149 to 0.165) |
0.01 |
0.923 |
|
BMI (per kg/m²) |
0.105 (0.085 to 0.124) |
0.56 |
<0.001 |
0.049 (0.021 to 0.077) |
0.32 |
<0.001 |
|
Systolic BP (per mmHg) |
0.0204 (0.0159 to 0.0249) |
0.45 |
<0.001 |
0.0007 (−0.0057 to 0.0070) |
0.02 |
0.837 |
|
Diastolic BP (per mmHg) |
0.0021 (−0.0052 to 0.0095) |
0.03 |
0.569 |
Not included |
|
|
|
FPG (per mg/dL) |
−0.0049 (−0.0149 to 0.0051) |
−0.05 |
0.332 |
0.0237 (0.0127 to 0.0348) |
0.29 |
<0.001 |
|
HbA1c (per 1%) |
0.087 (−0.215 to 0.390) |
0.03 |
0.569 |
−0.256 (−0.604 to 0.092) |
−0.10 |
0.149 |
|
Triglycerides (per mg/dL) |
0.0007 (−0.0009 to 0.0024) |
0.04 |
0.394 |
0.0007 (−0.0012 to 0.0026) |
0.05 |
0.445 |
|
HDL-C (per mg/dL) |
0.0011 (−0.0071 to 0.0093) |
0.01 |
0.796 |
−0.0124 (−0.0216 to −0.0031) |
−0.18 |
0.009 |
|
HOMA-IR (per unit) |
−0.021 (−0.152 to 0.110) |
−0.02 |
0.754 |
Not included |
|
|
|
hsCRP (per mg/L) |
Not included |
|
|
−0.027 (−0.203 to 0.149) |
−0.03 |
0.762 |
|
Adjusted R² |
0.59 |
|
F = 26.9, p <0.001 |
0.20 |
|
F = 6.0, p <0.001 |
B, unstandardised coefficient; β, standardised coefficient. All variance inflation factors ≤2.6.
Management strategy
Lifestyle modification alone was advised for 92 participants (51.1%), lifestyle plus metformin for 51 (28.3%) and metformin alone for 37 (20.6%); overall, 88 (48.9%) received metformin. The three groups did not differ in age, BMI, BP, FPG, HbA1c, HOMA-IR, hsCRP or lipids, or in the proportions with obesity, hypertension-range BP, high hsCRP or risk factor clustering (Table 4). Kruskal–Wallis tests gave the same results. In multivariable analysis, none of age, sex, BMI, SES, FPG, HbA1c, HOMA-IR or hsCRP was associated with receiving metformin (model p = 0.50; AUC 0.62).
No participant met all of the ADA high-risk features for metformin. The four participants with BMI ≥35 kg/m² all received lifestyle advice alone. Metformin was prescribed to 36 of 80 (45.0%) participants with both FPG ≥110 mg/dL and HbA1c ≥6.0%, and to 52 of 100 (52.0%) without both (p = 0.371). Metformin use was close to the overall rate of 48.9% in every subgroup examined (Figure 3).
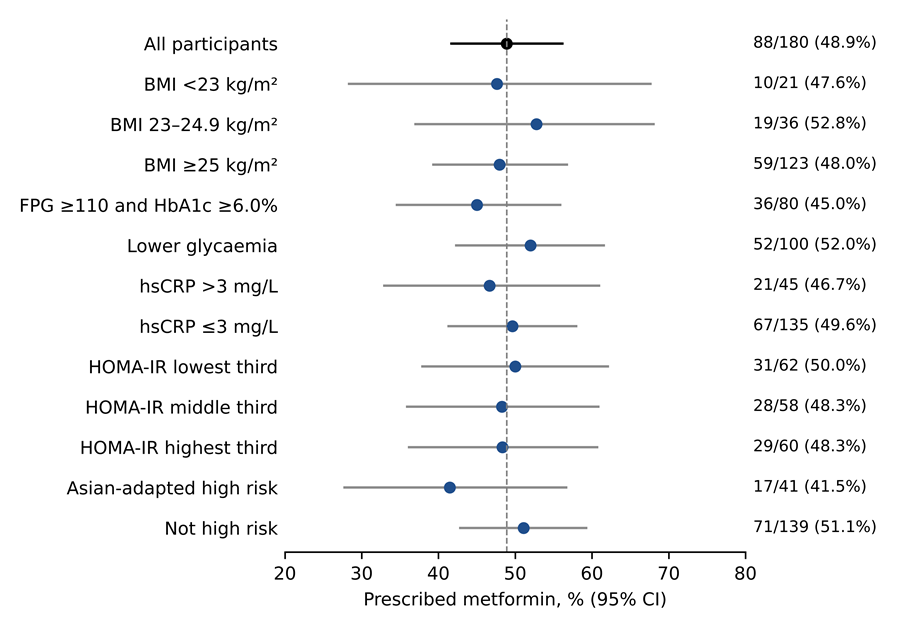
Figure 3. Proportion of participants prescribed metformin (alone or with lifestyle advice) across groups defined by BMI, glycaemia, hsCRP, HOMA-IR and an Asian-adapted high-risk definition (age <60 years, BMI ≥25 kg/m², FPG ≥110 mg/dL and HbA1c ≥6.0%). Bars show Wilson 95% confidence intervals; the dashed line marks the overall rate.
Table 4. Clinical and laboratory profile by initial management strategy
|
Variable |
Lifestyle only (n = 92) |
Metformin only (n = 37) |
Lifestyle + metformin (n = 51) |
p |
|
Age, years |
52.1 ± 15.2 |
49.5 ± 16.9 |
52.5 ± 16.2 |
0.630 |
|
BMI, kg/m² |
27.4 ± 4.0 |
27.3 ± 3.1 |
26.6 ± 3.6 |
0.545 |
|
Systolic BP, mmHg |
134.8 ± 15.1 |
130.0 ± 14.0 |
135.6 ± 15.9 |
0.186 |
|
FPG, mg/dL |
112.8 ± 6.6 |
112.8 ± 7.6 |
114.6 ± 7.2 |
0.306 |
|
HbA1c, % |
6.05 ± 0.22 |
6.05 ± 0.23 |
6.04 ± 0.22 |
0.976 |
|
HOMA-IR |
3.61 ± 0.59 |
3.63 ± 0.58 |
3.57 ± 0.54 |
0.852 |
|
hsCRP, mg/L |
2.53 ± 0.67 |
2.42 ± 0.61 |
2.48 ± 0.78 |
0.679 |
|
LDL-C, mg/dL |
121.0 ± 25.8 |
114.3 ± 23.6 |
111.7 ± 26.6 |
0.091 |
|
Triglycerides, mg/dL |
170.1 ± 41.1 |
168.1 ± 39.0 |
174.0 ± 42.0 |
0.780 |
|
Women |
43 (46.7) |
17 (45.9) |
33 (64.7) |
0.088 |
|
Obese (BMI ≥25) |
64 (69.6) |
27 (73.0) |
32 (62.7) |
0.557 |
|
BMI ≥35 kg/m² |
4 (4.3) |
0 (0.0) |
0 (0.0) |
0.141* |
|
BP ≥140/90 mmHg |
55 (59.8) |
20 (54.1) |
34 (66.7) |
0.478 |
|
FPG ≥110 mg/dL |
64 (69.6) |
20 (54.1) |
36 (70.6) |
0.187 |
|
HbA1c ≥6.0% |
60 (65.2) |
24 (64.9) |
34 (66.7) |
0.980 |
|
FPG ≥110 and HbA1c ≥6.0% |
44 (47.8) |
11 (29.7) |
25 (49.0) |
0.129 |
|
hsCRP >3 mg/L |
24 (26.1) |
6 (16.2) |
15 (29.4) |
0.348 |
|
Clustering (≥3 risk factors) |
48 (52.2) |
24 (64.9) |
29 (56.9) |
0.419 |
Values are mean ± SD or n (%). p from one-way ANOVA or χ² test. *Expected count <5 in at least one cell; interpret with caution. Clustering: ≥3 of BMI ≥25 kg/m², BP ≥130/85 mmHg, triglycerides ≥150 mg/dL and sex-specific low HDL-C.
DISCUSSION:
In our patients with prediabetes, every participant had an hsCRP of at least 1 mg/L, and one in four had a value above 3 mg/L. BMI and systolic BP together explained 60% of the variation in hsCRP; FPG, HbA1c and lipids explained none of it. Insulin resistance was almost universal and was related to BMI, FPG and low HDL-C. Nearly half the patients were given metformin, but whether they received it had nothing to do with their adiposity, glycaemia, insulin resistance or inflammation.
Our mean hsCRP of 2.49 mg/L is close to values from other Indian prediabetes studies: a mean of 2.17 mg/L in rural central India [10], and medians of 2.20 and 2.32 mg/L in people with impaired fasting glucose and impaired glucose tolerance in a large north Indian study [8]. The north Indian study also found hsCRP to be independently associated with both conditions compared with normoglycaemia [8], and a clinic-based study from China reported a similar association across BMI strata [21]. Our results add a further point. Once a person has prediabetes, the variation in hsCRP reflects adiposity and BP, not how high the glucose is.
The strong link with BMI is consistent with a large body of evidence. A meta-analysis of 51 cross-sectional studies found higher CRP with obesity in every population examined, although the association was stronger in women and in North American and European populations [22]. CRP is also raised in overweight and obese adults in the general population [23]. Expanded adipose tissue releases inflammatory cytokines such as tumour necrosis factor-α and interleukin-6 [7], and interleukin-6 is the main driver of CRP production in the liver [4]. The independent association with systolic BP fits with the Women’s Health Study, in which raised CRP predicted new hypertension [24]. Low-grade inflammation, endothelial dysfunction and arterial stiffening probably feed into one another. The weak correlation between hsCRP and HOMA-IR disappeared once BMI was taken into account, which suggests that adiposity drives both.
Clinically, this means hsCRP adds relatively little to BMI and BP in people with prediabetes. Only 1 of 57 non-obese participants had hsCRP above 3 mg/L, compared with 43.6% of obese participants with hypertension-range BP, and a BMI of about 28.5 kg/m² separated high from lower hsCRP reasonably well. Where hsCRP testing is not easily available, weight and BP can serve as practical stand-ins when assessing inflammation-related cardiovascular risk.
Mean HOMA-IR was 3.61, and 97.8% of participants were above the commonly used threshold of 2.5. A cut-off that nearly everyone exceeds is of little use for telling patients apart, and population-based thresholds differ by age and sex even within a single population [18]. HOMA-IR also has well-known limitations, because it rests on a single fasting sample [17]. The independent determinants we found (BMI, FPG, lower HDL-C and younger age) make biological sense, although the link with FPG is partly built into the formula. Low HDL-C and high triglycerides go along with insulin resistance, and the triglyceride/HDL-C ratio has been tested as a surrogate marker. In one study it worked acceptably in white adults but poorly in African American adults [25], a reminder that lipid-based cut-offs may not transfer between ethnic groups. Even so, the inverse relation between HOMA-IR and HDL-C in our patients fits an insulin-resistant profile.
Metformin was prescribed to 48.9% of our patients. This is far more than in the United States, where insurance and population data show use in 3.7% and in fewer than 1% of people with prediabetes, respectively [14,15]. A high prescribing rate is not a problem in itself, because metformin reduces progression to diabetes, including in Asian Indians [12]. The striking finding is that it did not seem to be targeted. Patients in the three treatment groups were metabolically alike. The four participants with BMI ≥35 kg/m² all received lifestyle advice only, and those with both FPG ≥110 mg/dL and HbA1c ≥6.0% were no more likely than others to receive metformin. The ADA threshold of 35 kg/m² [13] comes largely from non-Asian populations and is seldom reached by Indians with prediabetes, so we also looked at an Asian-adapted high-risk group (age <60 years, BMI ≥25 kg/m², FPG ≥110 mg/dL and HbA1c ≥6.0%). Metformin was given to 17 of these 41 participants (41.5%) and to 71 of the other 139 (51.1%) (p = 0.29). Again, prescribing did not favour those at higher risk.
One patient in five was given metformin without any recorded lifestyle advice. Structured lifestyle change is the foundation of diabetes prevention [13]. In the Diabetes Prevention Program, lifestyle intervention lowered the incidence of diabetes more than metformin over 10 years of follow-up [11], and the benefit was still present at 15 years [26]. A simple, risk-based protocol could help in Indian outpatient clinics: lifestyle counselling for every patient, and metformin kept for those at greatest risk.
Strengths and limitations
The study's strengths are consecutive recruitment, prediabetes confirmed by both FPG and HbA1c, analysis of individual patient data with multivariable models checked for collinearity, and a direct comparison of prescribing with guideline criteria. There are also limitations. As a cross-sectional, single-centre study, it cannot establish cause and effect, and the results may not apply elsewhere. hsCRP and insulin were each measured only once, and we did not systematically record acute illness at the time of sampling. We had no data on waist circumference, smoking or physical activity. Nor did we record the reasons for individual prescribing decisions, what lifestyle advice was given, or whether patients took their treatment, so our findings describe how metformin was prescribed rather than whether each decision was right for that patient. Finally, there was no normoglycaemic comparison group.
CONCLUSION:
In adults with prediabetes, low-grade inflammation depended mainly on adiposity and systolic BP rather than on glycaemia, and insulin resistance was almost universal. Nearly half the patients received metformin, but its use was unrelated to BMI, glycaemia, insulin resistance or inflammation, and one in five received it without lifestyle advice. Weight reduction and BP control should be priorities in caring for people with prediabetes, and Indian outpatient practice would benefit from risk-based treatment protocols. Prospective studies should test whether such protocols improve outcomes.
REFERENCES:
1. Echouffo-Tcheugui JB, Perreault L, Ji L, Dagogo-Jack S. Diagnosis and management of prediabetes: a review. JAMA. 2023;329(14):1206–16. doi:10.1001/jama.2023.4063
2. Echouffo-Tcheugui JB, Selvin E. Prediabetes and what it means: the epidemiological evidence. Annu Rev Public Health. 2021;42:59–77. doi:10.1146/annurev-publhealth-090419-102644
3. Anjana RM, Deepa M, Pradeepa R, Mahanta J, Narain K, Das HK, et al. Prevalence of diabetes and prediabetes in 15 states of India: results from the ICMR–INDIAB population-based cross-sectional study. Lancet Diabetes Endocrinol. 2017;5(8):585–96. doi:10.1016/S2213-8587(17)30174-2
4. Pradhan AD, Manson JE, Rifai N, Buring JE, Ridker PM. C-reactive protein, interleukin 6, and risk of developing type 2 diabetes mellitus. JAMA. 2001;286(3):327–34.
5. Wang X, Bao W, Liu J, OuYang YY, Wang D, Rong S, et al. Inflammatory markers and risk of type 2 diabetes: a systematic review and meta-analysis. Diabetes Care. 2013;36(1):166–75. doi:10.2337/dc12-0702
6. Pearson TA, Mensah GA, Alexander RW, Anderson JL, Cannon RO 3rd, Criqui M, et al. Markers of inflammation and cardiovascular disease: application to clinical and public health practice: a statement for healthcare professionals from the Centers for Disease Control and Prevention and the American Heart Association. Circulation. 2003;107(3):499–511.
7. Hotamisligil GS. Inflammation and metabolic disorders. Nature. 2006;444(7121):860–7.
8. Jaiswal A, Tabassum R, Podder A, Ghosh S, Tandon N, Bharadwaj D. Elevated level of C-reactive protein is associated with risk of prediabetes in Indians. Atherosclerosis. 2012;222(2):495–501.
9. Sabanayagam C, Shankar A, Lim SC, Lee J, Tai ES, Wong TY. Serum C-reactive protein level and prediabetes in two Asian populations. Diabetologia. 2011;54(4):767–75. doi:10.1007/s00125-011-2052-5
10. Ghule A, Kamble TK, Talwar D, Kumar S, Acharya S, Wanjari A, et al. Association of serum high sensitivity C-reactive protein with pre-diabetes in rural population: a two-year cross-sectional study. Cureus. 2021;13(10):e19088. doi:10.7759/cureus.19088
11. Diabetes Prevention Program Research Group; Knowler WC, Fowler SE, Hamman RF, Christophi CA, Hoffman HJ, Brenneman AT, et al. 10-year follow-up of diabetes incidence and weight loss in the Diabetes Prevention Program Outcomes Study. Lancet. 2009;374(9702):1677–86.
12. Hostalek U, Gwilt M, Hildemann S. Therapeutic use of metformin in prediabetes and diabetes prevention. Drugs. 2015;75(10):1071–94. doi:10.1007/s40265-015-0416-8
13. American Diabetes Association Professional Practice Committee. 3. Prevention or delay of diabetes and associated comorbidities: Standards of Care in Diabetes—2025. Diabetes Care. 2025;48(Suppl 1):S50–S58. doi:10.2337/dc25-S003
14. Moin T, Li J, Duru OK, Ettner S, Turk N, Keckhafer A, et al. Metformin prescription for insured adults with prediabetes from 2010 to 2012: a retrospective cohort study. Ann Intern Med. 2015;162(8):542–8. doi:10.7326/M14-1773
15. Tseng E, Yeh HC, Maruthur NM. Metformin use in prediabetes among U.S. adults, 2005–2012. Diabetes Care. 2017;40(7):887–93. doi:10.2337/dc16-1509
16. Vandenbroucke JP, von Elm E, Altman DG, Gøtzsche PC, Mulrow CD, Pocock SJ, et al. Strengthening the Reporting of Observational Studies in Epidemiology (STROBE): explanation and elaboration. PLoS Med. 2007;4(10):e297.
17. Wallace TM, Levy JC, Matthews DR. Use and abuse of HOMA modeling. Diabetes Care. 2004;27(6):1487–95.
18. Gayoso-Diz P, Otero-González A, Rodriguez-Alvarez MX, Gude F, García F, De Francisco A, et al. Insulin resistance (HOMA-IR) cut-off values and the metabolic syndrome in a general adult population: effect of gender and age: EPIRCE cross-sectional study. BMC Endocr Disord. 2013;13:47. doi:10.1186/1472-6823-13-47
19. Pradeepa R, Anjana RM, Joshi SR, Bhansali A, Deepa M, Joshi PP, et al. Prevalence of generalized & abdominal obesity in urban & rural India – the ICMR-INDIAB Study (Phase-I) [ICMR-INDIAB-3]. Indian J Med Res. 2015;142(2):139–50. doi:10.4103/0971-5916.164234
20. Williams B, Mancia G, Spiering W, Agabiti Rosei E, Azizi M, Burnier M, et al. 2018 ESC/ESH Guidelines for the management of arterial hypertension. Eur Heart J. 2018;39(33):3021–104.
21. Lin J, Zhang M, Song F, et al. Association between C-reactive protein and pre-diabetic status in a Chinese Han clinical population. Diabetes Metab Res Rev. 2009;25(3):219–23. doi:10.1002/dmrr.923
22. Choi J, Joseph L, Pilote L. Obesity and C-reactive protein in various populations: a systematic review and meta-analysis. Obes Rev. 2013;14(3):232–44.
23. Visser M, Bouter LM, McQuillan GM, Wener MH, Harris TB. Elevated C-reactive protein levels in overweight and obese adults. JAMA. 1999;282(22):2131–5.
24. Sesso HD, Buring JE, Rifai N, Blake GJ, Gaziano JM, Ridker PM. C-reactive protein and the risk of developing hypertension. JAMA. 2003;290(22):2945–51.
25. Kim-Dorner SJ, Deuster PA, Zeno SA, Remaley AT, Poth M. Should triglycerides and the triglycerides to high-density lipoprotein cholesterol ratio be used as surrogates for insulin resistance? Metabolism. 2010;59(2):299–304. doi:10.1016/j.metabol.2009.07.027
26. Diabetes Prevention Program Research Group. Long-term effects of lifestyle intervention or metformin on diabetes development and microvascular complications over 15-year follow-up: the Diabetes Prevention Program Outcomes Study. Lancet Diabetes Endocrinol. 2015;3(11):866–75.