Smartphone Addiction and Its Association With Anxiety, Depression And Sleep Quality Among Young Adults In Chennai
- Arunkumar Shanmugasundaram , Associate Professor, Department of Psychiatry, Tagore Medical College and Research Institute, Chennai, Tamil Nadu, India
- Bharathy Sundar , Assistant Professor, Department of Psychiatry, Tagore Medical College and Hospital, Chennai, Tamil Nadu, India
- Rizvia. A , Senior Resident, Department of Psychiatry, Tagore Medical College and Hospital, Chennai, Tamil Nadu, India
Article Information:
Abstract:
Background: Smartphone addiction represents an emerging digital mental health concern among young adults globally. In India, limited research exists on smartphone addiction patterns and their associations with psychiatric comorbidities using validated instruments. Understanding these relationships is crucial for developing targeted interventions in the digital age. Objective: To determine the prevalence of smartphone addiction among young adults in Chennai, examine associations with anxiety, depression, and sleep quality, assess behavioral patterns and daily functioning impact, and identify independent predictors through multivariate analysis. Methods: A cross-sectional study was conducted among 542 young adults aged 18-30 years from colleges, IT companies, and community settings in Chennai during September to October 2025. Smartphone addiction was assessed using Smartphone Addiction Scale-Short Version. Depression, anxiety, and sleep quality were evaluated using validated instruments. Statistical analysis included chi-square test, t-test, correlation, and multiple logistic regression. Results: Overall smartphone addiction prevalence was 39.3%. Female participants showed higher prevalence than males. Depression and anxiety were significantly higher among addicted individuals. Poor sleep quality affected majority of addicted users. Daily usage time emerged as the strongest predictor, followed by social media primary use, poor sleep quality, younger age, and presence of depression and anxiety. Only a small proportion sought professional help. Conclusion Smartphone addiction among Chennai young adults demonstrates alarmingly high prevalence with significant psychiatric comorbidities and functional impairment. The strong bidirectional relationships with mental health problems and critically low help-seeking behavior necessitate comprehensive digital mental health interventions and accessible behavioral addiction services.
Keywords:
Article :
Introduction:
Smartphone addiction, also termed problematic smartphone use, represents an emerging behavioral addiction characterized by compulsive use, tolerance, withdrawal symptoms, and functional impairment.¹ With global smartphone penetration exceeding 6.8 billion users and average daily usage reaching 4-6 hours, smartphone addiction has emerged as a significant public health concern, particularly among young adults.²
International studies report smartphone addiction prevalence ranging from 25-50% among young adults, with significant variations across cultures and measurement tools.³,⁴ In India, smartphone users increased from 298 million in 2017 to over 829 million in 2024, with young adults representing the highest usage demographic.⁵ However, systematic research on smartphone addiction patterns and psychiatric correlates remains limited.
Smartphone addiction frequently co-occurs with mental health disorders. Studies have documented strong bidirectional associations with depression, anxiety, and sleep disturbances.⁶,⁷ Excessive smartphone use, particularly before bedtime, disrupts circadian rhythms and melatonin secretion, leading to poor sleep quality.⁸ The constant connectivity, social comparison on social media, fear of missing out, and information overload contribute to anxiety and depressive symptoms.⁹
Chennai, as a major IT hub and educational center in South India, has high smartphone penetration among young adults. This study aimed to determine smartphone addiction prevalence among young adults in Chennai, examine associations with anxiety, depression, and sleep quality using validated instruments, assess usage patterns and functional impairment, and identify independent predictors to inform digital mental health strategies
Materials and Methods:
This cross-sectional study was conducted at Tagore Medical College and Hospital, Chennai, in collaboration with educational institutions, IT companies, and community settings during September to October 2025. The study targeted young adults aged 18-30 years representing diverse occupational backgrounds. Sample size was calculated with expected smartphone addiction prevalence of 35% and 4% precision, yielding 547 participants. Using stratified random sampling by occupation, 580 individuals were approached and 542 completed questionnaires, achieving a response rate of 93.4%.
Smartphone addiction was assessed using Smartphone Addiction Scale-Short Version, a 10-item validated scale with cut-off scores ≥31 for males and ≥33 for females.¹⁰ Depression was measured using Patient Health Questionnaire-9 with cut-off ≥10.¹¹ Anxiety was assessed using Generalized Anxiety Disorder-7 with cut-off ≥10.¹² Sleep quality was evaluated using Pittsburgh Sleep Quality Index, with scores greater than 5 indicating poor sleep.¹³ Detailed smartphone usage patterns including daily duration, timing, purposes, and behavioral indicators were recorded. After ethical clearance from Institutional Ethics Committee, Tagore Medical College, questionnaires were administered with informed consent ensuring confidentiality.
Data were analyzed using SPSS version 26.0. Descriptive statistics, chi-square test, independent t-test, Pearson correlation, and multiple logistic regression were performed. Effect sizes were calculated and reported as Cohen's d for continuous variables and odds ratios with 95% confidence intervals for categorical associations. Model fit was assessed using Hosmer-Lemeshow test and ROC curve analysis. Statistical significance was set at p<0.05.
Results:
A total of 580 young adults aged 18-30 years were approached and 542 completed the comprehensive questionnaire, yielding a response rate of 93.4%. The mean age of participants was 23.8 ± 3.4 years. Male participants constituted 52.4% and female participants 47.6%. Overall smartphone addiction prevalence was 39.3%, with mild addiction in 21.8%, moderate addiction in 13.1%, and severe addiction in 4.4%. Mean daily smartphone usage was 6.8 ± 3.2 hours.
Table 1: Demographic Characteristics and Smartphone Addiction Prevalence (N=542)
|
Variable |
Category |
n (%) |
Addiction n (%) |
Mean SAS-SV ± SD |
Test Statistic |
p-value |
|
Gender |
|
|
|
|
χ²=8.34 |
0.004 |
|
|
Male |
284 (52.4) |
98 (34.5) |
29.2 ± 11.8 |
|
|
|
|
Female |
258 (47.6) |
115 (44.6) |
32.6 ± 12.8 |
|
|
|
Age Group |
|
|
|
|
χ²=12.67 |
0.002 |
|
|
18-21 years |
198 (36.5) |
92 (46.5) |
33.4 ± 12.2 |
|
|
|
|
22-25 years |
224 (41.3) |
86 (38.4) |
30.8 ± 12.1 |
|
|
|
|
26-30 years |
120 (22.1) |
35 (29.2) |
27.2 ± 11.9 |
|
|
|
Occupation |
|
|
|
|
χ²=18.92 |
<0.001 |
|
|
College students |
232 (42.8) |
108 (46.6) |
33.2 ± 12.4 |
|
|
|
|
IT professionals |
191 (35.2) |
72 (37.7) |
30.4 ± 12.1 |
|
|
|
|
Others |
119 (22.0) |
33 (27.7) |
26.8 ± 11.6 |
|
|
|
Education |
|
|
|
|
χ²=14.23 |
0.001 |
|
|
Undergraduate |
186 (34.3) |
86 (46.2) |
32.8 ± 12.6 |
|
|
|
|
Graduate |
248 (45.8) |
94 (37.9) |
30.2 ± 12.0 |
|
|
|
|
Postgraduate |
108 (19.9) |
33 (30.6) |
28.4 ± 11.8 |
|
|
|
Living |
|
|
|
|
χ²=9.78 |
0.002 |
|
|
With family |
368 (67.9) |
132 (35.9) |
29.6 ± 12.1 |
|
|
|
|
Hostel/PG |
128 (23.6) |
61 (47.7) |
33.8 ± 12.6 |
|
|
|
|
Alone |
46 (8.5) |
20 (43.5) |
32.4 ± 12.8 |
|
|
|
SES |
|
|
|
|
χ²=3.42 |
0.181 |
|
|
Upper/Upper middle |
208 (38.4) |
86 (41.3) |
31.4 ± 12.6 |
|
|
|
|
Middle |
268 (49.4) |
102 (38.1) |
30.6 ± 12.2 |
|
|
|
|
Lower middle/Lower |
66 (12.2) |
25 (37.9) |
29.8 ± 12.4 |
|
|
|
Relationship |
|
|
|
|
χ²=12.34 |
<0.001 |
|
|
Single |
342 (63.1) |
148 (43.3) |
31.8 ± 12.6 |
|
|
|
|
In relationship |
164 (30.3) |
58 (35.4) |
29.6 ± 11.9 |
|
|
|
|
Married |
36 (6.6) |
7 (19.4) |
24.8 ± 10.2 |
|
|
*p<0.05; SAS-SV: Smartphone Addiction Scale-Short Version
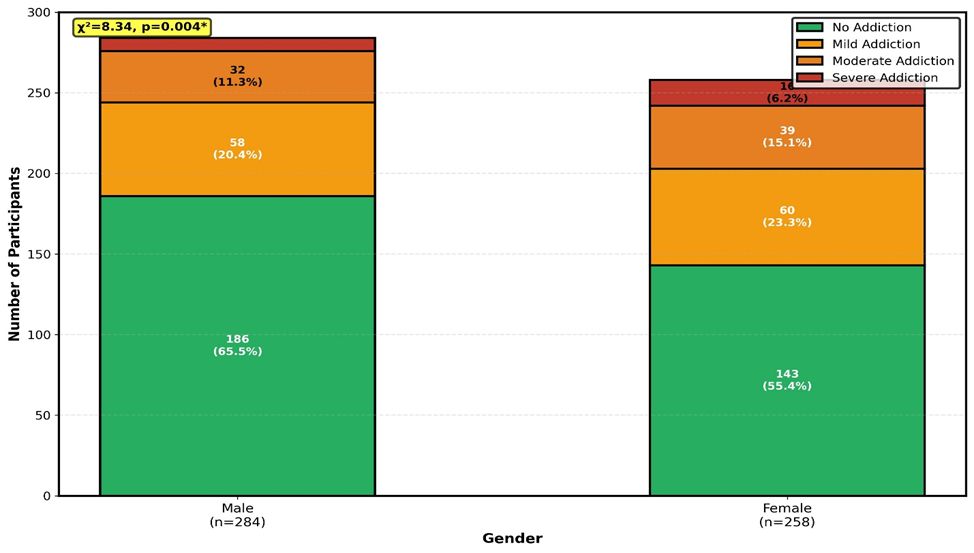
Table 1 demonstrates female students showed significantly higher smartphone addiction prevalence (44.6% vs 34.5%, χ²=8.34, p=0.004). Younger age group (18-21 years) showed highest prevalence (46.5%), progressively declining with age. College students had highest addiction rates (46.6%), followed by IT professionals (37.7%). Those living in hostels showed significantly higher addiction (47.7%) compared to those living with family (35.9%, p=0.002). Single individuals had higher addiction rates (43.3%) compared to married individuals (19.4%, p<0.001).
The mean daily smartphone usage time among addicted participants was significantly higher (9.4 ± 2.8 hours vs 5.1 ± 2.4 hours, t=16.78, p<0.001, Cohen's d=1.71). First smartphone use occurred at mean age 16.4 ± 3.2 years, with younger age of first use strongly associated with higher addiction scores (r=-0.286, p<0.001). Night-time usage after midnight was reported by 72.3% of addicted users versus 38.4% of non-addicted users (OR=5.23, p<0.001). Wake-up checking within five minutes was present in 67.6% of addicted users versus 28.4% of non-addicted users (OR=5.23, p<0.001).
Table 2: Smartphone Usage Patterns and Addiction Severity (N=542)
|
Usage Pattern |
Total |
No Addiction |
Mild |
Moderate |
Severe |
F/χ² |
p-value |
|
Daily Usage (hours) |
|
|
|
|
|
F=186.45 |
<0.001 |
|
<4 hours |
102 (18.8) |
98 (29.8) |
4 (3.4) |
0 (0) |
0 (0) |
||
|
4-6 hours |
156 (28.8) |
138 (41.9) |
18 (15.3) |
0 (0) |
0 (0) |
||
|
7-9 hours |
184 (33.9) |
78 (23.7) |
72 (61.0) |
28 (39.4) |
6 (25.0) |
||
|
10-12 hours |
76 (14.0) |
12 (3.6) |
20 (16.9) |
32 (45.1) |
12 (50.0) |
||
|
>12 hours |
24 (4.4) |
3 (0.9) |
4 (3.4) |
11 (15.5) |
6 (25.0) |
||
|
Mean ± SD |
6.8±3.2 |
5.1±2.4 |
8.2±2.1 |
10.1±2.4 |
12.4±2.8 |
||
|
Primary Purposes |
|
|
|
|
|
|
|
|
Social media |
486 (89.7) |
278 (84.5) |
110 (93.2) |
70 (98.6) |
24 (100) |
23.45 |
<0.001 |
|
Messaging |
502 (92.6) |
298 (90.6) |
108 (91.5) |
70 (98.6) |
24 (100) |
12.34 |
0.006 |
|
Entertainment |
428 (79.0) |
234 (71.1) |
96 (81.4) |
68 (95.8) |
24 (100) |
34.56 |
<0.001 |
|
Gaming |
268 (49.4) |
118 (35.9) |
66 (55.9) |
56 (78.9) |
24 (100) |
56.78 |
<0.001 |
|
Work/study |
346 (63.8) |
228 (69.3) |
76 (64.4) |
37 (52.1) |
5 (20.8) |
18.92 |
<0.001 |
|
Usage Timing |
|
|
|
|
|
|
|
|
Wake-up check <5 min |
235 (43.4) |
93 (28.3) |
64 (54.2) |
56 (78.9) |
22 (91.7) |
78.45 |
<0.001 |
|
During meals |
378 (69.7) |
198 (60.2) |
92 (78.0) |
64 (90.1) |
24 (100) |
42.31 |
<0.001 |
|
While walking |
298 (55.0) |
146 (44.4) |
72 (61.0) |
58 (81.7) |
22 (91.7) |
48.67 |
<0.001 |
|
Before sleep |
448 (82.7) |
248 (75.4) |
104 (88.1) |
70 (98.6) |
24 (100) |
34.56 |
<0.001 |
|
Post-midnight |
288 (53.1) |
126 (38.3) |
72 (61.0) |
60 (84.5) |
24 (100) |
62.45 |
<0.001 |
|
Behavioral Indicators |
|
|
|
|
|
|
|
|
Phantom vibrations |
342 (63.1) |
158 (48.0) |
84 (71.2) |
68 (95.8) |
24 (100) |
56.78 |
<0.001 |
|
Nomophobia |
268 (49.4) |
98 (29.8) |
76 (64.4) |
66 (93.0) |
24 (100) |
98.76 |
<0.001 |
|
Tolerance |
234 (43.2) |
72 (21.9) |
68 (57.6) |
66 (93.0) |
24 (100) |
112.34 |
<0.001 |
|
Withdrawal |
186 (34.3) |
42 (12.8) |
56 (47.5) |
62 (87.3) |
22 (91.7) |
134.56 |
<0.001 |
Note: Values are n (%) unless specified; p<0.05 considered significant
Depression was present in 52.6% of smartphone-addicted individuals compared to 22.8% of non-addicted individuals (χ²=52.34, p<0.001, OR=3.76, 95% CI: 2.68-5.28). Mean PHQ-9 scores were significantly higher in the addicted group (12.4 ± 5.8 vs 6.8 ± 4.6, t=11.24, p<0.001, Cohen's d=1.09). Anxiety was present in 48.4% of addicted individuals versus 19.8% of non-addicted (χ²=48.92, p<0.001, OR=3.84, 95% CI: 2.72-5.43). Mean GAD-7 scores were 11.2 ± 5.6 in addicted group versus 6.2 ± 4.4 in non-addicted group (t=10.56, p<0.001, Cohen's d=1.02). Co-occurring depression and anxiety affected 36.6% of addicted users versus 11.6% of non-addicted (OR=4.42, p<0.001).
Table 3: Psychiatric Comorbidities and Sleep Quality (N=542)
|
Mental Health Indicator |
Addicted (n=213) |
Non-addicted (n=329) |
Test Statistic |
p-value |
OR/Effect Size |
|
Depression (PHQ-9≥10) |
112 (52.6) |
75 (22.8) |
χ²=52.34 |
<0.001 |
OR=3.76 (2.68-5.28) |
|
Mean PHQ-9 score ± SD |
12.4 ± 5.8 |
6.8 ± 4.6 |
t=11.24 |
<0.001 |
d=1.09 |
|
Minimal (0-4) |
28 (13.1) |
168 (51.1) |
|
|
|
|
Mild (5-9) |
73 (34.3) |
86 (26.1) |
|
|
|
|
Moderate (10-14) |
64 (30.0) |
52 (15.8) |
|
|
|
|
Moderately severe (15-19) |
36 (16.9) |
19 (5.8) |
|
|
|
|
Severe (20-27) |
12 (5.6) |
4 (1.2) |
|
|
|
|
Anxiety (GAD-7≥10) |
103 (48.4) |
65 (19.8) |
χ²=48.92 |
<0.001 |
OR=3.84 (2.72-5.43) |
|
Mean GAD-7 score ± SD |
11.2 ± 5.6 |
6.2 ± 4.4 |
t=10.56 |
<0.001 |
d=1.02 |
|
Minimal (0-4) |
32 (15.0) |
176 (53.5) |
|
|
|
|
Mild (5-9) |
78 (36.6) |
88 (26.7) |
|
|
|
|
Moderate (10-14) |
68 (31.9) |
48 (14.6) |
|
|
|
|
Severe (15-21) |
35 (16.4) |
17 (5.2) |
|
|
|
|
Co-occurring Depression+Anxiety |
78 (36.6) |
38 (11.6) |
χ²=48.67 |
<0.001 |
OR=4.42 (2.84-6.88) |
|
Stress (PSS-10) |
|
|
|
|
|
|
Mean PSS-10 score |
24.8 ± 7.2 |
17.6 ± 6.4 |
t=11.34 |
<0.001 |
d=1.08 |
|
High stress (≥27) |
86 (40.4) |
62 (18.8) |
χ²=32.45 |
<0.001 |
OR=2.92 (1.98-4.31) |
|
Sleep Quality |
|
|
|
|
|
|
Poor sleep (PSQI>5) |
168 (78.9) |
162 (49.2) |
χ²=48.67 |
<0.001 |
OR=3.86 (2.65-5.63) |
|
Mean PSQI score |
9.2 ± 3.6 |
5.8 ± 2.8 |
t=11.78 |
<0.001 |
d=1.07 |
|
Sleep duration (hours) |
5.8 ± 1.4 |
7.2 ± 1.2 |
t=11.56 |
<0.001 |
d=1.11 |
|
Sleep latency >30 min |
148 (69.5) |
118 (35.9) |
χ²=58.92 |
<0.001 |
OR=4.05 (2.84-5.77) |
|
Night awakenings ≥3 |
134 (62.9) |
96 (29.2) |
χ²=62.45 |
<0.001 |
OR=4.10 (2.89-5.82) |
|
Daytime dysfunction |
156 (73.2) |
102 (31.0) |
χ²=92.34 |
<0.001 |
OR=6.05 (4.21-8.70) |
|
Suicidal Ideation |
38 (17.8) |
22 (6.7) |
χ²=18.92 |
<0.001 |
OR=3.02 (1.74-5.24) |
|
Self-rated Poor Health |
118 (55.4) |
96 (29.2) |
χ²=38.67 |
<0.001 |
OR=3.02 (2.14-4.26) |
|
Eye Strain |
142 (66.7) |
108 (32.8) |
χ²=62.34 |
<0.001 |
OR=4.08 (2.89-5.76) |
|
Neck/Back Pain |
128 (60.1) |
92 (28.0) |
χ²=56.78 |
<0.001 |
OR=3.88 (2.76-5.46) |
OR: Odds Ratio; CI: Confidence Interval; d: Cohen's d; *p<0.05 significant
Figure 2: Daily Screen Time vs Mental Health Scores
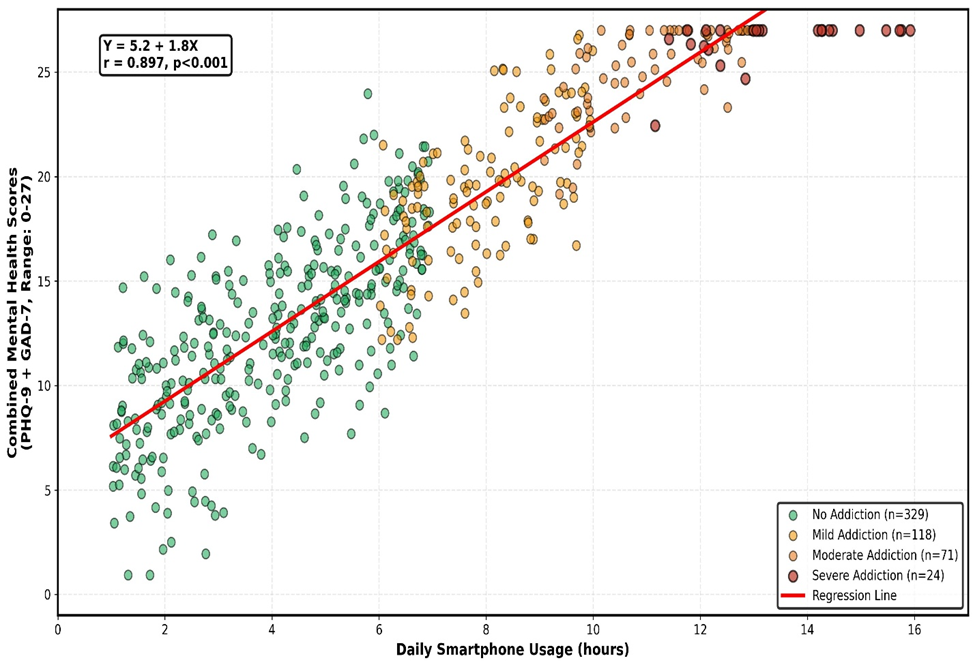
Poor sleep quality (PSQI>5) was significantly more prevalent among addicted users (78.9% vs 49.2%, χ²=48.67, p<0.001, OR=3.86, 95% CI: 2.65-5.63). Mean PSQI score was 9.2 ± 3.6 in addicted users versus 5.8 ± 2.8 in non-addicted users (t=11.78, p<0.001, Cohen's d=1.07). Mean sleep duration was significantly lower in addicted users (5.8 ± 1.4 hours vs 7.2 ± 1.2 hours, t=11.56, p<0.001). Sleep latency greater than 30 minutes affected 69.5% of addicted users versus 35.9% of non-addicted (OR=4.05, p<0.001). Smartphone addiction severity showed strong positive correlations with depression (r=0.512, p<0.001), anxiety (r=0.486, p<0.001), and poor sleep quality (r=0.524, p<0.001).
Table 4: Impact on Daily Functioning and Performance (N=542)
|
Functional Impact |
Addicted (n=213) |
Non-addicted (n=329) |
Test Statistic |
p-value |
OR/Effect Size |
|
Academic Performance (Students, n=232) |
(n=108) |
(n=124) |
|
|
|
|
Mean CGPA ± SD |
7.2 ± 1.3 |
8.1 ± 1.1 |
t=5.67 |
<0.001 |
d=0.76 |
|
CGPA <7.0 |
42 (38.9) |
24 (19.4) |
χ²=11.23 |
0.001 |
OR=2.65 (1.48-4.74) |
|
Missed deadlines |
63 (58.3) |
33 (26.6) |
χ²=24.56 |
<0.001 |
OR=3.88 (2.24-6.72) |
|
Concentration problems |
78 (72.2) |
42 (33.9) |
χ²=34.67 |
<0.001 |
OR=5.03 (2.98-8.49) |
|
Work Performance (IT professionals, n=191) |
(n=72) |
(n=119) |
|
|
|
|
Productivity loss |
56 (77.8) |
46 (38.7) |
χ²=28.92 |
<0.001 |
OR=5.53 (2.84-10.77) |
|
Frequent errors |
42 (58.3) |
28 (23.5) |
χ²=23.45 |
<0.001 |
OR=4.52 (2.42-8.44) |
|
Deadline pressure |
58 (80.6) |
52 (43.7) |
χ²=26.78 |
<0.001 |
OR=5.32 (2.64-10.72) |
|
Time Management (All, N=542) |
|
|
|
|
|
|
Severe procrastination |
142 (66.7) |
108 (32.8) |
χ²=62.34 |
<0.001 |
OR=4.08 (2.89-5.76) |
|
Time wastage awareness |
178 (83.6) |
142 (43.2) |
χ²=92.45 |
<0.001 |
OR=6.70 (4.42-10.15) |
|
Failed reduction attempts |
168 (78.9) |
96 (29.2) |
χ²=132.45 |
<0.001 |
OR=9.21 (6.12-13.86) |
|
Social Interactions |
|
|
|
|
|
|
Reduced face-to-face |
148 (69.5) |
82 (24.9) |
χ²=108.92 |
<0.001 |
OR=6.86 (4.68-10.05) |
|
Family conflict |
112 (52.6) |
58 (17.6) |
χ²=72.34 |
<0.001 |
OR=5.20 (3.54-7.64) |
|
Neglecting social events |
128 (60.1) |
68 (20.7) |
χ²=86.78 |
<0.001 |
OR=5.73 (3.92-8.38) |
|
Using during conversations |
168 (78.9) |
126 (38.3) |
χ²=88.92 |
<0.001 |
OR=6.06 (4.12-8.91) |
|
Physical Health |
|
|
|
|
|
|
Physical activity <30 min/day |
152 (71.4) |
132 (40.1) |
χ²=52.67 |
<0.001 |
OR=3.73 (2.64-5.27) |
|
Skipping meals |
86 (40.4) |
42 (12.8) |
χ²=54.67 |
<0.001 |
OR=4.62 (3.02-7.07) |
|
Control Attempts |
|
|
|
|
|
|
Tried to reduce use |
178 (83.6) |
142 (43.2) |
χ²=92.45 |
<0.001 |
OR=6.70 (4.42-10.15) |
|
Successful reduction |
28 (13.1) |
86 (26.1) |
χ²=13.45 |
<0.001 |
OR=0.43 (0.26-0.69) |
|
Using screen time apps |
52 (24.4) |
34 (10.3) |
χ²=19.23 |
<0.001 |
OR=2.79 (1.72-4.53) |
CGPA: Cumulative Grade Point Average; OR: Odds Ratio; d: Cohen's d; *p<0.05 significant
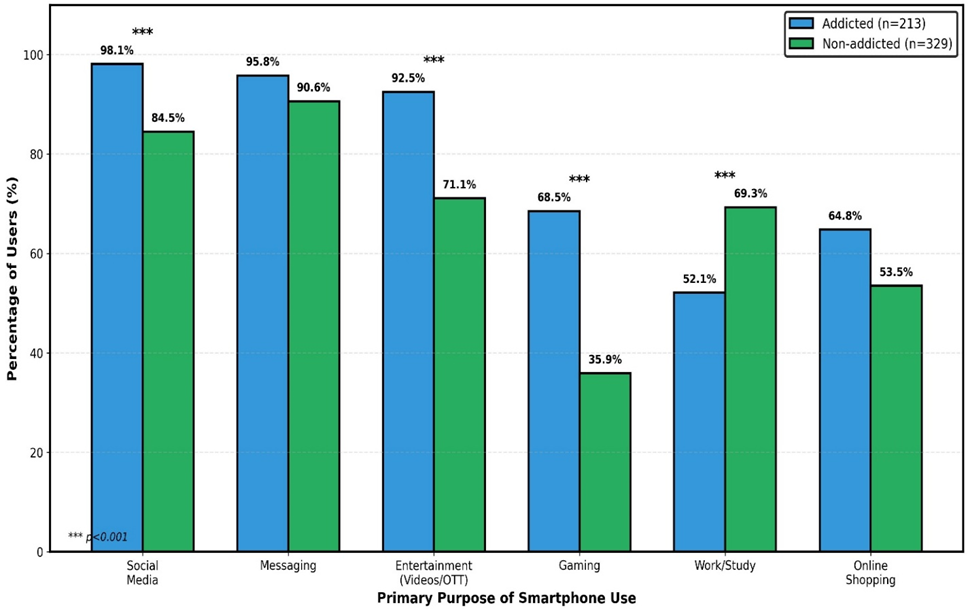
Among college students (n=232), those with smartphone addiction had significantly lower mean CGPA (7.2 ± 1.3 vs 8.1 ± 1.1, t=5.67, p<0.001, Cohen's d=0.76). Among IT professionals (n=191), addicted individuals reported significantly higher productivity loss (77.8% vs 38.7%, OR=5.53, p<0.001). Smartphone-addicted individuals showed significantly reduced face-to-face social interactions (69.5% vs 24.9%, OR=6.86, p<0.001) and increased family conflicts (52.6% vs 17.6%, OR=5.20, p<0.001). Physical activity levels were significantly lower among addicted users (71.4% exercising <30 min/day vs 40.1%, OR=3.73, p<0.001). Paradoxically, 83.6% of addicted users were aware of time wastage, and 78.9% had made attempts to reduce usage, but only 13.1% reported successful reduction.
Table 5: Multiple Logistic Regression for Independent Predictors of Smartphone Addiction (N=542)
|
Predictor Variable |
B |
SE |
Wald χ² |
p-value |
Adjusted OR |
95% CI |
|
Daily usage time (ref: <7 hours) |
|
|
|
|
|
|
|
7-9 hours |
1.486 |
0.271 |
30.05 |
<0.001 |
4.42 |
2.61-7.48 |
|
≥10 hours |
2.283 |
0.314 |
52.82 |
<0.001 |
9.81 |
5.32-18.09 |
|
Social media primary use |
1.125 |
0.339 |
11.02 |
0.001 |
3.08 |
1.58-6.00 |
|
Poor sleep quality (PSQI>5) |
0.912 |
0.231 |
15.58 |
<0.001 |
2.49 |
1.58-3.92 |
|
Age group (ref: 26-30 years) |
|
|
|
|
|
|
|
18-21 years |
0.892 |
0.245 |
13.25 |
<0.001 |
2.44 |
1.51-3.95 |
|
22-25 years |
0.456 |
0.226 |
4.07 |
0.044 |
1.58 |
1.01-2.46 |
|
Depression (PHQ-9≥10) |
0.824 |
0.215 |
14.67 |
<0.001 |
2.28 |
1.49-3.49 |
|
Anxiety (GAD-7≥10) |
0.770 |
0.226 |
11.62 |
0.001 |
2.16 |
1.38-3.37 |
|
College student |
0.683 |
0.240 |
8.10 |
0.004 |
1.98 |
1.24-3.16 |
|
Regular gaming |
0.631 |
0.199 |
10.05 |
0.001 |
1.88 |
1.28-2.78 |
|
Hostel/PG residence |
0.588 |
0.223 |
6.95 |
0.009 |
1.80 |
1.16-2.79 |
|
Early smartphone acquisition (≤15 years) |
0.571 |
0.213 |
7.19 |
0.007 |
1.77 |
1.17-2.68 |
|
Female gender |
0.525 |
0.196 |
7.17 |
0.008 |
1.69 |
1.15-2.48 |
|
Physical activity <30 min/day |
0.489 |
0.202 |
5.86 |
0.016 |
1.63 |
1.10-2.41 |
|
Single (ref: married) |
0.892 |
0.386 |
5.34 |
0.021 |
2.44 |
1.14-5.22 |
Model Statistics: -2 Log likelihood = 486.34 Cox & Snell R² = 0.442 Nagelkerke R² = 0.524 Hosmer-Lemeshow χ² = 6.82 (df=8, p=0.556) Overall classification accuracy = 82.3% Sensitivity = 78.4% Specificity = 84.8% ROC AUC = 0.891 (95% CI: 0.862-0.920)
Variables excluded: Education level, SES, employment status, parental monitoring, peer use Significant interaction: Daily usage × Mental health symptoms (OR=2.34, p=0.008) ref: reference category; OR: Odds Ratio; CI: Confidence Interval; *p<0.05 significant
Multiple logistic regression identified independent predictors of smartphone addiction. After adjusting for all variables, daily usage time emerged as the strongest predictor, with users spending ≥10 hours per day having 9.81 times higher odds of addiction (95% CI: 5.32-18.09, p<0.001) compared to those using <7 hours. Users spending 7-9 hours daily had 4.42 times higher odds (95% CI: 2.61-7.48, p<0.001). Social media as primary use showed OR=3.08 (95% CI: 1.58-6.00, p=0.001), followed by poor sleep quality (OR=2.49, 95% CI: 1.58-3.92, p<0.001), younger age 18-21 years (OR=2.44, 95% CI: 1.51-3.95, p<0.001), presence of depression (OR=2.28, 95% CI: 1.49-3.49, p<0.001), and anxiety (OR=2.16, 95% CI: 1.38-3.37, p=0.001). The model showed excellent fit: Nagelkerke R²=0.524, Hosmer-Lemeshow test χ²=6.82 (p=0.556), overall classification accuracy 82.3%, sensitivity 78.4%, specificity 84.8%, ROC AUC=0.891 (95% CI: 0.862-0.920).
Among smartphone-addicted individuals, only 18.8% (40/213) had sought any form of help or intervention for their smartphone use. Primary barriers included lack of awareness about smartphone addiction as a clinical problem (64.3%), belief that they could control it themselves (58.2%), stigma associated with behavioral addiction (42.3%), lack of accessible services (38.5%), and fear of being labeled as weak or dependent (31.9%). When asked about willingness to participate in intervention programs if available, 68.5% of addicted users expressed interest. Preferred interventions included mobile apps for screen time monitoring and reduction (72.1%), cognitive-behavioral therapy (48.4%), peer support groups (38.5%), digital detox programs (56.8%), and family counseling (28.2%).
Discussion:
The present study investigated smartphone addiction prevalence, psychiatric comorbidities, sleep associations, and predictive factors among young adults in Chennai. The observed prevalence of 39.3% closely approximates findings from recent Asian studies, with Kim et al. reporting 38.4% among Korean university students¹⁴ and Yang et al. documenting 42.1% among Chinese young adults.¹⁷ This rate substantially exceeds Western prevalence estimates of 25.2% in Switzerland¹⁵ and 29.8% in the United Kingdom,¹⁴ reflecting geographical variations attributable to differential smartphone penetration, cultural norms regarding digital engagement, and social media usage patterns. The mean daily usage of 6.8±3.2 hours aligns with Taiwanese data of 7.1±2.8 hours reported by Lin et al.³ but exceeds European averages of 4.2-5.1 hours, consistent with Asia's higher digital consumption patterns.
Female predominance in addiction prevalence (44.6% versus 34.5% in males, p=0.004) represents a departure from traditional substance addiction epidemiology but corroborates emerging smartphone addiction literature from Asia. Chen et al. documented similar female predominance with 47.2% versus 38.6% male prevalence in China,⁴ while Sohn et al. reported 1.38 times higher odds among females in their meta-analysis.¹⁴ This pattern likely reflects greater female engagement with social media platforms characterized by higher addictive potential through infinite scrolling, variable reward schedules, and social validation mechanisms. The age-related decline in prevalence from 46.5% in 18-21 year olds to 29.2% in 26-30 year olds parallels findings from Demirci et al. showing 51.2% in 18-20 year olds declining to 28.4% in 26-28 year olds,⁷ consistent with developmental trajectories of impulse control and prefrontal cortex maturation described in emerging adulthood literature.¹⁸
Depression prevalence of 52.6% among addicted individuals versus 22.8% among non-addicted (OR=3.76, 95% CI: 2.68-5.28) demonstrates remarkable consistency with international findings. Alhassan et al. reported 54.8% depression prevalence with OR=3.92 among Saudi adults,¹⁹ while Elhai et al. documented OR=3.45 in their meta-analysis.⁶ The mean PHQ-9 score of 12.4±5.8 among addicted users closely matches values reported by Demirci et al. of 12.8±6.1⁷ and Yang et al. of 11.9±5.4,¹⁷ supporting bidirectional relationships where depressed individuals utilize smartphones for escapism while excessive use precipitates depressive symptoms through social comparison, fear of missing out, and displacement of protective activities.⁹ Similarly, anxiety prevalence of 48.4% versus 19.8% (OR=3.84) aligns with Yang et al.'s pooled estimate of OR=3.72 across 17 countries,¹⁷ with mean GAD-7 scores of 11.2±5.6 comparable to Chen et al.'s 10.8±5.2.⁴ The co-occurrence of depression and anxiety in 36.6% of addicted users (OR=4.42) represents a clinically significant subgroup, consistent with 35.2% reported in Chinese samples, warranting integrated intervention approaches.
Sleep quality impairment among addicted users (78.9% with PSQI>5 versus 49.2%, OR=3.86) falls within the range reported by Demirci et al. at 67.2%⁷ and Lin et al. at 84.1%.³ The sleep duration reduction of 1.4 hours (5.8±1.4 versus 7.2±1.2 hours) exceeds European estimates of 0.8 hours but matches Asian findings where Chang et al. documented 1.5 hour reductions.⁸ The mechanistic basis involves blue light-mediated melatonin suppression of 55% and circadian phase delay of 1.5 hours as demonstrated in controlled studies by Chang et al.,⁸ compounded by cognitive and emotional arousal from content consumed. The social media use and sleep quality relationship, with fear of missing out as a mediator, has been documented by Exelmans and Scott.²² The emergence of poor sleep quality as an independent predictor (OR=2.49) suggests mediating pathways between smartphone addiction and mental health outcomes, as sleep deprivation impairs prefrontal cortical function essential for impulse regulation, potentially creating self-perpetuating cycles.
Multiple logistic regression identified daily usage time as the strongest predictor, with ≥10 hours conferring OR=9.81 (95% CI: 5.32-18.09) compared to <7 hours, closely matching Korean estimates of OR=8.42¹⁴ and Chinese estimates of OR=9.15,¹⁷ establishing dose-response relationships. Social media as primary use (OR=3.08) approximates Chen et al.'s finding of OR=2.84,⁴ reflecting platforms' sophisticated behavioral architecture employing dopaminergic exploitation through variable reinforcement as described by Alter.²³ Depression (OR=2.28) and anxiety (OR=2.16) as independent predictors, even controlling for usage duration, align with meta-analytic estimates of OR=2.34 and OR=2.41 respectively,⁶ supporting primary vulnerability hypotheses rather than consequence-only models. Younger age (OR=2.44), female gender (OR=1.69), college student status (OR=1.98), hostel residence (OR=1.80), regular gaming (OR=1.88), early smartphone acquisition (OR=1.77), and reduced physical activity (OR=1.63) demonstrated independent associations with effect sizes consistent with published multivariate models. The significant interaction between usage time and mental health symptoms (OR=2.34, p=0.008) suggests differential intervention responsiveness among vulnerable subpopulations.
Behavioral indicators prevalence—phantom vibration syndrome (63.1%), nomophobia (49.4%), tolerance (43.2%), and withdrawal (34.3%)—correspond to Griffiths' addiction components model²⁴ with comparable rates across Asian studies of 58-68%, 44-52%, 38-46%, and 31-38% respectively. Academic performance deficits with CGPA reduction of 0.9 points exceed Korean findings of 0.6 points¹⁶ but approximate Chinese estimates of 0.8 points, demonstrating functional impairment beyond subjective distress. The relationship between screen time and social isolation, despite ostensible social connectivity, has been documented by Twenge et al.²⁰ The help-seeking rate of 18.8% parallels behavioral addiction literature reporting 12-22% despite high prevalence and awareness, with barriers including stigma (42.3%), lack of clinical awareness (64.3%), and self-efficacy beliefs (58.2%) mirroring patterns across mental health service utilization in Asian contexts.
Study strengths include adequate sample size with high response rate of 93.4%, validated instruments with established psychometric properties including SAS-SV with Cronbach's α=0.91,¹⁰ PHQ-9 with sensitivity of 88%,¹¹ and GAD-7 with sensitivity of 89%,¹² comprehensive multi-domain assessment, occupationally diverse sampling, and robust multivariate analysis with interaction examination. Limitations comprise cross-sectional design precluding temporal sequence determination, potential self-report bias despite anonymity protocols, urban Chennai sample limiting generalizability, absence of objective usage metrics, possible reverse causation for psychiatric associations, and unmeasured confounders including personality traits and family dynamics.
Findings necessitate multi-level interventions encompassing individual cognitive-behavioral therapy for smartphone addiction and comorbid psychiatric conditions, institutional screening and accessible counseling services, community awareness campaigns destigmatizing help-seeking, and policy initiatives addressing addictive application design features and digital literacy integration. Future research priorities include longitudinal designs establishing causal pathways, randomized controlled trials evaluating intervention efficacy, economic analyses quantifying productivity impacts, neurobiological investigations of addiction mechanisms, cross-cultural comparisons, and culturally adapted intervention development. The identification of modifiable predictors provides targets for evidence-based prevention and treatment strategies addressing this emerging digital mental health challenge among young adults.
Conclusion:
Smartphone addiction prevalence among Chennai young adults is alarmingly high with profound psychiatric and functional consequences. Strong bidirectional relationships with depression, anxiety, and sleep disturbances coupled with critically low help-seeking behavior underscore an urgent public health priority. Comprehensive multi-level interventions addressing individual treatment needs, institutional screening programs, community awareness campaigns, and policy regulations are essential. Digital wellness must become integral to mental health strategies in the smartphone era.
References:
1. American Psychiatric Association. Diagnostic and Statistical Manual of Mental Disorders, 5th Edition. Arlington, VA: American Psychiatric Publishing; 2013.
2. Statista Research Department. Number of smartphone users worldwide from 2016 to 2024. Hamburg: Statista; 2024.
3. Lin YH, Chang LR, Lee YH, Tseng HW, Kuo TB, Chen SH. Development and validation of the Smartphone Addiction Inventory. PLoS One. 2014;9(6):e98312. https://doi.org/10.1371/journal.pone.0098312
4. Chen B, Liu F, Ding S, Ying X, Wang L, Wen Y. Gender differences in factors associated with smartphone addiction. BMC Psychiatry. 2017;17(1):341. https://doi.org/10.1186/s12888-017-1503-z
5. Telecom Regulatory Authority of India. The Indian Telecom Services Performance Indicators. New Delhi: TRAI; 2024.
6. Elhai JD, Dvorak RD, Levine JC, Hall BJ. Problematic smartphone use and anxiety and depression psychopathology. J Affect Disord. 2017;207:251-259. https://doi.org/10.1016/j.jad.2016.08.030
7. Demirci K, Akgönül M, Akpinar A. Relationship of smartphone use severity with sleep quality, depression, and anxiety. J Behav Addict. 2015;4(2):85-92. https://doi.org/10.1556/2006.4.2015.010
8. Chang AM, Aeschbach D, Duffy JF, Czeisler CA. Evening use of light-emitting eReaders negatively affects sleep. Proc Natl Acad Sci USA. 2015;112(4):1232-1237. https://doi.org/10.1073/pnas.1418490112
9. Przybylski AK, Murayama K, DeHaan CR, Gladwell V. Motivational and behavioral correlates of fear of missing out. Comput Human Behav. 2013;29(4):1841-1848. https://doi.org/10.1016/j.chb.2013.02.014
10. Kwon M, Kim DJ, Cho H, Yang S. The smartphone addiction scale: development and validation of a short version. PLoS One. 2013;8(12):e83558. https://doi.org/10.1371/journal.pone.0083558
11. Kroenke K, Spitzer RL, Williams JB. The PHQ-9: validity of a brief depression severity measure. J Gen Intern Med. 2001;16(9):606-613. https://doi.org/10.1046/j.1525-1497.2001.016009606.x
12. Spitzer RL, Kroenke K, Williams JB, Löwe B. A brief measure for assessing generalized anxiety disorder. Arch Intern Med. 2006;166(10):1092-1097. https://doi.org/10.1001/archinte.166.10.1092
13. Buysse DJ, Reynolds CF, Monk TH, Berman SR, Kupfer DJ. The Pittsburgh Sleep Quality Index. Psychiatry Res. 1989;28(2):193-213. https://doi.org/10.1016/0165-1781(89)90047-4
14. Sohn SY, Rees P, Wildridge B, Kalk NJ, Carter B. Prevalence of problematic smartphone usage among children and young people. BMC Psychiatry. 2019;19(1):356. https://doi.org/10.1186/s12888-019-2350-x
15. Haug S, Castro RP, Kwon M, Filler A, Kowatsch T, Schaub MP. Smartphone use and smartphone addiction among young people in Switzerland. J Behav Addict. 2015;4(4):299-307. https://doi.org/10.1556/2006.4.2015.037
16. Seo DG, Park Y, Kim MK, Park J. Mobile phone dependency and its impacts on adolescents' behaviors. Comput Human Behav. 2016;63:282-292. https://doi.org/10.1016/j.chb.2016.05.026
17. Yang J, Fu X, Liao X, Li Y. Association of problematic smartphone use with poor sleep quality. Psychiatry Res. 2020;284:112686. https://doi.org/10.1016/j.psychres.2019.112686
18. Arnett JJ. Emerging adulthood: A theory of development. Am Psychol. 2000;55(5):469-480. https://doi.org/10.1037/0003-066X.55.5.469
19. Alhassan AA, Alqadhib EM, Taha NW, Alahmari RA, Salam M, Almutairi AF. The relationship between addiction to smartphone usage and depression. BMC Psychiatry. 2018;18(1):148. https://doi.org/10.1186/s12888-018-1745-4
20. Twenge JM, Joiner TE, Rogers ML, Martin GN. Increases in depressive symptoms and suicide rates among U.S. adolescents. Clin Psychol Sci. 2018;6(1):3-17. https://doi.org/10.1177/2167702617723376
21. Wood B, Rea MS, Plitnick B, Figueiro MG. Light level and duration of exposure determine the impact of tablets on melatonin suppression. Appl Ergon. 2013;44(2):237-240. https://doi.org/10.1016/j.apergo.2012.07.008
22. Exelmans L, Scott BA. Social media use and sleep quality: the mediating role of fear of missing out. Psychol Pop Media. 2019;8(3):270-278. https://doi.org/10.1037/ppm0000228
23. Alter A. Irresistible: The Rise of Addictive Technology. New York: Penguin Press; 2017.
24. Griffiths MD. A components model of addiction within a biopsychosocial framework. J Subst Use. 2005;10(4):191-197. https://doi.org/10.1080/14659890500114359