Validation of a Study to Correlate Mean Platelet Volume, Neutrophil to Lymphocyte Ratio and Erythrocyte Sedimentation Rate with C-Reactive Protein in Patients with Acute Ischemic Stroke
- Harish T.J. , Assistant Professor, Department of General Medicine, Sri Madhusudan Sai Institute of Medical Science and Research, Muddenhalli, Chikkaballapur, Karnataka, India
- Prabhu P , Assistant Professor, Department of Emergency Medicine, Shri Atal Bihari Vajpayee Medical College & Research Institute, Bengaluru, Karnataka, India
- Abeer Khan , Senior Resident, Department of Emergency Medicine, St. Johns National Academy of Health Sciences, Bengaluru, Karnataka, India
Article Information:
Abstract:
Background: Elevation of C reactive protein (CRP) is one of the major acute-phase responses following ischaemic or haemorrhagic stroke. This study aims to investigate the associations between platelet indices, neutrophil-to-lymphocyte ratio (NLR) and erythrocyte sedimentation rate (ESR) compared with CRP in patients with cerebral infarction. Methods: We included 65 subjects in our study as per inclusion and exclusion criteria after informed consent, Sample for analysis of parameters is taken within 24hrs and analysed within 4hrs from sampling. MPV, NLR, and ESR are measured through automatic haematology analyser. CRP is measured by immune-turbidimetric method. Results: We found that ESR, CRP, MPV and N/L ratio was elevated in patients with ischemic stroke, but there was no linear correlation between these parameters. Conclusion: In our study MPV, NLR and ESR were elevated in ischemic stroke patients, but it showed no significant linear correlation with CRP in patients with cerebral infarction. Further well-designed and large-scale prospective studies are warranted to evaluate platelet indices or NLR for monitoring patients with cerebral infarction.
Keywords:
Article :
INTRODUCTION:
Stroke is a major global public health concern. Stroke was reported to be the 2nd leading cause of death worldwide (4.66 million) by the Global Burden of Diseases (GBD) in 1990. The same study reported an increase from 4.66 million in 1990 to 5.87 million global stroke deaths two decades later, revealing an increase of 26%. Attributed to the rising proportion of mortality, stroke retained the position of the 2nd leading cause of death worldwide. The GBD study in 2001 estimated that the Low- and middle-income Countries (LMICs) bear over 85% of the global burden of stroke. It further analyzed that the 42% reduction of stroke incidence in high-income countries (HICs) is due to the reported reduction in the stroke incidence from 163/100,000 person-years in 1970-1979 to 94/100,000 person-years during 2000-2008.[1]
The fatality of stroke in the Indian scenario in the terms of burden, incidence and prevalence
During the past two decades, India witnessed a significant alteration in the demographic, economic, and epidemiological transition resulting in the expanded life expectancy with an eventual augmentation in the geriatric population.[1]
Prevalence: The crude stroke prevalence in different parts of India stretched from 44.29 to 559/100,000 persons during the past two decades. The same period witnessed the Indian cumulative incidence of stroke which ranged from 105 to 152/100,000 persons per year in different parts of the country. When compared to early HICs, stroke mortality rates were higher. While the case fatality was calculated as 42% within a week in urban India, rural India showed a 46% fatality.[1]
The GBD reported 9.4 million deaths in India, of which 619,000 were from stroke alone and an estimated 28.5 million was lost in the Disability Adjusted Life Years (DALYs) which was nearly six times higher than that due to malaria.[2]
Indian Collaborative Acute Stroke Study (ICASS) was a prospective study to find the consecutive and unselected CT-confirmed cases of acute stroke admitted to major university hospitals in India. It found 2162 acute stroke cases (CT confirmed) in the period between 2002 and 2004.
Stroke was found to be the prime culprit in causing mortality in Gadchiroli, a rural tribal area in Maharashtra. A 2011-2013 verbal autopsy method of death audit revealed that out of the 1599 total deaths, an estimated nearly 14.3% (229) deaths were attributed to stroke. With an age-adjusted stroke mortality rate of 192/100,000 persons, it was also the most frequent cause of death. While home occurred stroke deaths are estimated an approximate of 87%, 45% of the stroke deaths are seen within the first 30 days of the onset of stroke symptoms.[1]
The neurological disorders prevalence in Ganderbal block, (a rural area in Srinagar) was analyzed on the studies which were conducted for about five months in two stages (October 1999 and March 2000). This study reported a 559/100,000 persons crude prevalence of stroke. Nearly, three quarters (74%) of the stroke survivors in the survey had hemorrhagic stroke.[1]
A relationship between blood pressure and the development of stroke is persistent and well established. It is the major factor responsible for the development of atherosclerotic complications which includes not only cerebral infarction and cardioembolic ischemic stroke, but also, the complications of hypertensive small vessel disease, ranging from Intracerebral Haemorrhage (ICH), lacunar infarction, cerebral micro bleeds, and White Matter Lesions (WMLs).[3]
The inflammatory role of atherosclerosis has garnered consideration gradually as evidenced by the recent clinical research. They professed the aspect of pathogenesis and atherosclerotic progression leading to plaque rupture, thrombosis, and stroke. While endothelial dysfunction initiates atherosclerotic lesions, Reactive Oxygen Species (ROS) is detrimental in the development of cerebrovascular damage.[3]
The development of vascular-related diseases such as stroke and Alzheimer’s disease in association with increased acute ischemic stroke is attributable to the process of Endothelial Dysfunction (ED) in the cerebral circulation. It increases permeability, vascular reactivity, platelet activation, changes endothelium-mediated vasodilatation and enhances thrombogenicity, leukocyte adhesion along with monocyte migration. ED which is found in geriatric individuals is associated with the development of increased cardiovascular risk, such as in hypertension, atherosclerosis, dyslipidaemia, diabetes, obesity, smoking, and renal failure.[3]
Oxidative stress is the prime initiator in the pathogenesis of a variety of diseases as a part of ageing process, which includes atherosclerosis, cancer, neurodegenerative diseases, and stroke. The brain is very inclined to Reactive Oxygen Species (ROS) induced damage for many reasons, such as high concentrations of peroxidizable lipids, low levels of protective antioxidants, high oxygen consumption, high levels of iron (which acts as a pro-oxidant under pathologic conditions), along with reactions dealing with involving dopamine and glutamate oxidation. ROS at lower levels is necessary for cell signaling, functions while increased concentrations induce vascular disease.[3]
There have been many efforts to find useful diagnostic markers for monitoring patients with cerebral infarction. C reactive protein (CRP) is a marker of inflammation and a hallmark of the acute-phase response. Many reports suggested that CRP was associated with risk of stroke, whereas some reports did not find significant relations. Recently, Liu etal reported that elevated high sensitivity-CRP (hs-CRP) concentrations were associated with a higher risk of ischaemic stroke, particularly for non-fatal stroke, males and hypertensive participants but there were no significant associations between hs-CRP and intracranial haemorrhage and subarachnoid haemorrhage in a large prospective study. Also, erythrocyte sedimentation rate (ESR), a classical acute-phase marker, was often compared with CRP. Recently, there were a number of reports dealing with platelet indices such as mean platelet volume (MPV); MPV/platelet count (PC) ratios have clinical indications in various conditions such as atherosclerosis, cerebral infarctionand active inflammatory diseases; high MPV was even associated with fractures. Also, the neutrophil-to-lymphocyte ratio (NLR) parameter was reported to be an important measure of systemic inflammation. However, platelet indices and NLR have not been fully investigated in roles as useful surrogate biomarkers of diagnosis in patients with cerebral infarction. The objectives of the present study is to investigate the associations between platelet indices, neutrophil-to-lymphocyte ratio (NLR) and erythrocyte sedimentation rate (ESR) compared with CRP in patients with cerebral infarction.
MATERIALS AND METHODS:
The present study was a Prospective, observational hospital based study conducted between January 2018 to June 2019 in Department of General Medicine, KIMS Hospital, Bangalore. After obtaining approval from the Institutional Ethics Committee, written informed consent was taken from the patients. 65 patients with acute ischemic stroke diagnosed by MRI/CT imaging admitted or attending OPD/Casulity at KIMS Hospital and Research Centre, Bangalore were included in the study.
Patients with age less than 18 years, Onset of symptoms >2 days before admission, Medical illness likely to interfere with platelet function (Myeloproliferative disease, aplastic anaemia, wisckott Aldrich syndrome, ITP, if patient is on antiplatelet therapy, CLD, viral fever), Chronic disease (immune compromised patients, chronic kidney disease, inflammatory conditions such as IBD, caeliac disease etc, rheumatoid arthritis, SLE) were excluded from the study. at the time of presentation and detailed history along with clinical examination was performed and later subjected to necessary investigations. MPV, NLR, and ESR were measured through automatic haematology analyser. CRP was measured by immunoturbidimetric method. Statistical analysis was done using SPSS software 19.0, SD data obtained was tabulated in the excel sheet and was analysed, Quantitative values were expressed as mean+/- standard deviation. Qualitative values represented in percentages. Student’s unpaired t-test was used for quantitative data. ROC curve analysis was done to measure the diagnostic accuracy of the indices measured at different cutoffs. P <0.005 was considered statistically significant.
RESULTS:
Sex Distribution
A total 65 patients were included in our study as per inclusion criteria, among them 42 were males(64.6%) and 23 were females(35.4) as seen in Table 1.
|
Sex |
Frequency |
Percent |
|
Male |
42 |
64.6% |
|
Female |
23 |
35.4% |
|
Total |
65 |
100% |
|
Table 1: Distribution of subjects according to Sex |
||
In our study group majority of them were in 46-65 age group (50.8%), only 2 (3.1%) were over 86 years. Young stroke subjects were 14 (21.5%), and 16 (24.6%) were between 66-85 as evident from Table 2.
|
Age Group |
Frequency |
Percent |
|
<= 45 |
14 |
21.5% |
|
46 - 65 |
33 |
50.8% |
|
66 - 85 |
16 |
24.6% |
|
86+ |
2 |
3.1% |
|
Total |
65 |
100% |
|
Table 2: Distribution of subjects according to Age Group |
||
Among study group population 26(40%) had right upper limb and lower limb weakness, 16(24.6%) had no weakness, 12(18.5%) had left upper and lower limb weakness, 7(10.8%) had left lower limb weakness, 2(3.1%) had right upper limb weakness(Table 3).
|
Weakness of Limbs |
Frequency |
Percent |
|
No Weakness |
16 |
24.6% |
|
Left Upper Limb |
1 |
1.5% |
|
LeftLower Limb |
7 |
10.8% |
|
LeftUpper Limb & Lower Limb |
12 |
18.5% |
|
RightUpper Limb |
2 |
3.1% |
|
RightLL |
1 |
1.5% |
|
Right Upper Limb & Lower Limb |
26 |
40.0% |
|
Total |
65 |
100.0% |
|
Table 3: Distribution of subjects according to Weakness of Limbs |
||
In our study, out of 65 subjects 40(61.5%) had speech abnormality and 25(36.9%) had no speech abnormality as evident from table 4.
|
Speech Abnormalities |
Frequency |
Percent |
|
No |
25 |
36.9% |
|
Yes |
40 |
61.5% |
|
Total |
65 |
98.5% |
|
Total |
65 |
100% |
|
Table 4: Distribution of subjects according to Speech Abnormalities |
||
In our study population 28(43.1%) had facial weakness and 37(56.9%) had no facial weakness (Table 5).
|
Facial Weakness |
Frequency |
Percent |
|
No |
37 |
56.9% |
|
Yes |
28 |
43.1% |
|
Total |
65 |
100% |
|
Table 5: Distribution of subjects according to Facial Weakness |
||
In our study population, 50 (76.9%) subjects had no altered sensorium and 15 (23.1%) had altered sensorium as seen in Table 6.
|
Altered Sensorium |
Frequency |
Percent |
|
No |
50 |
76.9% |
|
Yes |
15 |
23.1% |
|
Total |
65 |
100% |
|
Table 6: Distribution of subjects according to Altered Sensorium |
||
Among study subjects 62(95.4%) doesn’t have bowel and bladder abnormalities 3 (4.6%) had bowel/bladder abnormality as seen in Table 7.
|
Bladder/Bowel Involvement |
Frequency |
Percent |
|
No |
62 |
95.4% |
|
Yes |
3 |
4.6% |
|
Total |
65 |
100% |
|
Table 7: Distribution of subjects according to Bladder/Bowel Involvement |
||
As we could observe from Table 8 that among patients who had nonspecific complaints 13.8% had Giddiness, 1.5% had Giddiness and Head ache, 1.5% had Giddiness and swaying with difficulty in walking and 4.6% had Giddiness and Vomiting.
|
Complaints |
Frequency |
Percent |
|
None |
51 |
78.5% |
|
Giddiness |
9 |
13.8% |
|
Giddiness and Head Ache |
1 |
1.5% |
|
Giddiness and Swaying with Difficulty in Walking |
1 |
1.5% |
|
Giddiness and Vomiting |
3 |
4.6% |
|
Total |
65 |
100% |
|
Table 8: Distribution of subjects according to nonspecific Complaints |
||
Among 65 study subjects 28(43.1%) were smokers and 37(56.9%) were nonsmokers (Table 9).
|
Smoking |
Frequency |
Percent |
|
No |
37 |
56.9 |
|
Yes |
28 |
43.1 |
|
Total |
65 |
100.0 |
|
Table 9: Distribution of subjects according to Smoking |
||
Among 65 study subjects 18(27.7%) were alcoholic and 47(72.3%) were nonalcoholic (Table 10).
|
Alcoholism |
Frequency |
Percent |
|
No |
47 |
72.3% |
|
Yes |
18 |
27.7% |
|
Total |
65 |
100% |
|
Table 10: Distribution of subjects according to Alcoholism |
||
In our study 22(33.8%) subjects were diabetic and 43(66.2%) were non diabetic (Table 11).
|
Diabetes Mellitus |
Frequency |
Percent |
|
No |
43 |
66.2 |
|
Yes |
22 |
33.8 |
|
Total |
65 |
100.0 |
|
Table 11: Distribution of subjects according to Diabetes Mellitus |
||
In our study, among 65 subjects, 25(38.5%) were hypertensive and 40(61.5%) were non hypertensive (Table 12).
|
Hypertension |
Frequency |
Percent |
|
No |
40 |
61.5% |
|
Yes |
25 |
38.5% |
|
Total |
65 |
100% |
|
Table 12: Distribution of subjects according to Hypertension |
||
In our study, 2D Echo findings of 65 subjects showed, conc LVH in 20(30.8%) subjects, LVDD in 13(20%), LVH strain in 1(1.5%) and 31(47.7%) subjects had normal 2D Echo (Table 13).
|
Echocardiogram |
Frequency |
Percent |
|
CONC LVH |
20 |
30.8% |
|
LVDD |
13 |
20% |
|
LVH With Strain |
1 |
1.5% |
|
Normal |
31 |
47.7% |
|
Total |
65 |
100% |
|
Table 13: Distrubation of subjects according to 2D echo |
||
Brain imaging (CT/MRI) of our subjects showed Right MCA infarct in 20(30.8%), left MCA territory infarct in 15(23.1%) and other territory infarct as shown in hospital (Table 14).
|
CT/MRI |
Frequency |
Percent |
Valid Percent |
Cumulative Percent |
|
B/L MCA AND RT PCA Infarct |
1 |
1.5% |
1.5 |
1.5% |
|
LT Cerebellar Infarct |
3 |
4.6% |
4.6 |
6.2% |
|
LT MCA INFARCT |
15 |
23.1% |
23.1 |
29.2% |
|
LT MCA Infarct AND PCA Infarct |
1 |
1.5% |
1.5 |
30.8% |
|
LT MCA Terrtiory Infarct |
1 |
1.5% |
1.5 |
32.3% |
|
LT MCA-PCA Watershed Infarct |
3 |
4.6% |
4.6 |
36.9% |
|
LT MCA/ACA & MCCA -PCA Watershed Area Infarct |
1 |
1.5% |
1.5 |
38.5% |
|
LT MCA/PCA Watershed Area Infarct |
1 |
1.5% |
1.5 |
40% |
|
LT PCA Infarct |
3 |
4.6% |
4.6 |
44.6% |
|
LY MCA Infarct |
1 |
1.5% |
1.5 |
46.2% |
|
PCA Infarct |
6 |
9.2% |
9.2 |
55.4% |
|
RT ACA Infarct |
1 |
1.5% |
1.5 |
56.9% |
|
RT Cerebellar Infarct |
2 |
3.1% |
3.1 |
60% |
|
RT MCA Infarct |
20 |
30.8% |
30.8 |
90.8% |
|
RT PCA Infarct |
6 |
9.2% |
9.2 |
100% |
|
Total |
65 |
100% |
100.0 |
|
|
Table 14: Distrubation of subjects according to CT/MRI features |
||||
In our study out of 65 subjects 63(96.9%) survived and 2(3.1%) dead (Table 15).
|
Outcome |
Frequency |
Percent |
|
Survived |
63 |
96.9% |
|
Death |
2 |
3.1% |
|
Total |
65 |
100% |
|
Table 15: Outcome |
||
Table 16 compares mean values of the ESR, CRP, MPV and Neutrophil to Lymphocyte ratio among survivors and non survivors. It was found that mean ESR was 56.10(SD 25.547) among survivors and 34.50(SD 13.435) in non survivors. Mean CRP was 4.503(SD 2.24) among survivors and 4.450(SD 2.6163) in non survivors. Mean MPV in survivors was 13.99(SD 2.646) and 14.55(SD 1.58) in non survivors. Mean Neutrophil to lymphocyte ratio in survivors was 4.068(SD 2.427) and in non survivors it was 2.80(SD 2.12) (Table 16).
|
Lab Reports |
Outcome |
N |
Mean |
Std. Deviation |
t |
p |
|
ESR |
Survived |
63 |
56.10 |
25.547 |
1.1 |
0.24NS |
|
Death |
2 |
34.50 |
13.435 |
|||
|
CRP |
Survived |
63 |
4.503 |
2.2485 |
0.3 |
0.97NS |
|
Death |
2 |
4.450 |
2.6163 |
|||
|
MPV |
Survived |
63 |
13.9971 |
2.64668 |
0.29 |
0.77 NS |
|
Death |
2 |
14.5500 |
1.58392 |
|||
|
TC |
Survived |
63 |
10009.51 |
3377.034 |
4.1 |
0.001 HS |
|
Death |
2 |
20175.00 |
4136.575 |
|||
|
N/L ratio |
Survived |
63 |
4.068 |
2.4273 |
0.72 |
0.46NS |
|
Death |
2 |
2.800 |
2.1213 |
|||
|
RBS |
Survived |
63 |
156.03 |
66.090 |
0.92 |
0.93 NS |
|
Death |
2 |
160.50 |
57.276 |
|||
|
Table 16: Comaprison of mean values of ESR, MP, NLR, CRP between survived and death patients |
||||||
|
NS= Not significant, HS= Highly significant |
||||||
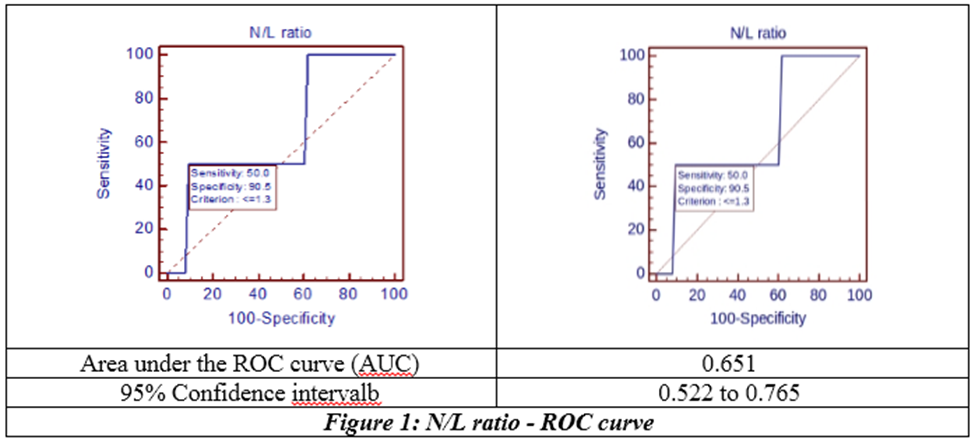
In our study, ROC curve shows, the optimum cutoff of N/L ratio for predicting Death among the study subjects is <1.3, with maximum sensitivity and specificity of 50% and 90% respectively. The area under the curve (AUC) for the same is 0.65 as evident from below figure 1 and Table 17.
|
Criterion |
Sensitivity |
95% CI |
Specificity |
95% CI |
+LR |
-LR |
|
< 0.7 |
0.00 |
0.0 - 84.2 |
100.00 |
94.3 - 100.0 |
|
1.00 |
|
<=1.2 |
0.00 |
0.0 - 84.2 |
92.06 |
82.4 - 97.4 |
0.00 |
1.09 |
|
<=1.3 * |
50.00 |
1.3 - 98.7 |
90.48 |
80.4 - 96.4 |
5.25 |
0.55 |
|
<=4.2 |
50.00 |
1.3 - 98.7 |
39.68 |
27.6 - 52.8 |
0.83 |
1.26 |
|
<=4.3 |
100.00 |
15.8 - 100.0 |
38.10 |
26.1 - 51.2 |
1.62 |
0.00 |
|
<=9 |
100.00 |
15.8 -100.0 |
0.00 |
0.0 - 5.7 |
1.00 |
|
|
Table 17: Criterion values and coordinates of the ROC curve |
||||||
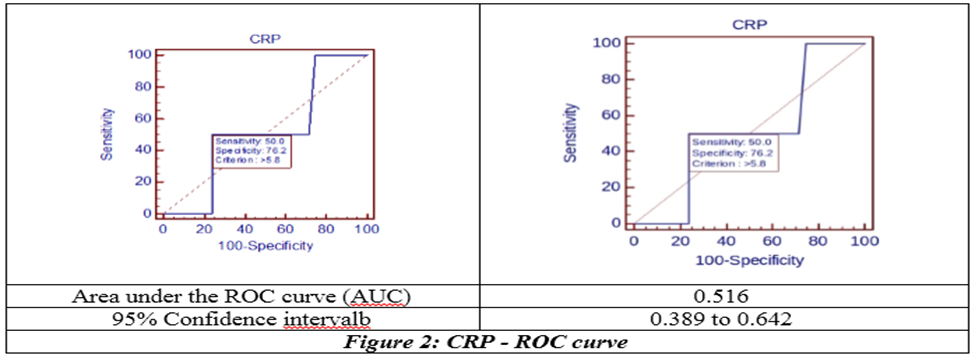
ROC curve shows, the optimum cutoff of CRP for predicting death among the study subjects is >5.8, with maximum sensitivity and specificity of 50% and 76.2% respectively. The area under the curve (AUC) for the same is 0.516 as evident from below figure 2 and Table 18.
|
Criterion |
Sensitivity |
95% CI |
Specificity |
95% CI |
+LR |
-LR |
|
>=1.2 |
100.00 |
15.8 - 100.0 |
0.00 |
0.0 - 5.7 |
1.00 |
|
|
>2.5 |
100.00 |
15.8 - 100.0 |
25.40 |
15.3 - 37.9 |
1.34 |
0.00 |
|
>2.6 |
50.00 |
1.3 - 98.7 |
28.57 |
17.9 - 41.3 |
0.70 |
1.75 |
|
>5.8 * |
50.00 |
1.3 - 98.7 |
76.19 |
63.8 - 86.0 |
2.10 |
0.66 |
|
>6.3 |
0.00 |
0.0 - 84.2 |
76.19 |
63.8 - 86.0 |
0.00 |
1.31 |
|
>9.7 |
0.00 |
0.0 - 84.2 |
100.00 |
94.3 - 100.0 |
1.00 |
|
|
Table 18: Criterion values and coordinates of the ROC curve |
||||||
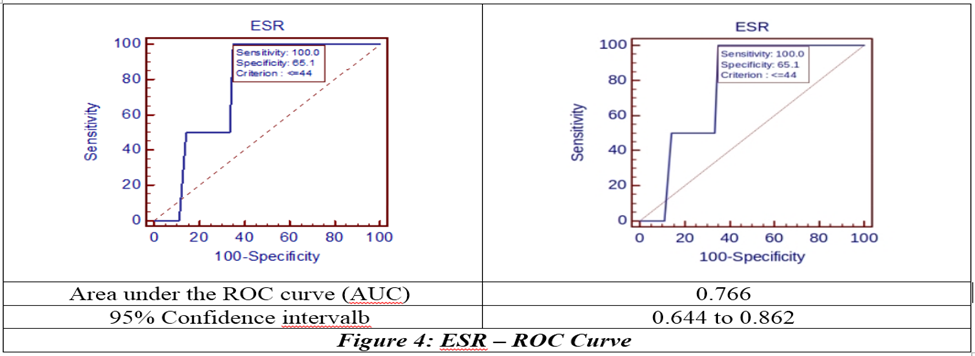
ROC curve shows, the optimum cutoff of MPV for predicting death among the study subjects is >12.8, with maximum sensitivity and specificity of 100% and 36.5% respectively. The area under the curve (AUC) for the same is 0.536 as evident from below figure 3 and Table 19.
|
Criterion |
Sensitivity |
95% CI |
Specificity |
95% CI |
+LR |
-LR |
|
< 8 |
0.00 |
0.0 -84.2 |
100.00 |
94.3- 100.0 |
|
1.00 |
|
<=23 |
0.00 |
0.0 -84.2 |
88.89 |
78.4 -95.4 |
0.00 |
1.12 |
|
<=25 |
50.00 |
1.3 -98.7 |
85.71 |
74.6 - 93.3 |
3.50 |
0.58 |
|
<=43 |
50.00 |
1.3 -98.7 |
66.67 |
53.7 - 78.0 |
1.50 |
0.75 |
|
<=44 * |
100.00 |
15.8 - 100.0 |
65.08 |
52.0 - 76.7 |
2.86 |
0.00 |
|
<=101 |
100.00 |
15.8 -100.0 |
0.00 |
0.0 - 5.7 |
1.00 |
|
|
Table 20: Criterion values and coordinates of the ROC curve |
||||||
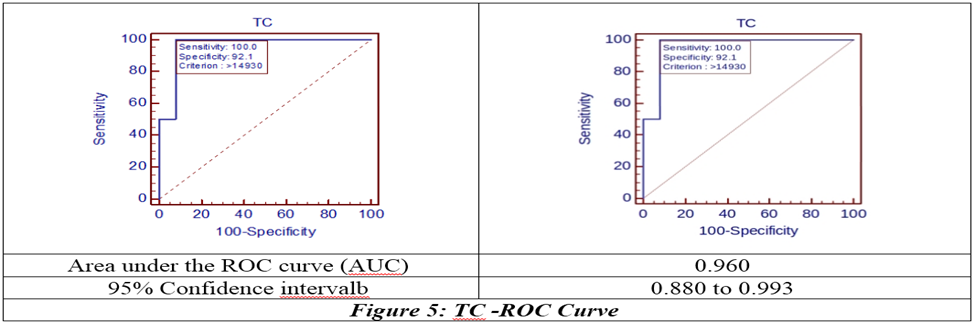
ROC curve shows, the optimum cutoff of TC for predicting death among the study subjects is >14930, with maximum sensitivity and specificity of 100% and 92.1% respectively. The area under the curve (AUC) for the same is 0.96 as evident from below figure 5 and Table 21.
|
Criterion |
Sensitivity |
95% CI |
Specificity |
95% CI |
+LR |
-LR |
||||||
|
>=4567 |
100.00 |
15.8 -100.0 |
0.00 |
0.0 - 5.7 |
1.00 |
|
||||||
|
>14930* |
100.00 |
15.8 -100.0 |
92.06 |
82.4 - 97.4 |
12.60 |
0.00 |
||||||
|
>17250 |
50.00 |
1.3 - 98.7 |
92.06 |
82.4 - 97.4 |
6.30 |
0.54 |
||||||
|
>19810 |
50.00 |
1.3 - 98.7 |
100.00 |
94.3 - 100.0 |
|
0.50 |
||||||
|
>23100 |
0.00 |
0.0 - 84.2 |
100.00 |
94.3 - 100.0 |
|
1.00 |
||||||
|
Table 21: Criterion values and coordinates of the ROC curve |
||||||||||||
|
* Criterion corresponding with highest Youden index |
||||||||||||
|
Correlations |
||||||||||||
|
|
ESR |
CRP |
MPV |
TC |
N/L ratio |
|||||||
|
ESR |
r |
1 |
-.251* |
.153 |
.059 |
.117 |
||||||
|
p |
|
.044 |
.225 |
.639 |
.353 |
|||||||
|
N |
65 |
65 |
65 |
65 |
65 |
|||||||
|
CRP |
r |
-.251* |
1 |
.085 |
-.034 |
-.361** |
||||||
|
p |
.044 |
|
.501 |
.790 |
.003 |
|||||||
|
N |
65 |
65 |
65 |
65 |
65 |
|||||||
|
*. Correlation is significant at the 0.05 level (2-tailed). |
||||||||||||
|
**. Correlation is significant at the 0.01 level (2-tailed). |
||||||||||||
|
Table 22: Correlation between ESR, MPV, TC, Neutrophil to lymphocyte ratio with CRP |
||||||||||||
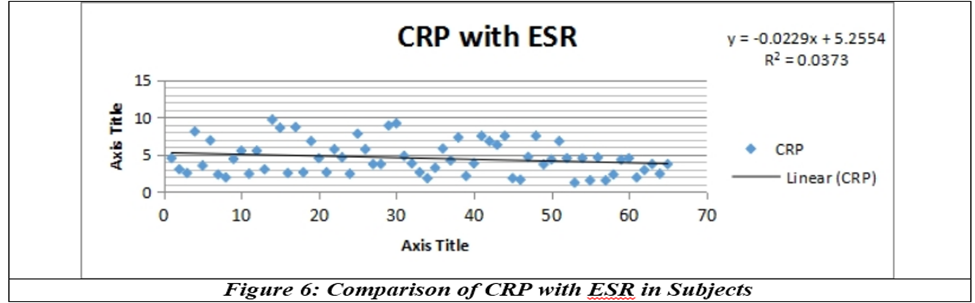
ESR is marked in X axis and CRP in y axis, each dot represent a pair of data it shows there is no correlation between CRP and ESR in ischaemic stroke subjects (Fig 6).
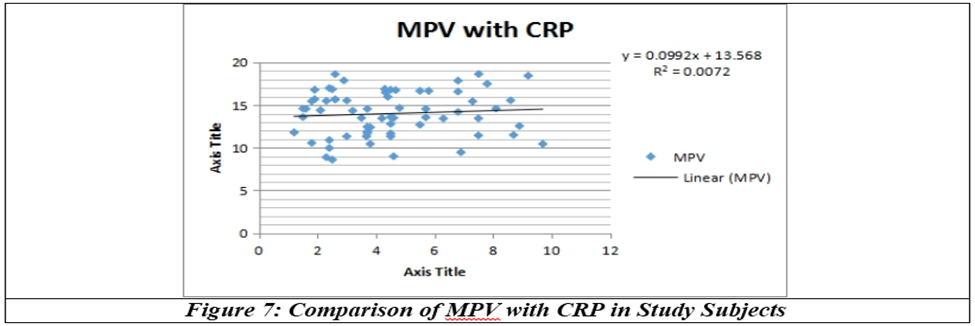
CRP is marked in X axis and MPV in y axis, each dot represent a pair of data it shows there is no correlation between CRP and MPV in ischemic stroke subjects (Fig 7).
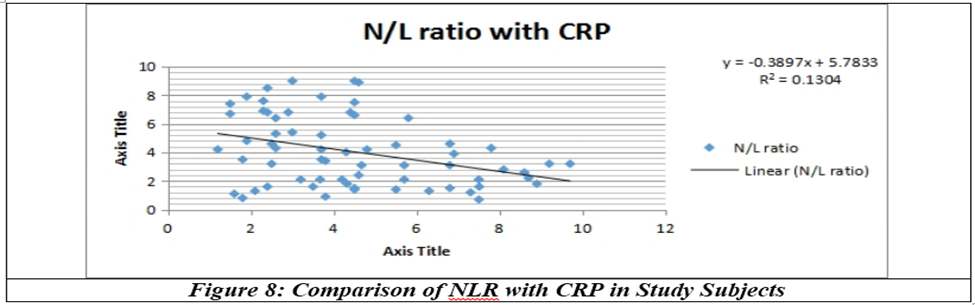
CRP is marked in X axis and N/L ratio in y axis, each dot represent a pair of data. It shows there is no correlation between CRP and N/L ratio in ischemic stroke subjects (Fig 8).
DISCUSSION:
There have been many efforts to find use full diagnostic markers to monitor patients with cerebral infarction.
In our study, A total 65 patients were included in our study as per inclusion criteria, among them 42 were males(64.6%) and 23 were females(35.4) shows male predominance probably due to habits like smoking, alcohol more common in Indian male population but it need more sample size and multicentric study. As compare to Wang K et al, study which shows male predominance.[1]
In our study group majority of them were in 46-65 age group (50.8%), only 2 (3.1%) were over 86 years. Young stroke subjects were 14(21.5%), and 16(24.6%) were between 66-85.
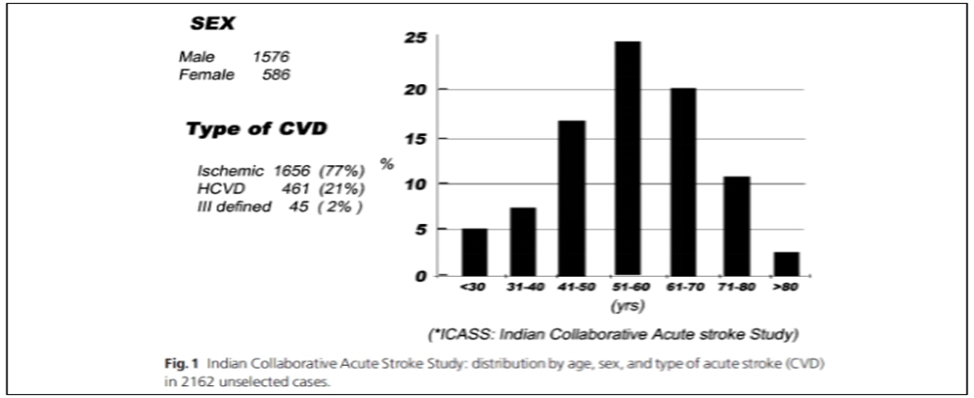
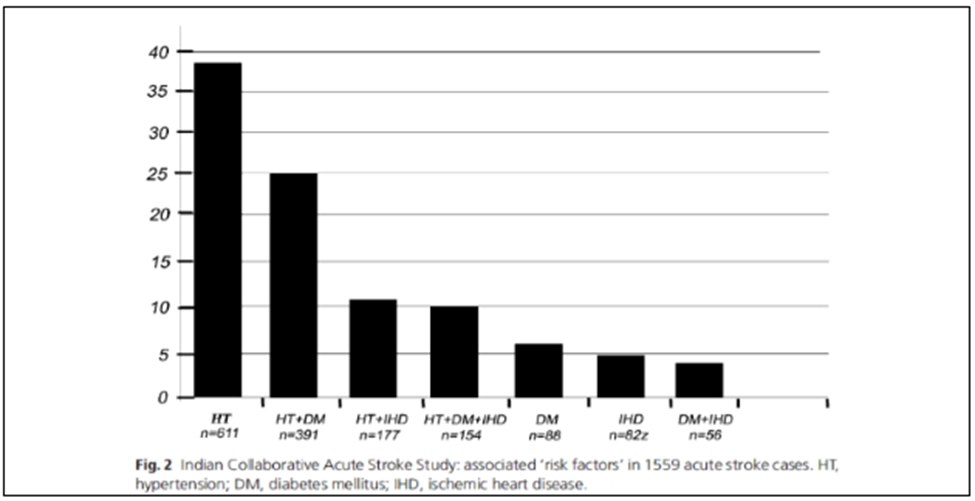
Among 65 study subjects 18(27.7%) were alcoholic and 47(72.3%) were nonalcoholic, 28(43.1%) were smokers and 37(56.9%) were nonsmokers, 25(38.5%) were hypertensive and 40(61.5%) were non hypertensive and 22(33.8%) subjects were diabetic and 43(66.2%) were non diabetic. Indian Collaborative Acute Stroke Study (ICASS) was a prospective study to find the consecutive and unselected CT-confirmed cases of acute stroke admitted to major university hospitals in India. It found 2162 acute stroke cases (CT confirmed) in the period between 2002 and 2004. The distribution by age, sex, and type of stroke in these 2162 cases is depicted in the below Figures which also displays the information on associated risk factors such as hypertension, diabetes mellitus, and Ischemic Heart Disease (IHD), alone or in various combinations, in 1559 cases.[2]
Brain imaging (CT/MRI) of our subjects showed Right MCA infarct in 20(30.8%), left MCA territory infarct in 15(23.1%) and other territory infarct as shown in hospital. MCA territory is more common in CVA. As compare to Wang K et al, study where shows MCA territory predominance.[1]
Few studies were conducted which established an association between platelet size and myocardial infarction and even fewer studies were conducted which delved at the correlation between platelet size and ischemic stroke.[4]
The study helmed by Patel V, et al., dwells on this very subject. With a sample size of 50 patients, the study was done to determine the existence of correlation between MPV and ischemic stroke as well as to and to ascertain the role of MPV in the severity of ischemic cerebrovascular stroke.[4] Our study showed t no correlation between CRP and MPV in ischemic stroke subjects.
The Chinese study in 2017 helmed by Zhang J made a meta-analytic systematic summary of the prognostic role of NLR in patients with ischemic stroke. The essence of the study throw a light on the fact that increased NLR was associated not only with poor functional outcome at 3 months, but also with an increased risk of developing symptomatic Intracranial Hemorrhage (sICH).[5] Our study showed t no correlation between CRP and N/L Ratio and MPV in ischemic stroke subjects.
Singh AS, et al., helmed a study in which the assimilation of ESR was corresponded with other markers of carotid atherosclerosis ischemic stroke patients. In this study to correspond with ESR, other biomarkers such as Fibrinogen levels ,Carotid ultrasound (CIMT) were employed.This investigation which was conducted over a period of 1 year with a sample size of 92 patients concluded that ESR and serum fibrinogen, another inflammatory marker share a significant positive correlation (r=0.81, p<0.0001).[6] The association between the laboratory marker of systemic inflammation (IMT of carotid artery) and ESR showed significant association (p<0.001) and a similar result was seen between ESR and carotid plaque (p=0.026). Both of the above are non-invasive measures of atherosclerosis.[6] our study showed there is no correlation between CRP and ESR in ischaemic stroke subjects.
The work of Emsley, et al., proved that ischemic stroke is the most common pathological condition in both stroke and nonstroke patients in whom an increased ESR values were observed. This study emboldened the fact that ESR, which can detect the progression of atherosclerosis evolving into ischemic stroke, can be associated with CIMT and carotid plaque.[6]
An Italian prospective study conducted in 2001, which was helmed by Mario Di Napoli and colleagues aimed at analyzing the correlation between the measurements of CRP values and stroke. The CRP values were measured immediately and at different times after stroke, and the 1-year outcome.[7]
A total of 193 patients were included in the study who were indentified with characteristics attributing to ischemic stroke, 128 of them were kept in the derivation group and the rest 65 in the validation set.[7]
A secondary preventive treatment with aspirin (50%) was provided to the patients during the follow-up period, ticlopidine (22%) or warfarin (28%), with a strict control of recognized vascular risk factors. During discharge, it was witnessed that increased CRP levels were associated with larger infarcts (64.6% vs. 39.7%; p=0.0047).[7]
The study showed that the incidence of combined endpoint at 1-year follow-up and the CRP level at admission was related. (Hazard Ratio [HR]: 2.78, 95% CI: 1.45–5.33; p=0.0021) and discharge (HR 9.42, 95% CI 4.27–19.05; p<0.0001).
However our study showed there is no correlation between CRP and ESR in ischaemic stroke subjects.
The 2014 Korean study helmed by Lee JH aimed at analyzing the associations found within the platelet indices, Neutrophil-to-lymphocyte Ratio (NLR), ESR when compared with CRP in patients with cerebral infarction. This retrospective study analyzed 516 cerebral infarction patients and their CRP levels were compared with MPV, MPV/PC ratio, NLR and ESR. The resulting CRP was analyzed and it showed significance with MPV, NLR and ESR correlations (MPV: p=0.088, p=0.045), (NLR: p=0.4, p<0.001) and (ESR: p=0.468, p<0.001) (Figure 6).[8,9]
Nevertheless, the significance was absent in the correlation found between CRP and MPV/PC (p=0.016, p=0.711) in patients with cerebral infarction. The data was subjected to Pearson correlation test despite the abnormal distributions of the analyzed parameters. Here, the CRP was significantly correlated with MPV/PC (r=0.164, p<0.001), NLR (r=0.517, p<0.001) and ESR (r=0.479, p<0.001) in patients with cerebral infarction but the same was not seen between CRP and MPV (r=0.068, p=0.121).[9]
The study pioneered in establishing the correlation between MPV, NLR and ESR with CRP in a moderate number of cerebral infarction patients.
In our study MPV, NLR and ESR were elevated in ischemic stroke patients, but it showed no significant linear correlation with CRP in patients with cerebral infarction. Further well-designed and large-scale prospective studies are warranted to evaluate platelet indices or NLR for monitoring patients with cerebral infarction.
CONCLUSION:
Cerebrovascular diseases include some of the most common and devastating disorders. Stroke is the second leading cause of death worldwide. Ischemic stroke constitute 85% of the stroke.
Most inflammatory reactions are mediated by cytokines, expressed by many cells in response to acute cerebral ischemia.
Cytokine release results in activation of leuckocytes, increase in CRP and activation of platelets which all leads to conversion of local endothelium to a prothrombotic state.
Erythrocyte sedimentation rate (ESR), a classical acute-phase marker, was often compared with CRP. MPV/platelet count (PC) ratios have clinical indications in various conditions such as atherosclerosis, cerebral infarctionand active inflammatory diseases; neutrophil-to-lymphocyte ratio (NLR) parameter was reported to be an important measure of systemic inflammation.
MPV, NLR and ESR may be useful parameters for evaluating patients with cerebral infarction compared with CRP. MPV or NLR are cost-effective and simple parameters that can be attainable by using an automatic haematology analyser.
Our study aimed to investigate the associations between platelet indices, neutrophil-to-lymphocyte ratio (NLR) and erythrocyte sedimentation rate (ESR) compared with CRP in patients with cerebral infarction.
We included 65 subjects in our study as per inclusion and exclusion crieteria after informed consent, Sample for analysis of parameters is taken within 24hrs and analysed within 4hrs from sampling.
We found that ESR, CRP, MPV and N/L ratio was elevated in patients with ischemic stroke, but there was no linear correlation between these parameters.
Further well-designed studies are warranted to understand the exact meaning of ESR, MPV and N/L ratio in monitoring of patients with cerebral infarction.
REFERENCES:
1. Kamalakannan S, Gudlavalleti ASV, Gudlavalleti VSM, et al. Incidence & prevalence of stroke in India: A systematic review. Indian J Med Res 2017;146(2):175-85.
2. Dalal PM. Burden of stroke: Indian perspective. Int J Stroke 2006;1(3):164-6.
3. Sierra C, Coca A, Schiffrin EL, et al. Vascular mechanisms in the pathogenesis of stroke. Curr Hypertens Rep 2011;13(3):200-7.
4. Patel V, Parmar M, Shah K, et al. A study on mean platelet volume in ischemic cerebrovascular stroke. Int J Adv Med 2018;5(2):316-20.
5. Zhang J, Ren Q, Song Y, et al. Prognostic role of neutrophil–lymphocyte ratio in patients with acute ischemic stroke. Medicine (Baltimore) 2017;96(45):e8624.
6. Singh AS, Atam V, Yathish BE, et al. Role of erythrocyte sedimentation rate in ischemic stroke as an inflammatory marker of carotid atherosclerosis. J Neurosci Rural Pract 2014;5(1):40-5.
7. Di Napoli M, Papa F, Bocola V. C-reactive protein in ischemic stroke: an independent prognostic factor. Stroke 2001;32(4):917–924.
8. den Hertog HM, van Rossum JA, van der Worp HB, et al. C-reactive protein in the very early phase of acute ischemic stroke: association with poor outcome and death. J Neurol 2009;256(12):2003-8.
9. Lee JH, Kwon KY, Yoon SY, et al. Characteristics of platelet indices, neutrophil-to-lymphocyte ratio and erythrocyte sedimentation rate compared with C reactive protein in patients with cerebral infarction: a retrospective analysis of comparing haematological parameters and C reactive protein 2014;4(11):e006275.