Progressive Dyslipidemia Across Stages of Chronic Kidney Disease: Association with Disease Severity and Dialysis Dependency
- Geetanshu Kapoor , Junior Resident, Internal Medicine, VCSGGMC&RI, Srikot, Srinagar, Uttrakhand.
- Dilwer , Ex-Assistant Professor, General Medicine, VCSGGMC&RI, Srikot, Srinagar, Uttrakhand,
- Yogesh Kumar , Assistant Professor,General Medicine, SGRRIM&HS, Dehradun.
- Ranjeet Yadav , Senior Resident,General Medicine, VCSGGMC&RI, Srikot, Srinagar, Uttrakhand,
Article Information:
Abstract:
Background: Chronic kidney disease (CKD) is frequently associated with disturbances in lipid metabolism, which contribute significantly to the increased cardiovascular risk observed in these patients. Dyslipidemia in CKD is characterized by alterations in various lipid parameters that may worsen with declining renal function. The present study aimed to evaluate lipid profile alterations across different stages of chronic kidney disease. Materials and Methods: This hospital-based cross-sectional study included 115 patients diagnosed with CKD. Patients were categorized into Stage 3b, Stage 4, and Stage 5 CKD based on estimated glomerular filtration rate (eGFR). After overnight fasting, blood samples were collected for analysis of lipid profile parameters including total cholesterol, triglycerides, HDL, LDL, and VLDL using standard biochemical methods. Statistical analysis was performed to compare lipid parameters among CKD stages, and p < 0.05 was considered statistically significant. Results: Most patients were in Stage 5 CKD (79.13%), followed by Stage 4 (13.04%) and Stage 3b (7.83%). Serum triglyceride and VLDL levels increased significantly with advancing CKD stages (p < 0.0001), whereas HDL levels showed a significant decrease (p < 0.0001). Total cholesterol and LDL levels increased gradually but did not show statistically significant differences. Conclusion: CKD is associated with progressive dyslipidemia characterized by elevated triglycerides and VLDL levels and reduced HDL concentrations. Early detection and management of lipid abnormalities may help reduce cardiovascular risk in CKD patients.
Keywords:
Article :
INTRODUCTION:
Chronic kidney disease (CKD) is a major global public health problem characterized by a progressive and irreversible decline in renal function over time. It is defined as abnormalities of kidney structure or function persisting for more than three months, with implications for health (1). CKD is associated with significant morbidity and mortality and represents an increasing burden on healthcare systems worldwide. The rising prevalence of diabetes mellitus, hypertension, obesity, and aging populations has contributed substantially to the growing incidence of CKD globally (2).
One of the most important complications of CKD is the increased risk of cardiovascular disease, which remains the leading cause of death in patients with renal impairment. Studies have demonstrated that individuals with CKD have a markedly higher risk of cardiovascular morbidity and mortality compared with the general population (3). This elevated cardiovascular risk is attributed to several metabolic and physiological abnormalities associated with renal dysfunction.
Among these abnormalities, dyslipidemia plays a crucial role in the pathogenesis of atherosclerosis in CKD patients. Lipid metabolism is significantly altered in chronic kidney disease, resulting in characteristic changes in serum lipid profile. These alterations often include elevated triglycerides, increased very low-density lipoprotein (VLDL), decreased high-density lipoprotein (HDL), and variable changes in low-density lipoprotein (LDL) and total cholesterol levels (4). Such lipid abnormalities contribute significantly to the development and progression of cardiovascular disease in CKD patients.
The mechanisms responsible for dyslipidemia in CKD are complex and multifactorial. Impaired activity of lipoprotein lipase and hepatic lipase, increased hepatic synthesis of triglyceride-rich lipoproteins, and decreased clearance of circulating lipoproteins contribute to abnormal lipid metabolism in these patients (5). In addition, oxidative stress, chronic inflammation, and alterations in apolipoprotein metabolism further exacerbate lipid abnormalities in CKD (6).
Previous studies have reported that lipid abnormalities become more pronounced as renal function declines. Patients with advanced stages of CKD often demonstrate higher triglyceride levels, reduced HDL concentrations, and increased atherogenic lipid ratios, which significantly increase their risk of cardiovascular complications (7,8). Therefore, evaluation of lipid profile alterations across different stages of CKD is important for early identification of patients at high cardiovascular risk.
Understanding the pattern of lipid abnormalities in CKD may help clinicians implement early preventive and therapeutic strategies to reduce cardiovascular morbidity and mortality in this vulnerable population. Therefore, the present study was undertaken to evaluate lipid profile alterations across different stages of chronic kidney disease and to assess the relationship between CKD severity and changes in major lipid parameters including total cholesterol, triglycerides, HDL, LDL, and VLDL (9).
METHODOLOGY:
The present study was a hospital-based cross-sectional observational study conducted in the Department of Biochemistry in collaboration with the Department of Medicine at a tertiary care teaching hospital. The study included 115 patients diagnosed with chronic kidney disease (CKD) attending the outpatient and inpatient departments. Ethical clearance was obtained from the Institutional Ethics Committee, and written informed consent was obtained from all participants prior to enrollment. Patients were classified into different stages of CKD based on their estimated glomerular filtration rate (eGFR) according to standard clinical guidelines.
Patients aged 18 years and above with confirmed CKD were included in the study. Individuals with acute kidney injury, chronic liver disease, hypothyroidism, nephrotic syndrome, or those receiving lipid-lowering medications were excluded in order to avoid confounding effects on lipid metabolism. Clinical and demographic details of the participants were recorded, and patients were categorized into Stage 3b, Stage 4, and Stage 5 CKD according to their eGFR values.
After an overnight fasting period of 8–12 hours, approximately 5 mL of venous blood was collected under aseptic conditions. The blood samples were centrifuged to obtain serum, which was used for biochemical analysis. Serum lipid profile parameters including total cholesterol, triglycerides, and high-density lipoprotein (HDL) were measured using standard enzymatic methods on an automated analyzer. Low-density lipoprotein (LDL) and very low-density lipoprotein (VLDL) were calculated using standard formulas. The collected data were analyzed statistically, and results were expressed as mean ± standard deviation, with comparisons between CKD stages performed using appropriate statistical tests. A p-value <0.05 was considered statistically significant.
RESULTS:
Table 1: Distribution of Study Participants According to CKD Stage
|
CKD Stage |
Number of Patients (n) |
Percentage (%) |
|
Stage 3b |
9 |
7.83 |
|
Stage 4 |
15 |
13.04 |
|
Stage 5 |
91 |
79.13 |
|
Total |
115 |
100 |
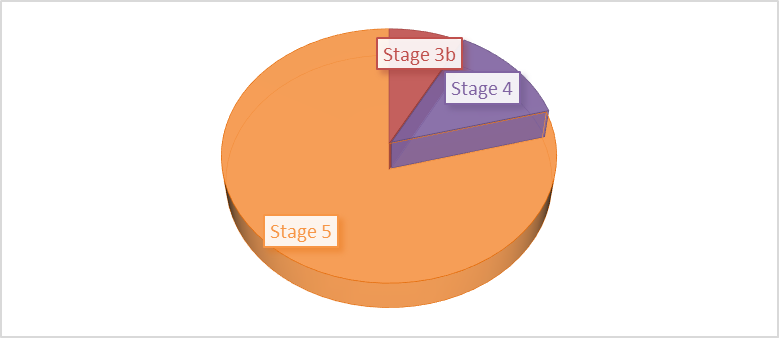
Fig 1: Distribution of Study Participants According to CKD Stage.
A total of 115 patients diagnosed with chronic kidney disease (CKD) were included in the present study. The distribution of participants according to CKD stage is presented in Table 1. The majority of patients were classified as Stage 5 CKD, comprising 91 patients (79.13%), followed by Stage 4 CKD with 15 patients (13.04%), while Stage 3b CKD accounted for 9 patients (7.83%). Thus, the study population was predominantly composed of individuals with advanced CKD.
Table 2: Lipid Profile and Atherogenic Indices Across Different CKD Stages
|
Parameter |
Stage 3b (n=9) Mean ± SD |
Stage 4 (n=15) Mean ± SD |
Stage 5 (n=91) Mean ± SD |
p-value |
|
Total Cholesterol (mg/dL) |
151.77 ± 18.80 |
156.73 ± 26.16 |
165.56 ± 29.85 |
0.25 |
|
Triglycerides (mg/dL) |
113.66 ± 10.57 |
130.26 ± 18.19 |
164.29 ± 11.66 |
<0.0001 |
|
VLDL (mg/dL) |
22.73 ± 2.10 |
26.05 ± 3.63 |
32.85 ± 2.33 |
<0.0001 |
|
HDL (mg/dL) |
49.22 ± 3.38 |
43.66 ± 7.02 |
35.08 ± 5.20 |
<0.0001 |
|
LDL (mg/dL) |
81.15 ± 17.67 |
87.01 ± 27.28 |
97.61 ± 31.84 |
0.17 |
|
Cholesterol/HDL Ratio |
3.08 ± 0.34 |
3.73 ± 1.23 |
4.87 ± 1.35 |
<0.0001 |
|
LDL/HDL Ratio |
1.64 ± 0.34 |
2.11 ± 1.06 |
2.91 ± 1.22 |
0.001 |
The comparison of lipid profile parameters across different stages of CKD is summarized in Table 2. Mean total cholesterol levels demonstrated a gradual increase with advancing CKD stage, rising from 151.77 ± 18.80 mg/dL in Stage 3b to 156.73 ± 26.16 mg/dL in Stage 4 and 165.56 ± 29.85 mg/dL in Stage 5. However, the difference in total cholesterol levels across CKD stages did not reach statistical significance (p = 0.25). In contrast, serum triglyceride levels showed a significant increase with CKD progression. The mean triglyceride concentration increased from 113.66 ± 10.57 mg/dL in Stage 3b to 130.26 ± 18.19 mg/dL in Stage 4 and 164.29 ± 11.66 mg/dL in Stage 5, and this difference was highly statistically significant (p < 0.0001). Similarly, serum VLDL levels increased progressively across CKD stages, with mean values of 22.73 ± 2.10 mg/dL in Stage 3b, 26.05 ± 3.63 mg/dL in Stage 4, and 32.85 ± 2.33 mg/dL in Stage 5, demonstrating a highly significant difference between groups (p < 0.0001). Conversely, HDL levels decreased significantly with increasing severity of CKD. Patients with Stage 3b CKD had the highest mean HDL level (49.22 ± 3.38 mg/dL), which declined to 43.66 ± 7.02 mg/dL in Stage 4 and further to 35.08 ± 5.20 mg/dL in Stage 5. This reduction in HDL concentration across CKD stages was statistically highly significant (p < 0.0001). Although LDL levels demonstrated a gradual increase across CKD stages, from 81.15 ± 17.67 mg/dL in Stage 3b to 87.01 ± 27.28 mg/dL in Stage 4 and 97.61 ± 31.84 mg/dL in Stage 5, the difference was not statistically significant (p = 0.17). To further assess cardiovascular risk, atherogenic lipid indices were analyzed across CKD stages. The cholesterol-to-HDL ratio increased progressively with CKD severity, rising from 3.08 ± 0.34 in Stage 3b to 3.73 ± 1.23 in Stage 4 and 4.87 ± 1.35 in Stage 5, with the difference being highly statistically significant (p < 0.0001). Similarly, the LDL-to-HDL ratio demonstrated a significant upward trend, increasing from 1.64 ± 0.34 in Stage 3b to 2.11 ± 1.06 in Stage 4 and 2.91 ± 1.22 in Stage 5, and this variation across CKD stages was statistically significant (p = 0.001).
Table 3A: Distribution of Dialysis Frequency According to CKD Grade.
|
Dialysis Frequency |
Stage 3b (n=9) n (%) |
Stage 4 (n=15) n (%) |
Stage 5 (n=91) n (%) |
Total (n=115) |
p-value |
|
N.A (No Dialysis) |
9 (100.00) |
0 (0.00) |
0 (0.00) |
9 |
<0.001 |
|
Twice/Week |
0 (0.00) |
3 (4.48) |
64 (95.52) |
67 |
|
|
Thrice/Week |
0 (0.00) |
12 (30.77) |
27 (69.23) |
39 |
|
|
Total |
9 (7.83) |
15 (13.04) |
91 (79.13) |
115 |
Table 3B: Mean Dialysis Frequency (per week).
|
CKD Stage |
Mean ± SD |
|
Stage 3b |
0 ± 0 |
|
Stage 4 |
2.00 ± 0.82 |
|
Stage 5 |
2.28 ± 0.51 |
|
Overall |
2.27 ± 0.98 |
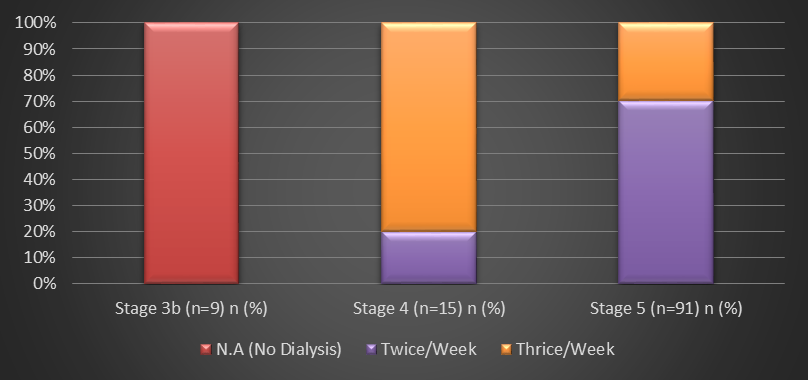
Fig 2: Distribution of dialysis frequency according to CKD stage.
The distribution of dialysis frequency according to CKD stage is presented in Table 3. All patients in Stage 3b CKD were not on dialysis (100%), whereas patients in advanced stages required regular dialysis. In Stage 4 CKD, 4.48% of patients underwent dialysis twice weekly and 30.77% underwent dialysis thrice weekly. In Stage 5 CKD, the majority of patients were on dialysis, with 95.52% receiving dialysis twice weekly and 69.23% undergoing thrice-weekly dialysis. The association between CKD stage and dialysis frequency was found to be highly statistically significant (p < 0.001). Furthermore, the mean dialysis frequency increased with disease severity, from 0 ± 0 sessions per week in Stage 3b to 2.00 ± 0.82 in Stage 4 and 2.28 ± 0.51 in Stage 5, indicating a progressive rise in dialysis dependency with advancing CKD.
DISCUSSION:
Chronic kidney disease (CKD) is a progressive disorder characterized by gradual loss of renal function and is frequently associated with metabolic abnormalities, particularly disturbances in lipid metabolism. Dyslipidemia is a common finding in CKD and contributes significantly to the development of accelerated atherosclerosis. Consequently, patients with CKD have a markedly increased risk of cardiovascular disease, which remains the leading cause of morbidity and mortality in this population. Previous studies have shown that cardiovascular complications are significantly more prevalent among CKD patients compared with the general population (10,11).
In the present study, the distribution of patients according to CKD stage revealed that the majority of participants were in advanced stages of the disease. Stage 5 CKD accounted for the largest proportion of patients (79.13%), followed by Stage 4 (13.04%) and Stage 3b (7.83%). This predominance of advanced CKD stages is consistent with observations reported in hospital-based studies where patients often present late due to lack of early screening and delayed diagnosis (12).
The present study demonstrated progressive alterations in lipid profile parameters with increasing severity of CKD. Mean total cholesterol levels showed a gradual increase from Stage 3b to Stage 5; however, this increase was not statistically significant. Similar findings have been reported in earlier studies where total cholesterol levels did not show a consistent or significant change across different stages of CKD (13). This variability may be explained by factors such as malnutrition, chronic inflammation, and altered hepatic lipid metabolism commonly observed in advanced renal disease.
In contrast, serum triglyceride levels showed a significant increase with advancing stages of CKD in the present study. A similar pattern was also observed for very low-density lipoprotein (VLDL) levels, which increased significantly with worsening renal function. These findings are in agreement with previous studies that have reported elevated triglyceride and VLDL concentrations in CKD patients (14,15). The underlying mechanism is believed to involve reduced activity of lipoprotein lipase and hepatic lipase, leading to impaired clearance of triglyceride-rich lipoproteins, along with increased hepatic synthesis of VLDL.
High-density lipoprotein (HDL) levels in the present study showed a significant decline with increasing CKD severity. Patients with Stage 3b CKD had the highest mean HDL levels, which decreased progressively in Stage 4 and Stage 5 disease. Similar findings have been reported in several previous studies where reduced HDL concentrations were associated with declining renal function and increased cardiovascular risk in CKD patients (16,17). Reduced HDL levels in CKD may be attributed to impaired synthesis of apolipoprotein A-I, decreased reverse cholesterol transport, and oxidative modification of HDL particles.
Although low-density lipoprotein (LDL) levels showed an increasing trend across CKD stages in the present study, the difference was not statistically significant. Comparable results have been reported in earlier investigations where LDL levels remained relatively unchanged despite progressive renal impairment, although qualitative alterations such as the formation of small dense LDL particles may contribute to increased atherogenicity (18).
In addition to conventional lipid parameters, the present study also assessed atherogenic lipid ratios, which are considered important indicators of cardiovascular risk. The cholesterol-to-HDL ratio and LDL-to-HDL ratio increased significantly with advancing CKD stages. These findings suggest that worsening renal function is associated with a progressively more atherogenic lipid profile. Similar observations have been reported in previous studies demonstrating that lipid ratios are strong predictors of cardiovascular risk in patients with CKD (19).
An important finding of the present study was the significant association between CKD stage and dialysis frequency, with a clear increase in dialysis dependency observed in advanced stages of the disease. All patients in Stage 3b CKD were managed conservatively without dialysis, whereas the majority of patients in Stage 5 CKD required regular dialysis, predominantly on a twice- or thrice-weekly basis. This progressive increase in dialysis requirement reflects the severity of renal impairment and declining glomerular filtration rate. Notably, the escalation in dialysis frequency observed in advanced CKD stages paralleled the worsening of dyslipidemia, particularly the marked elevation in triglyceride and VLDL levels and the reduction in HDL concentrations.
The interplay between dialysis and lipid metabolism is complex and multifactorial. Hemodialysis has been shown to significantly influence lipid homeostasis through mechanisms such as reduced lipoprotein lipase activity, chronic inflammation, oxidative stress, and repeated exposure to dialysis-related factors, all of which contribute to impaired clearance of triglyceride-rich lipoproteins and reduced HDL levels (20,21). Studies comparing CKD patients on conservative management and those undergoing hemodialysis have demonstrated significantly higher triglyceride and VLDL levels along with lower HDL concentrations in dialysis-dependent patients, indicating a more atherogenic lipid profile (22,23).
Furthermore, uremic dyslipidemia in advanced CKD is characterized by accumulation of triglyceride-rich lipoproteins, increased VLDL, and decreased HDL levels, which persist even in patients undergoing dialysis (24). Although dialysis may partially improve certain lipid parameters in some cases, the overall dyslipidemic pattern remains largely pro-atherogenic, particularly in end-stage renal disease (25). The higher atherogenic lipid ratios observed in Stage 5 CKD patients in the present study may therefore be attributed to the combined effects of severe renal dysfunction and dialysis-related metabolic alterations.
Overall, the findings of the present study indicate that CKD is associated with characteristic alterations in lipid metabolism, including elevated triglyceride and VLDL levels, reduced HDL concentrations, and increased atherogenic lipid ratios. These abnormalities become more pronounced as renal function declines and may contribute significantly to the increased cardiovascular risk observed in CKD patients. Early identification and management of dyslipidemia in CKD patients may therefore play an important role in reducing cardiovascular morbidity and improving overall clinical outcomes.
CONCLUSION:
The present study demonstrated that chronic kidney disease is associated with significant alterations in lipid metabolism, which become more pronounced with advancing stages of the disease. Patients with advanced CKD showed significantly elevated triglyceride and VLDL levels along with a marked reduction in HDL concentrations, while total cholesterol and LDL levels exhibited a gradual but non-significant increase. These findings indicate the presence of a progressively atherogenic lipid profile in patients with worsening renal function.The observed dyslipidemia in CKD patients may contribute substantially to the increased cardiovascular risk associated with renal impairment. Elevated triglycerides, reduced HDL levels, and increased atherogenic lipid ratios may promote the development of atherosclerosis and cardiovascular complications in these patients. Therefore, early evaluation and regular monitoring of lipid profile in CKD patients are essential for identifying individuals at higher cardiovascular risk. Timely management of dyslipidemia may help reduce cardiovascular morbidity and improve overall clinical outcomes in patients with chronic kidney disease..
REFERENCES:
1. Chen TK, Knicely DH, Grams ME. Chronic kidney disease diagnosis and management. JAMA. 2019;322(13):1294–1304.
2. Levey AS, Coresh J, Balk E, Kausz AT, Levin A, Steffes MW, et al. National Kidney Foundation practice guidelines for chronic kidney disease: evaluation, classification, and stratification. Am J Kidney Dis. 2003;39(Suppl 1):S1–266.
3. Bello AK, Alrukhaimi M, Ashuntantang GE, et al. Complications of chronic kidney disease: current state, knowledge gaps, and strategy for action. Kidney Int Suppl. 2017;7(2):122–129.
4. Mikolasevic I, Žutelija M, Mavrinac V, Orlic L. Dyslipidemia in patients with chronic kidney disease: etiology and management. Int J Nephrol Renovasc Dis. 2017;10:35–45.
5. Chen SC, Tseng CH. Dyslipidemia, kidney disease, and cardiovascular disease in diabetic patients. Rev Diabet Stud. 2013;10(2-3):88-100.
6. Podkowińska A, Formanowicz D. Chronic kidney disease as oxidative stress- and inflammatory-mediated cardiovascular disease. Antioxidants. 2020;9(8):752.
7. Rao AM, Bitla AR, Reddy EP, Sivakumar V, Rao PVLS. Lipid abnormalities and apoprotein pattern in non-dialyzed chronic kidney disease patients. Indian J Clin Biochem. 2010;25(1):47-50.
8. Noor S, Zuberi NA, Fatima F, Iqbal T, Khalilullah. Status of lipid profile in different stages of chronic kidney disease. Ann Abbasi Shaheed Hosp Karachi Med Dent Coll. 2014;19(2):62-66.
9. Garg G, Chawla SPS, Kaur S. Clinical study of dyslipidemia in patients with chronic kidney disease. Int J Bioassays. 2015;4(3):3732-3737.
10. Foley RN, Parfrey PS, Sarnak MJ. Clinical epidemiology of cardiovascular disease in chronic renal disease. Am J Kidney Dis. 1998;32(Suppl 3):S112-S119.
11. Sarnak MJ, Levey AS. Cardiovascular disease and chronic renal disease. Circulation. 2003;108(17):2154-2169.
12. Hill NR, Fatoba ST, Oke JL, et al. Global prevalence of chronic kidney disease: a systematic review and meta-analysis. PLoS One. 2016;11:e0158765.
13. Wanner C, Krane V. Lipid metabolism in patients with chronic kidney disease. Nat Rev Nephrol. 2011;7:177-187.
14. Ahmad N, Agarwal S, Chauhan A, Khrime D, Varma A. Lipid profile in chronic renal failure patients in a tertiary care hospital of Uttarakhand. Int J Sci Res. 2018;8(1).
15. Saini M, Vamne A, Kumar V, et al. Pattern of lipid profile in chronic kidney disease patients on conservative management and hemodialysis. Cureus. 2022;14(1):e21506.
16. Kumari KR, Srinivas B. Study of lipid profile in patients with chronic kidney disease. Int J Sci Study. 2018;6(7).
17. Karad BE, Dhanorkar SV. Lipid profile disorders in chronic kidney disease patients undergoing hemodialysis. MedPulse Int J Med. 2018;6(1):8-10.
18. Chan DC, Watts GF. Dyslipidemia in chronic kidney disease: pathophysiology and management. Nat Rev Nephrol. 2010;6:315-326.
19. Kosmas CE, Rodriguez-Polanco S, Bousvarou MD, Papakonstantinou EJ, Peña Genao E, Guzman E, et al. Triglyceride/HDL-cholesterol ratio as a marker of cardiovascular risk. Diagnostics. 2023;13(5):929.
20. Influence of kidney diseases on lipid profile in patients undergoing hemodialysis. Biomed Pharmacol J. 2023;17(3):xxxx–xxxx.
21. Florens N, Calzada C, Delmas-Beauvieux MC, et al. Lipid metabolism disturbances in chronic kidney disease patients undergoing hemodialysis. Nutrients. 2019;11(11):2820.
22. Singh S, Pathak AK, Parappanavar NU. Study of fasting lipid profile in patients with chronic kidney disease. Int J Res Med Sci. 2019;7(6):xxxx–xxxx.
23. Saini M, Vamne A, Kumar V, et al. Pattern of lipid profile in chronic kidney disease patients on conservative management and hemodialysis. Cureus. 2022;14(1):e21506.
24. Mikolasevic I, Žutelija M, Mavrinac V, Orlic L. Dyslipidemia in patients with chronic kidney disease: etiology and management. Int J Nephrol Renovasc Dis. 2017;10:35–45.
25. Saini M, Kumar V, et al. Evaluation of lipid profile in pre- and post-dialysis patients with end-stage renal disease. Cureus. 2021;13(10):e19023.