THE ASSOCIATION BETWEEN MICROCYTIC ANEMIA AND GLYCOSYLATED HEMOGLOBIN (HbA1c) IN NON-DIABETIC ADULTS
- Venkata Shravan. Vuyyala , Assistant Professor, Department of General medicine, Andhra Medical College, Visakhapatnam India.
- Chelluri Anil Kumar , Assistant Professor,General Medicine Department, Andhra Medical College, Visakhapatnam India.
Article Information:
Abstract:
Background: Diabetes mellitus is a metabolic disorder characterized by chronic hyperglycemia resulting from defects in insulin secretion, insulin action, or both. This condition leads to disturbances in carbohydrate, fat, and protein metabolism. Objective: To determine whether HbA1c levels are elevated among non-diabetic patients with anemia. Methods: This Case control study was conducted in the Department of General Medicine, Andhra Medical College, King George Hospital, Visakhapatnam – 530002. Ethical clearance was taken from IEC of institute. Duration of study was 12 months (January 2024 to December 2024). Result: HbA1c levels were significantly higher among non-diabetic adults with microcytic anemia compared to controls. Mean Corpuscular Volume (MCV) showed a strong negative correlation with HbA1c (r = −0.885, p < 0.00001). Lower MCV was associated with falsely elevated HbA1c levels. Hemoglobin levels and MCV were significantly lower among cases compared to controls. Conclusion: These findings highlight the potential inaccuracy of using HbA1c alone to assess glycemic control in anemic individuals. Careful evaluation of iron status and red blood cell indices is recommended before interpreting HbA1c results in clinical practice.
Keywords:
Article :
INTRODUCTION:
The long-term complications of diabetes are broadly categorized into microvascular and macrovascular complications. Microvascular complications include retinopathy, nephropathy, and neuropathy, while macrovascular complications encompass cardiovascular, peripheral arterial, and cerebrovascular diseases.
The increasing prevalence of diabetes among the global workforce has significant implications for individual productivity and national economies. The socioeconomic burden of diabetes and its complications is substantial, affecting both developed and developing countries.
Early diagnosis of diabetes is crucial to prevent the development of complications and to improve the quality of life of affected individuals. The potential utility of glycated hemoglobin (HbA1c) in the diagnosis of diabetes was first recognized in a 1985 WHO report (1). Subsequent reviews, including a joint WHO and International Diabetes Federation (IDF) expert consultation in 2005, have evaluated and updated recommendations on the use of HbA1c for diagnosing diabetes (1).
HbA1c is formed through a non-enzymatic glycation process where glucose molecules bind to the N-terminal valine of the β-chains of the hemoglobin molecule. This process reflects the average blood glucose levels over the preceding 8 to 12 weeks, providing clinicians with an integrated measure of a patient's glycemic control. Elevated HbA1c levels are associated with an increased risk of diabetes- related complications (2). Therefore, maintaining HbA1c levels below specific targets is essential in diabetes management. The American Diabetes Association (ADA) recommends that HbA1c levels be maintained below 7% in diabetic patients to reduce the risk of microvascular complications (3).
Chronic hyperglycemia leads to increased non-enzymatic glycation of hemoglobin, which can adversely affect protein structure and function. The extent of hemoglobin glycation is influenced by both the concentration of blood glucose and the lifespan of red blood cells (4).
Recent studies have indicated that factors other than blood glucose levels, such as iron deficiency anemia (IDA), can affect HbA1c measurements. IDA, the most common form of microcytic anemia, may lead to falsely elevated HbA1c levels, potentially resulting in misdiagnosis or inappropriate management of diabetes (5,6).
India, often referred to as the diabetes capital of the world, has a high prevalence of both diabetes and microcytic anemia(7). This overlap necessitates careful interpretation of HbA1c levels to prevent false diagnoses. Therefore, it is imperative to assess and correct anemia before making diagnostic or therapeutic decisions based on HbA1c levels.
This study aims to determine whether HbA1c levels are elevated among non-diabetic patients with anemia. If a significant association is found, it would underscore the importance of correcting anemia prior to relying on HbA1c for diagnostic or therapeutic purposes.
MATERIALS AND METHODS:
Medicine, Andhra Medical College, King George Hospital, Visakhapatnam – 530002. Ethical clearance was taken from IEC of institute. Duration of study was 12 months (January 2024 to December 2024).
SAMPLE SIZE:
100 cases.
100 controls.
INCLUSION CRITERIA:
1. Confirmed cases of microcytic anemia as evidenced by:
a. Hb< 12 g/dl (women); < 13 g/dl (men)
b. MCV < 80 fl.
c. Peripheral smear showing microcytosis
2. Non-diabetic individuals with FBS<100mg/dl, PPBS<140mg/dl 3.Age>18years.
EXCLUSION CRITERIA:
1.Acuteblood loss
2.Hemolytic anemia
3.Hemoglobinopathies
4.Individuals diagnosed with diabetes
5.Chronic kidney disease
6.Pregnancy
7.Age<18years
8.Any other form of RBC morphology except microcytosis.
SELECTION OF CASES:
Patients in the general medical ward meeting the inclusion and exclusion criteria were selected for the study.
SELECTION OF CONTROLS:
Age and sex matched subjects who did not have microcytic anemiabut still meeting the exclusion criteria were selected as subjects.
DATA COLLECTION AND METHODS:
A total of 100 cases and 100 controls from general medical ward are selected according to inclusion and exclusion criteria and patients were subjected to following investigations:
1. Complete hemogram
2. Peripheral smear study
3. Fasting blood glucose (FBG)
4. Post Prandial Blood Glucose (PPBG)
5. Glycosylated hemoglobin (HbA1c)
6. Direct coombs test.
HbA1c levels was compared between both the groups and its correlation with microcytic anemia was calculated.
STATISTICAL ANALYSIS:
Data were entered into a Microsoft Excel spreadsheet and analyzed using the Epidemiological Information Package 2002 (Epi Info 2002), developed by the Centers for Disease Control and Prevention (CDC), Atlanta, in association with the World Health Organization (WHO). Statistical measures, including range, median, mean, standard deviation, and 'p' values, were calculated using this software. The Chi-square test was used to determine statistical significance between groups, considering a 'p' value below 0.05 as statistically significant.
RESULTS:
Cases were anemic patients, defined by Hb< 12 g/dl (for females) and < 13 g/dl (for males). Controls were non – anemic subjects.
Majority (63%) were aged between 40-60 years, indicating that microcytic anemia predominantly affects middle-aged adults.Younger adults (20-40 years) constituted 23%, whereas older adults (60-80 years) were 14% of cases, highlighting a decreasing trend with advancing age.
Controls were more evenly distributed across age groups, making them suitable for comparison. Notably, the comparative younger age of controls allows for clearer assessment of age-related impacts.
The distribution of cases each accounting was evenly balanced between males and females , with of the total 100 cases for 50%.
Among the control group , males comprised 51% and females 49%, demonstrating a near-equal distribution. This balanced representation in both groups minimizes sex-related bias and ensures that any observed associations between microcytic anemia and HbA1c levels are not confounded by gender differences. Such parity enhances the internal validity and generalizability of the study findings.
HbA1c LEVELS IN CASES:
Among the 100 non-diabetic adults with microcytic anemia include in the study, the mean HbA1c level was 7.00% ± 0.60. The majority of values fall between 6.8% to 7.5%.A small number of cases show values above 8.0%, suggesting false elevations. The distribution appears slightly right-skewed, indicating elevation beyond expected non-diabetic ranges.
TABLE 1: COMPARISION OF MEAN HbA1c BETWEEN CASES AND CONTROLS:
|
Group |
Mean HbA1c (%) |
Standard Deviation |
|
Cases |
7.00 |
0.60 |
|
controls |
5.41 |
0.19 |
The mean HbA1c level among non-diabetic adults with microcytic anemia (cases) was significantly higher (7.00 ± 0.60%) compared to healthy controls (5.41 ± 0.19%).The difference between the two groups was highly statistically significant (p < 0.00001, independent samples t-test), indicating that individuals with microcytic anemia exhibited significantly higher HbA1c levels compared to controls. This supports the hypothesis that microcytosis may lead to falsely elevated HbA1c readings, potentially overestimating glycemic control.
Table 2: COMPARISION OF MEAN MCV BETWEEN CASES AND CONTROLS:
|
GROUP |
Mean MCV (fL) |
Standard Deviation |
|
cases |
70.29 |
5.64 |
|
controls |
87.16 |
4.56 |
The mean MCV among non-diabetic adults with microcytic anemia (cases) was 70.29 ± 5.64 fL, while the mean MCV among healthy controls was 87.16 ± 4.56 fL. The difference in MCV between the two groups was statistically significant.
CORRELATION BETWEEN MCV AND HbA1c
A strong and statistically significant inverse correlation was observed between
MCV and HbA1c levels among non-diabetic adults with microcytic anemia (r = −0.89,p < 0.00001).
This indicates that as MCV decreases, HbA1c tends to increase, supporting the hypothesis that microcytosis may falsely elevate HbA1c levels. A higher proportion of individuals with HbA1c >6.5% were observed in the lower MCV ranges (50–70 fL), suggesting a potential association between microcytosis and elevated HbA1c values.Conversely, individuals with normal HbA1c were predominantly in the higher MCV ranges (81–90 fL and above 90 fL).
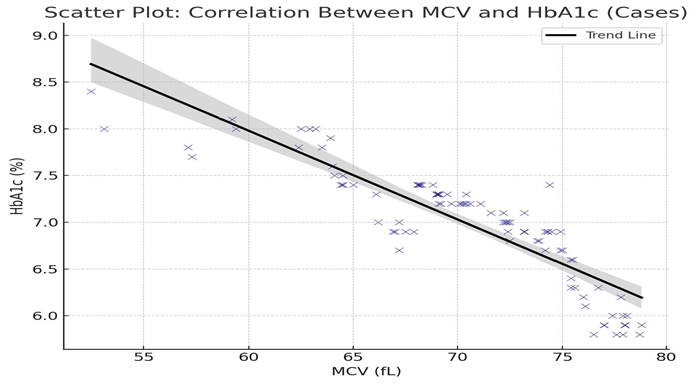
FIGURE 1:The scatter plot showing the inverse correlation between MCV and HbA1c in cases.Each point represents one individual.The black trend line clearly indicates that as MCV decreases, HbA1c increases.
The mean hemoglobin (Hb) level among non-diabetic adults with microcytic anemia was 9.98 ± 1.29 g/dL.
The mean hemoglobin level among controls was 13.60 ± 1.06 g/dL, indicating a normal hemoglobin range in the control group.
· Most individuals have Hb levels between 9–12 g/dL.
· Very
· few individuals fall below 7 g/dL or above 12 g/dL.
CORRELATION BETWEEN Hb AND MCV:
The scatter plot demonstrated a positive correlation between Hb and MCV values among the cases. This suggests that as hemoglobin levels increase, the mean corpuscular volume also tends to increase, and vice versa.
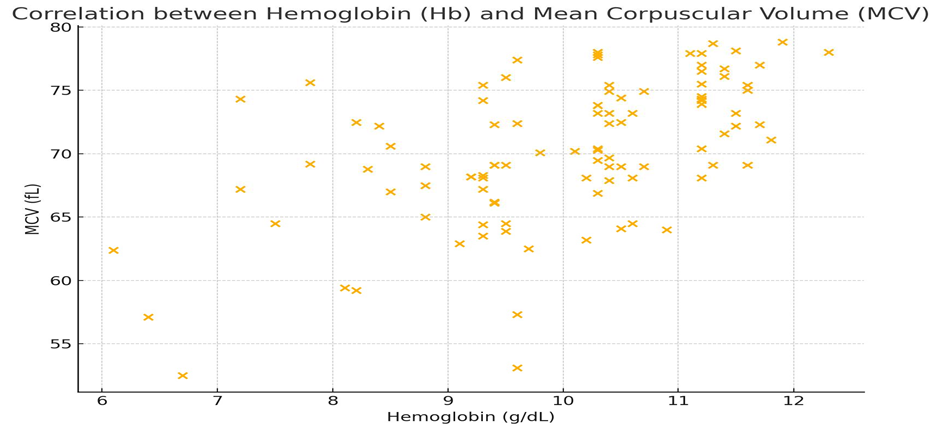
FIGURE 2 The Pearson correlation coefficient (r) was calculated to quantify this relationship.
The analysis revealed a strong positive correlation with an r-value of +0.849, which was statistically significant (p < 0.001).
Thus, these findings indicate that lower hemoglobin concentrations are generally associated with lower MCV values in individuals with microcytic anemia, further confirming the link between anemia severity and red blood cell size.
TABLE 3: SEVERITY OF ANEMIA AND HbA1c
|
Severity |
Mean_Hb |
Mean_HbA1c |
Count |
|
Mild |
10.89 |
6.79 |
57 |
|
Moderate |
8.94 |
7.23 |
40 |
|
Severe |
6.4 |
8 |
3 |
Anemia was categorized based on WHO criteria into mild (Hb 10.0–11.9 g/dL), moderate (Hb 7.0–9.9 g/dL), andsevere anemia (Hb <7.0 g/dL).
The mean HbA1c level was 6.79% among individuals with mild anemia, 7.23% in those with moderate anemia, and 8.00% among those with severe anemia.
A progressive increase in mean HbA1c levels was noted with increasing severity of anemia, suggesting that severe anemia may falsely elevate HbA1c values, thus affecting its reliability as a glycemic marker in non-diabetic individuals.
MEAN FBS AMONG CASES AND CONTROLS:
The mean fasting blood sugar (FBS) among cases was 84.21 ± 7.82 mg/dL, while among controls it was 79.26 ± 7.49 mg/dL. Although the mean FBS was slightly higher in cases compared to controls, both groups exhibited FBS values within the normal physiological range. The standard deviation values indicate a comparable degree of variability in fasting glucose levels across the two groups.
TABLE 4: COMPARISION OF MEAN FBS and PPBS BETWEEN CASES AND CONTROLS
|
Group |
Mean FBS (mg/dL) |
SD FBS |
Mean PPBS (mg/dL) |
SD PPBS |
|
Cases |
83.74 |
8.26 |
112.22 |
8.73 |
|
Controls |
79.92 |
7.22 |
116.21 |
8.57 |
MEAN PPBS AMONG CASES AND CONTROLS:
The mean postprandial blood sugar (PPBS) among cases was 118.67 ± 9.51 mg/dL, whereas among controls it was 116.21 ± 8.57 mg/dL. Although a marginally higher mean PPBS was observed in cases compared to controls, both groups maintained postprandial blood glucose levels within the normal non-diabetic range. The standard deviations indicated minimal variability between the groups.
TABLE 5: GROUP STATISTICS
|
Parameter |
Cases (Mean ± SD) |
Controls (Mean ± SD) |
T-Statistic |
p-value |
|
HbA1c (%) |
7.0 ± 0.6 |
5.4 ± 0.19 |
25.12 |
< 0.00001 |
|
Hb (g/dL) |
9.98 ± 1.29 |
13.60 ± 1.06 |
-21.53 |
< 0.00001 |
|
MCV (fL) |
70.29 ± 5.64 |
87.16 ± 4.56 |
-23.14 |
< 0.00001 |
The ‘p’ value of the calculated t-statistic was <0.00001, which is statistically significant
A strong negative correlation was observed between MCV and HbA1c, with a Pearson correlation coefficient (r) of −0.885 and a p-value < 0.00001, indicating a statistically significant association. This suggests that as MCV decreases, HbA1c levels tend to increase.
DISCUSSION:
The present study evaluated the association between microcytic anemia and HbA1c levels in non-diabetic adults.The key findings revealed that individuals with microcytic anemia had significantly higher HbA1c levels compared to healthy controls despite comparable fasting and postprandial blood glucose levels.Additionally, a strong inverse correlation was noted between MCV and HbA1c levels, suggesting that as MCV decreases, HbA1c levels tend to rise.
These results are consistent with several previous studies. Rajagopal et al. (2017) observed that non-diabetic patients with iron deficiency anemia exhibited significantly elevated HbA1c levels, which decreased following iron therapy, highlighting the reversible impact of iron deficiency on HbA1c measurements.(8)
Alzahrani et al. (2023) similarly demonstrated that non-diabetic individuals with iron deficiency anemia had higher HbA1c values compared to controls. After correction of iron deficiency, HbA1c levels significantly declined, reinforcing that anemia can falsely inflate HbA1c.(9)
Coban et al. (2004) reported that iron deficiency anemia results in an overestimation of HbA1c due to altered red blood cell lifespan and turnover, affecting glycation rates.(10)
In contrast, studies examining individuals with β-thalassemia trait (such as Alzahrani et al., 2023) found no significant impact on HbA1c levels, suggesting that different types of microcytic anemia (e.g., iron deficiency anemia vs thalassemia) may have variable influences on HbA1c interpretation.
The pathophysiological mechanism likely relates to altered red blood cell turnover and increased erythrocyte lifespan in iron deficiency anemia, resulting in increased exposure of hemoglobin to glucose and artificially elevated HbA1c levels.
Additionally, variations in red cell indices such as low MCV and high red cell distribution width (RDW) are known to affect glycation dynamics.
In the current study, the mean MCV in cases was 70.29 ± 5.64 fL, significantly lower than controls (87.16 ± 4.56 fL), and a strong negative correlation (r = - 0.885) was observed between MCV and HbA1c levels, further emphasizing the relationship between microcytosis and elevated HbA1c.
These findings underscore the importance of considering iron status and red cell indices when interpreting HbA1c in non-diabetic populations, especially in regions where iron deficiency anemia is prevalent.Relying solely on HbA1c for diagnosing or monitoring diabetes in anemic individuals could lead to diagnostic inaccuracies
CONCLUSION:
In this study, a significant association was observed between microcytic anemia and elevatedHbA1c levels innon-diabetic adults.Individuals with microcytic anemia demonstrated lower hemoglobin and MCV values and falsely elevated HbA1c levels when compared to healthy controls.
A strong negative correlation was found between MCV and HbA1c, emphasizing that as red blood cell size decreases, HbA1c levels tend to rise.These findings reinforce that HbA1c values should be interpreted cautiously in anemic individuals, and alternative methods of glycemic assessment should be considered where anemia is prevalent.
Further studies are warranted to better understand the underlying mechanisms and to develop guidelines for adjusting HbA1c interpretation in the presence of hematological disorders
REFERENCES:
1. World Health Organization. Diabetes mellitus: report of a WHO study group.
a) Geneva: WHO; 1985. (WHO Technical Report Series, No. 727).
2. Stratton IM, Adler AI, Neil HA, et al. Association of glycaemia with macrovascular and microvascular complications of type 2 diabetes. BMJ. 2000;321(7258):405– 412.
3. American Diabetes Association. Standards of Medical Care in Diabetes—2024.
a) Diabetes Care. 2024;47(Suppl 1):S1–S179.
4. Nathan DM, Singer DE, Hurxthal K, Goodson JD. The clinical information value of the glycosylated hemoglobin assay. N Engl J Med. 1984;310(6):341–346.
5. Coban E, Ozdogan M, Timuragaoglu A. Effect of iron deficiency anemia on the levels of hemoglobin A1c in non-diabetic patients. Acta Haematol. 2004;112(3):126–128.
6. Sinha N, Mishra TK, Singh T, Gupta N. Effect of iron deficiency anemia on hemoglobin A1c levels. Ann Lab Med. 2012;32(1):17–22.
7. Anjana RM, Deepa M, Pradeepa R, Mahanta J, Narain K, Das HK, et al.
a) Prevalence of diabetes and prediabetes in 15 states of India: results from the ICMR–INDIAB population-based cross-sectional study. Lancet Diabetes Endocrinol. 2017;5(8):585–596.
8. Rajagopal L, Sethu R. Iron deficiency anemia and its effect on HbA1c measurements. J Clin Diagn Res. 2017;11(5):BC16–BC18.
9. Alzahrani AS, Saeedi MS, Al-Rashidi RM, Al-Rawashdeh SM, Abu-Farha M. Impact of different types of anemia on hemoglobin A1c levels in non-diabetic individuals: a cross-sectional study. Diabetes Care. 2023;46(1):e10–e12.
10. Coban E, Ozdogan M, Timuragaoglu A. Effect of iron deficiency anemia on the levels of hemoglobin A1c in non-diabetic patients. Acta Haematol. 2004;112(3):126–128.