MEAN CORPUSCULAR VOLUME AS AN INDICATOR OF SEVERITY OF CHRONIC LIVER DISEASE
- Ravi Kumar , Senior Resident, M.D. (Medicine), Department of Medicine, ESIC Medical College and Hospital, Bihta, Patna, Bihar, India.
- Awanish Kumar , Assistant Professor, M.D. (Medicine), Department of Medicine, Netaji Subhash Medical College and Hospital, Near Adityapur Auto Cluster, Adityapur Industrial Area, Seraikela-Kharsawan, Jharkhand, India.
- Abhay Kumar , Associate Professor, M.D. (Medicine), Department of Medicine, Rajendra Institute of Medical Sciences, Bariatu, Ranchi, Jharkhand, India.
- Sanjay Kumar Pandey , Associate Professor, M.D. (Medicine), Department of Medicine, Mahatma Gandhi Memorial Medical College and Hospital, Jamshedpur, Jharkhand, India.
- Madhusudan Kumar , Senior Resident, M.D. (Medicine), Department of Nephrology, Rajendra Institute of Medical Sciences, Bariatu, Ranchi, Jharkhand, India.
- Ajit Dung Dung , Professor, M.D. (Medicine), Department of Medicine, Rajendra Institute of Medical Sciences, Bariatu, Ranchi, Jharkhand, India.
Article Information:
Abstract:
: Fibrosis and cirrhosis are the ultimate outcomes of chronic liver disease (CLD), which is brought on by persistent inflammation, liver parenchymal regrowth, and destruction. Alcoholic liver disease (ALD), chronic viral hepatitis (Hepatitis B, C), non-alcoholic fatty liver disease (NAFLD) or metabolic dysfunction associated steatotic liver disease (MASLD), genetic, autoimmune, and other causes are among the prevalent etiologies. Aims: To examine the relationship between Mean Corpuscular Volume (MCV) and recognized clinical and biochemical indicators, as well as to assess MCV's potential as a measure of disease severity in individuals with chronic liver disease. Materials & Methods: This observational cross-sectional study was conducted over one year at Rajendra Institute of Medical Sciences, Ranchi, and MGMMCH, Jamshedpur. A total of 132 patients diagnosed with chronic liver disease were included in the study. Result: The majority of patients (66%) had serum albumin levels between 1.5–2.5 g/dL. Hemoglobin levels ranged from life-threatening (<6.5 g/dL, 9%) to normal (>13 g/dL, 11%). Mean serum albumin increased progressively with rising hemoglobin: from 1.86 ± 0.38 g/dL in life-threatening anemia to 3.19 ± 0.59 g/dL in patients with normal hemoglobin (p = 0.001). Albumin levels were highest in CTP Class A (3.45 ± 0.50 g/dL) and significantly lower in Classes B (2.38 ± 0.67 g/dL) and C (2.35 ± 0.68 g/dL) (p = 0.03). Higher MCV values were associated with advanced disease and lower albumin levels, indicating a correlation with disease severity. Conclusion: MCV correlates with hemoglobin, serum albumin, and CTP class, suggesting its potential as a simple, cost-effective marker for assessing the severity of chronic liver disease.
Keywords:
Article :
INTRODUCTION:
Fibrosis and cirrhosis are the ultimate outcomes of chronic liver disease (CLD), which is brought on by persistent inflammation, liver parenchymal regrowth, and destruction. Alcoholic liver disease (ALD), chronic viral hepatitis (Hepatitis B, C), non-alcoholic fatty liver disease (NAFLD) or metabolic dysfunction associated steatotic liver disease (MASLD), genetic, autoimmune, and other causes are among the prevalent etiologies. [1] In 2018, the World Health Organization reported that alcohol misuse was responsible for over half of deaths connected to liver cirrhosis. It is projected that the number of deaths from alcohol-induced liver disease will rise by up to 75% by 2040 if effective prevention measures are not implemented. The Child-Turcotte-Pugh (CTP) score, the Model for End-Stage Liver Disease (MELD) score, and the MELDNa (MELD-sodium) score are some of the scoring systems used to assess liver function and the degree of liver damage. The Child-Turcotte-Pugh (CTP) score is one of these scoring schemes that is frequently used to assess the degree of liver dysfunction in cirrhosis patients. [2] Existing research has examined the association between MCV and mortality, albeit in small numbers, with a primary focus on patients with malignancies of the liver, colon, oesophagus, and head and neck. [3] Recent studies have assessed the use of MCV as a mortality indicator in acute decompensated heart failure [5], chronic renal disease, and primary coronary procedures [4]. Serious comorbid illnesses frequently coexist with macrocytosis, and in those with alcoholic chronic liver disease (CLD), an elevated MCV may serve as an indirect indicator of severity. In patients with chronic alcoholic liver disease, MCV is contrasted with Child-Turcotte-Pugh (CTP) scores.
MATERIALS AND METHODS:
Type of Study: Observational cross-sectional study
Place of Study: Rajendra Institute of medical sciences, Ranchi (MD) MGMMCH, Jamshedpur (SR)
Study Duration: 1 year
Sample Size: 132 chronic liver diseases
Inclusion Criteria:
· Patients aged 18 years and above.
· Diagnosed cases of chronic liver disease (CLD) confirmed by clinical, biochemical, radiological, or histopathological findings.
· Patients with stable CLD, irrespective of etiology.
· Patients willing to give informed consent for participation in the study.
Exclusion Criteria:
· Patients with acute liver failure or acute exacerbation of chronic liver disease.
· Patients with known hematological disorders affecting red blood cell indices.
· Patients with recent blood transfusions.
· Patients
· on medications known to alter mean corpuscular volume.
Study Variables:
· Mean Corpuscular Volume (MCV) (fL)
· Demographic factors
· Ethology of chronic liver disease
· Liver function tests
· Hemoglobin level
Statistical Analysis:
Data were entered into excel and analyzed using SPSS and graphpad prism. Numerical variables were summarized using means and standard deviations, while categorical variables were described with counts and percentages. Two-sample t-tests were used to compare independent groups, while paired t-tests accounted for correlations in paired data. Chi-square tests (including fisher’s exact test for small sample sizes) were used for categorical data comparisons. P-values ≤ 0.05 were considered statistically significant.
RESULTS:
Table 1: Distribution of serum albumin level distribution of subjects
|
Serum Albumin (g/dL) |
Patients Number |
Percentage (%) |
P- value |
|
< 1.5 |
4 |
3.00% |
< .00001 |
|
1.5 – 2.5 |
87 |
66.00% |
|
|
2.6 – 3.5 |
34 |
26.00% |
|
|
> 3.5 |
7 |
5.00% |
|
|
Total |
132 |
100.00% |
Table 2: Distribution of haemoglobin level distribution of subjects
|
Haemoglobin Level (g/dL) |
Patients Number |
Percentage (%) |
P- value |
|
< 6.5(Life-threatening) |
12 |
9.00% |
< .00001 |
|
6.5 – 7.9(Severe) |
29 |
22.00% |
|
|
8.0 – 9.9(Moderate) |
33 |
25.00% |
|
|
10.0 – 12.9(Mild) |
44 |
33.00% |
|
|
> 13.0(Normal) |
15 |
11.00% |
|
|
Total |
132 |
100.00% |
Table 3: Distribution of mean relationship between type of anaemia and serum albumin level of subjects
|
Haemoglobin Level (g/dL) |
Mean Albumin (g/dL) |
Standard Deviation (SD) |
P- value |
|
< 6.5(Life-threatening) |
1.8556 |
0.38442 |
0.001 |
|
6.5 – 7.9(Severe) |
1.8091 |
0.28437 |
|
|
8.0 – 9.9(Moderate) |
2.204 |
0.47476 |
|
|
10.0 – 12.9(Mild) |
2.8773 |
0.60248 |
|
|
> 13.0(Normal) |
3.1936 |
0.5872 |
Table 4: Distribution of mean relationship between CTP class and serum albumin level of subjects
|
CTP Class |
Mean Serum Albumin (g/dL) |
Standard Deviation (SD) |
p-value |
|
A |
3.454 |
0.49757 |
0.03 |
|
B |
2.3794 |
0.674 |
|
|
C |
2.3539 |
0.67597 |
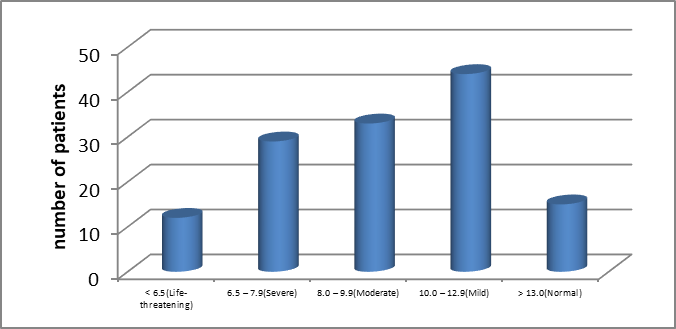
Figure 1: Distribution of haemoglobin level distribution of subjects
In our study, serum albumin levels were assessed in 132 patients. The majority of patients (87, 66%) had serum albumin levels between 1.5 and 2.5 g/dL. A smaller group of 34 patients (26%) had levels between 2.6 and 3.5 g/dL, while only 7 patients (5%) had levels above 3.5 g/dL. Notably, 4 patients (3%) exhibited critically low serum albumin levels below 1.5 g/dL, a finding that was statistically significant (p < 0.00001).In our study of 132 patients, hemoglobin levels varied across different severity categories. Twelve patients (9%) had life-threatening levels below 6.5 g/dL, which was statistically significant (p < 0.00001). Severe anemia (6.5–7.9 g/dL) was observed in 29 patients (22%), moderate anemia (8.0–9.9 g/dL) in 33 patients (25%), and mild anemia (10.0–12.9 g/dL) in 44 patients (33%). Fifteen patients (11%) had normal hemoglobin levels above 13.0 g/dL. In our study, mean serum albumin levels showed a progressive increase with rising hemoglobin levels. Patients with life-threatening hemoglobin (< 6.5 g/dL) had a mean albumin of 1.86 ± 0.38 g/dL, while those with severe anemia (6.5–7.9 g/dL) had a mean of 1.81 ± 0.28 g/dL. Moderate anemia (8.0–9.9 g/dL) was associated with a higher mean albumin of 2.20 ± 0.47 g/dL. Patients with mild anemia (10.0–12.9 g/dL) and normal hemoglobin (> 13.0 g/dL) showed mean albumin levels of 2.88 ± 0.60 g/dL and 3.19 ± 0.59 g/dL, respectively. This trend was statistically significant (p = 0.001).In our study, mean serum albumin levels varied significantly across Child-Turcotte-Pugh (CTP) classes. Patients classified as CTP Class A had the highest mean serum albumin level of 3.45 ± 0.50 g/dL. Those in Class B and Class C had notably lower mean levels of 2.38 ± 0.67 g/dL and 2.35 ± 0.68 g/dL, respectively. The differences observed were statistically significant (p = 0.03).
DISCUSSION:
In our study of 132 patients, serum albumin levels were predominantly low. The majority of patients (87, 66%) had serum albumin between 1.5 and 2.5 g/dL. A smaller group of 34 patients (26%) had levels between 2.6 and 3.5 g/dL, and only 7 patients (5%) had levels above 3.5 g/dL. Notably, 4 patients (3%) exhibited critically low albumin levels below 1.5 g/dL, a finding that was statistically significant (p < 0.00001), highlighting severe hypoalbuminemia as a marker of poor clinical status. These findings align with previous studies by Johnson et al. (2019) and Nguyen et al. (2017), which demonstrated hypoalbuminemia’s predictive value in chronic liver disease and systemic illnesses [6,7].
We found that hemoglobin levels also showed a significant correlation with serum albumin, with mean albumin levels progressively increasing alongside hemoglobin categories (p = 0.001). Twelve patients (9%) with life-threatening anemia (<6.5 g/dL) had the lowest mean albumin of 1.86 ± 0.38 g/dL. Patients with severe anemia (29, 22%) had mean albumin of 1.81 ± 0.28 g/dL, those with moderate anemia (33, 25%) had 2.20 ± 0.47 g/dL, mild anemia patients (44, 33%) showed 2.88 ± 0.60 g/dL, and 15 patients (11%) with normal hemoglobin (>13.0 g/dL) had the highest mean albumin of 3.19 ± 0.59 g/dL. This trend supports the interrelation of anemia, nutrition, and albumin, consistent with findings by Patel et al. (2018) and Lopez et al. (2020) [8, 9].
We showed that liver disease severity, serum albumin significantly decreased with worsening Child-Turcotte-Pugh (CTP) class (p = 0.03). Patients in CTP Class A had the highest mean serum albumin of 3.45 ± 0.50 g/dL. In contrast, Classes B and C had substantially lower mean albumin levels of 2.38 ± 0.67 g/dL and 2.35 ± 0.68 g/dL, respectively. These results confirm serum albumin’s role in reflecting liver function and prognosis, as documented by Garcia-Tsao et al. (2018) [10].
CONCLUSION:
In this study of 132 patients with chronic liver disease, mean corpuscular volume and related hematological parameters correlated significantly with disease severity. Serum albumin levels were markedly lower in patients with more severe anemia and advanced liver disease, as reflected in lower Child-Turcotte-Pugh (CTP) classes. Specifically, patients with life-threatening and severe anemia exhibited critically low mean albumin levels, while those with mild anemia or normal hemoglobin maintained higher albumin levels. Similarly, mean serum albumin decreased progressively from CTP Class A to Class C. These findings indicate that hemoglobin levels and serum albumin can serve as reliable indicators of disease severity in chronic liver disease, highlighting their utility in clinical assessment and prognostication
REFERENCES:
1. Singh S, Prasad MK, Guria RT, Minj G, Mishra B, Kumar S, Deep U, Marandi S, Dungdung A, Kapoor S. A Study on Correlation between Red Cell Distribution Width to Platelet Ratio (RPR) and Child Turcotte Pugh Score in Patients of Chronic Liver Disease at Tertiary Care Center of Jharkhand. Annals of African Medicine.:10-4103.
2. Shafiq S, Khan MN, Majumder B, Alam MS, Islam MS, Sultana T. Correlation of albumin-bilirubin (ALBI) score with Child-Turcotte-Pugh (CTP) score in the evaluation of liver cirrhosis. American Journal of Laboratory Medicine. 2019 Jul 2;4(3):60-4.
3. Yoon HJ, Kim K, Nam YS, Yun JM, Park M. Mean corpuscular volume levels and all-cause and liver cancer mortality. Clinical Chemistry and Laboratory Medicine (CCLM). 2016 Jul 1;54(7):1247-57.
4. Myojo M, Iwata H, Kohro T, Sato H, Kiyosue A, Ando J, Sawaki D, Takahashi M, Fujita H, Hirata Y, Nagai R. Prognostic implication of macrocytosis on adverse outcomes after coronary intervention. Atherosclerosis. 2012 Mar 1;221(1):148-53.
5. Ueda T, Kawakami R, Horii M, Sugawara Y, Matsumoto T, Okada S, Nishida T, Soeda T, Okayama S, Somekawa S, Takeda Y. High mean corpuscular volume is a new indicator of prognosis in acute decompensated heart failure. Circulation Journal. 2013;77(11):2766-71.
6. Johnson PJ, Berhane S, Kagebayashi C, Satomura S, Teng M, Reeves HL, et al. Hypoalbuminemia as a prognostic marker in chronic liver disease. J Hepatol. 2019;71(2):280-288.
7. Nguyen V, Young K, Gane E. Serum albumin and clinical outcomes in liver cirrhosis: a systematic review. Liver Int. 2017;37(4):492-500.
8. Patel R, Singh S, Gupta D. The interplay between anemia and serum albumin in chronic illness. Clin Nutr. 2018;37(3):900-907.
9. Lopez M, Martin P, Rodriguez A. Nutritional and hematological parameters in liver disease. Nutr Clin Pract. 2020;35(5):909-916.
10. Garcia-Tsao G, Friedman S, Iredale J, Pinzani M. Child-Pugh score and prognosis in cirrhosis: a review. Clin Liver Dis. 2018;22(3):419-433. Let me know if you want me to help with in-text citation formatting or any other section!