Electrocardiographic Changes in Anaemia and Their Correlation with Disease Severity: A Hospital-Based Observational Study.
- Kovvuri Pavani. , Postgraduate, Department of General Medicine, Mamata Medical College, Khammam, Telangana.
- Paleti Srikanth. , Professor, Department of General Medicine, Mamata Medical College, Khammam, Telangana.
- Afeera Tufheem. , Postgraduate, Department of General Medicine, Mamata Medical College, Khammam, Telangana
- Kesavadasu Palem Madhavee Latha. , Postgraduate, Department of General Medicine, Mamata Medical College, Khammam, Telangana.
- Kondaparthi Sahithi , Postgraduate, Department of General Medicine, Mamata Medical College, Khammam, Telangana
- Rachakonda Srija. , Assistant Professor, Department of General Medicine, Mamata Medical College, Khammam, Telangana.
Article Information:
Abstract:
Background: Anaemia is a major global health problem with significant cardiovascular implications. Reduced oxygen-carrying capacity leads to compensatory hemodynamic changes that may manifest as electrocardiographic (ECG) abnormalities. However, these changes are often under-recognized in routine clinical practice, particularly in resource-limited settings. Aim of the study was to evaluate electrocardiographic changes in patients with anaemia and to assess their association with the severity of anaemia. Materials and Methods: This hospital-based observational study included 100 patients diagnosed with anaemia (hemoglobin ≤11 g/dL) attending inpatient and outpatient services. Detailed clinical evaluation, laboratory investigations including complete hemogram and peripheral smear, and a standard 12-lead ECG were performed. ECG parameters analyzed included heart rate, rhythm, conduction intervals, ST-T changes, and evidence of chamber hypertrophy. Anaemia was categorized as mild, moderate, or severe. Statistical analysis was performed, and p < 0.05 was considered significant. Results: The mean age was 36.8 ± 8.4 years, with a female predominance (58%). Moderate anaemia was most common (41%). ECG abnormalities were observed in 62% of patients. Sinus tachycardia (61%) was the most frequent finding, followed by T wave abnormalities (34%), QT interval prolongation (33%), and ST segment changes (31%). The prevalence of ECG abnormalities increased significantly with severity of anaemia, from 43.2% in mild to 81.8% in severe cases (p = 0.003). Conclusion: ECG abnormalities are common in anaemic patients and correlate significantly with the severity of anaemia. ECG serves as a valuable, non-invasive tool for early detection of cardiac involvement and should be considered in routine evaluation of moderate to severe anaemia.
Keywords:
Article :
INTRODUCTION:
Anaemia remains one of the most widespread global public health challenges, affecting over 1.9 billion individuals worldwide, with a disproportionately high burden in developing countries such as India due to nutritional deficiencies, chronic infections, and hemoglobinopathies [1]. It is defined as a reduction in hemoglobin concentration below normal levels for age and sex, resulting in diminished oxygen-carrying capacity and consequent tissue hypoxia [2]. While the systemic manifestations of anaemia—such as fatigue, pallor, and reduced exercise tolerance—are well recognized, its cardiovascular implications, particularly electrocardiographic (ECG) changes, are often under-evaluated in routine clinical practice. The cardiovascular system plays a pivotal compensatory role in anaemia. Reduced oxygen delivery leads to adaptive mechanisms including increased cardiac output, tachycardia, decreased systemic vascular resistance, and enhanced myocardial contractility [3]. Although these changes initially help maintain tissue oxygenation, persistent or severe anaemia imposes a chronic hemodynamic burden, predisposing individuals to myocardial ischemia, arrhythmias, left ventricular hypertrophy, and high-output cardiac failure [4]. Electrocardiography, being a non-invasive, inexpensive, and widely available diagnostic tool, serves as a valuable modality for detecting these cardiovascular alterations.
ECG changes in anaemia primarily arise due to myocardial hypoxia, autonomic imbalance, electrolyte disturbances, and structural cardiac remodeling [5]. Reduced hemoglobin levels impair myocardial oxygen supply, particularly affecting subendocardial regions, leading to repolarization abnormalities detectable on ECG [6]. Commonly reported ECG findings include sinus tachycardia, ST segment depression, T wave inversion or flattening, prolonged QT interval, and signs of ventricular hypertrophy [7]. Sinus tachycardia is often the earliest manifestation, reflecting sympathetic overactivity, while ST-T changes may mimic myocardial ischemia, posing diagnostic challenges, especially in patients with coexisting cardiovascular risk factors [8]. Several studies have demonstrated a correlation between the severity of anaemia and the extent of ECG abnormalities. Mild anaemia may show minimal or no changes, whereas moderate to severe anaemia is associated with a higher prevalence of repolarization abnormalities and conduction disturbances [9]. Iron deficiency anaemia, the most common subtype, has been specifically linked to prolonged QT interval and increased QT dispersion due to impaired myocardial energy metabolism, which may predispose patients to arrhythmias [10]. Importantly, some of these ECG changes have been shown to reverse following appropriate treatment, indicating their dynamic and potentially reversible nature.
Despite growing evidence, there exists considerable heterogeneity in the literature regarding ECG manifestations in anaemia. Variations in study design, population characteristics, etiological classification, and criteria for defining anaemia severity contribute to inconsistent findings [9,10]. Moreover, most studies have been conducted in Western populations, with limited data from Indian cohorts, where anaemia tends to be more chronic, severe, and often untreated [11]. Additionally, there is a lack of comprehensive studies systematically correlating graded haemoglobin levels with a full spectrum of ECG changes using standardized methodologies. Many existing studies focus on isolated ECG parameters rather than providing a holistic electrocardiographic profile, thereby limiting their clinical applicability [12]. Another important research gap is the underutilization of ECG as a screening tool in anaemic patients, particularly in resource-limited settings. Given its accessibility and cost-effectiveness, ECG has the potential to serve as an early indicator of subclinical cardiac involvement in anaemia, aiding in timely intervention and prevention of adverse cardiovascular outcomes [5]. In the Indian context, where patients often present late with moderate to severe anaemia and nonspecific symptoms, integrating ECG into routine evaluation could significantly improve risk stratification and management.
In view of these considerations, the present study aims to evaluate the spectrum of electrocardiographic changes in patients with anaemia and to assess their association with the severity of anaemia. By systematically correlating haemoglobin levels with ECG findings in an Indian hospital-based population, this study seeks to address existing gaps in knowledge and contribute clinically relevant insights for early detection and management of anaemia-related cardiac involvement
MATERIALS AND METHODS:
Study Design and Setting
This hospital-based observational study was conducted in the Department of General Medicine and included patients attending both outpatient and inpatient services. The study was carried out over a predefined duration after obtaining institutional approval. The study population consisted of clinically suspected anaemic patients who were subsequently confirmed by laboratory investigations before inclusion .
Study Population and Sample Size
Patients diagnosed with anaemia formed the study population. The sample size was calculated using the standard formula, assuming a 50% prevalence of ECG abnormalities to ensure maximum sample size and statistical power. With an allowable error of 10%, the calculated sample size was 100. Accordingly, a total of 100 eligible patients were included in the study .
Inclusion Criteria
• Patients with hemoglobin ≤ 11 g/dL confirmed by automated hematology analyzer
• Age less than 49 years
• Both male and female patients
• Patients willing to participate and provide consent
Exclusion Criteria
• Age > 49 years
• Known coronary artery disease or ischemic heart disease
• Risk factors for coronary artery disease:
o Heavy smoking
o Obesity
o Hypercholesterolemia
• Congenital or valvular heart disease
• Thyrotoxicosis
• Chronic respiratory diseases:
o Chronic obstructive pulmonary disease (COPD)
o Pulmonary tuberculosis
Study Tool
• Structured clinical proforma for history and examination
• Automated hematology analyzer for hemoglobin estimation
• Peripheral smear examination for red cell morphology
• Standard 12-lead electrocardiograph for ECG recording
Data Collection
Clinical Evaluation
• Detailed history focusing on symptoms such as fatigue, dyspnea, palpitations, and dizziness
• General physical examination including pallor, pulse, blood pressure, and respiratory rate
• Cardiovascular examination for heart rate, rhythm, and murmurs
• Gastrointestinal examination to identify occult blood loss
Laboratory Investigations
• Complete hemogram
• Peripheral blood smear
• Stool examination for occult blood
• Urine examination
Electrocardiographic Evaluation
• Resting 12-lead ECG recorded under standardized conditions
• Parameters analyzed:
o Heart rate and rhythm
o Conduction abnormalities
o ST segment changes
o T wave abnormalities
o QT interval changes
o Other ECG abnormalities
All findings were systematically recorded and entered into a master chart for analysis .
Statistical Analysis
Data obtained from clinical, laboratory, and ECG evaluations were compiled and analyzed using descriptive statistics. The incidence and pattern of ECG abnormalities were determined, and their correlation with the severity of anaemia (based on hemoglobin levels) was assessed. Appropriate statistical tests were applied to evaluate significance, and a p-value < 0.05 was considered statistically significant.
RESULTS:
Table 1: Baseline Demographic and Clinical Characteristics (n = 100)
|
Parameter |
Category |
n |
% |
|
Age (years) |
18–29 |
28 |
28.0 |
|
30–39 |
34 |
34.0 |
|
|
40–49 |
38 |
38.0 |
|
|
Sex |
Male |
42 |
42.0 |
|
Female |
58 |
58.0 |
|
|
Symptoms |
Fatigue |
82 |
82.0 |
|
Dyspnea |
64 |
64.0 |
|
|
Palpitations |
48 |
48.0 |
|
|
Dizziness |
41 |
41.0 |
|
|
Chest discomfort |
12 |
12.0 |
|
|
Pulse Rate |
<100 bpm |
39 |
39.0 |
|
≥100 bpm |
61 |
61.0 |
|
|
BP Status |
Normal |
86 |
86.0 |
|
Hypotension |
9 |
9.0 |
|
|
Hypertension |
5 |
5.0 |
The study population comprised predominantly middle-aged individuals, with the highest proportion in the 40–49 years age group (38%), followed by 30–39 years (34%) and 18–29 years (28%). Females constituted a greater proportion (58%) compared to males (42%), indicating a female predominance. Fatigue was the most common presenting symptom (82%), followed by dyspnea (64%), palpitations (48%), and dizziness (41%), while chest discomfort was less frequently reported (12%). Tachycardia (pulse rate ≥100 bpm) was observed in 61% of patients, reflecting a compensatory response to anaemia, whereas 39% had a normal pulse rate. Most patients (86%) had normal blood pressure, with a small proportion presenting with hypotension (9%) and hypertension (5%).
Table 2: Hematological Profile of Study Population (n = 100)
|
Parameter |
Value |
|
Hemoglobin (Mean ± SD) |
9.1 ± 1.8 g/dL |
|
RBC count |
3.4 ± 0.6 million/mm³ |
|
PCV |
28.6 ± 5.4 % |
|
MCV |
72.8 ± 9.6 fL |
|
MCH |
23.1 ± 3.8 pg |
|
MCHC |
31.4 ± 2.2 g/dL |
The hematological profile of the study population revealed a mean hemoglobin level of 9.1 ± 1.8 g/dL, consistent with moderate anaemia. The total RBC count (3.4 ± 0.6 million/mm³) and packed cell volume (28.6 ± 5.4%) were reduced, indicating decreased red cell mass. Red cell indices showed a low mean corpuscular volume (72.8 ± 9.6 fL) and mean corpuscular hemoglobin (23.1 ± 3.8 pg), suggestive of a microcytic, hypochromic pattern of anaemia. The mean corpuscular hemoglobin concentration (31.4 ± 2.2 g/dL) was slightly reduced, further supporting hypochromia.
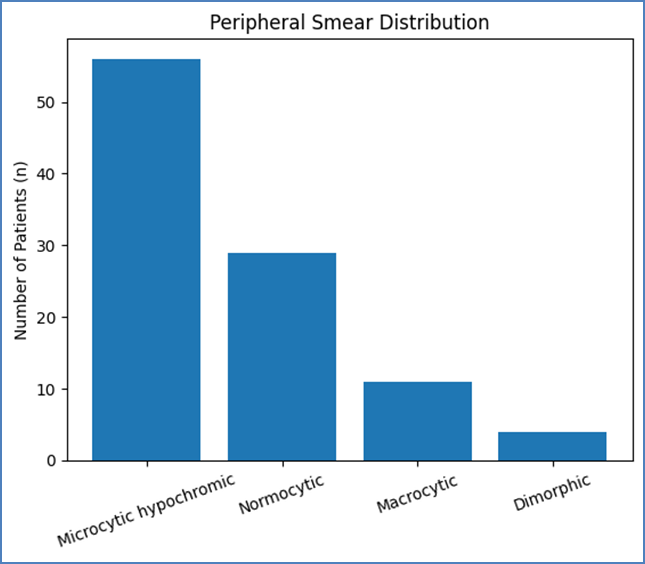
Figure 1: Distribution of Peripheral Blood Smear Patterns in the Study Population.
The figure 1shows the distribution of peripheral blood smear patterns among the study population. Microcytic hypochromic anaemia was the most predominant pattern, followed by normocytic normochromic, macrocytic, and dimorphic patterns, indicating that iron deficiency was the leading etiology of anaemia in the study group.
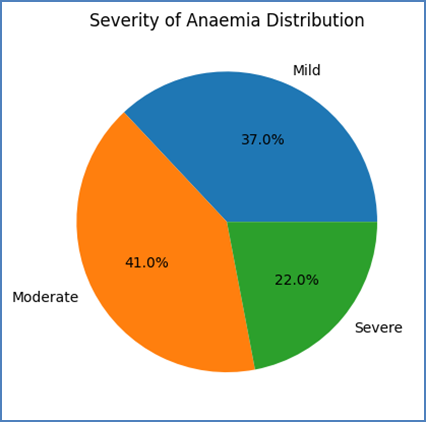
Figure 2: Distribution of Severity of Anaemia in the Study Population
The figure 2 represents the distribution of anaemia severity among the study population. Moderate anaemia constituted the largest proportion (41%), followed by mild anaemia (37%) and severe anaemia (22%), indicating a predominance of moderate anaemia in the study group.
Table 3: Clinical Examination and Etiological Indicators (n = 100)
|
System |
Finding |
n |
% |
|
General |
Pallor |
100 |
100.0 |
|
Pedal edema |
18 |
18.0 |
|
|
Icterus |
6 |
6.0 |
|
|
CVS |
Tachycardia |
61 |
61.0 |
|
Flow murmur |
27 |
27.0 |
|
|
GIT |
Occult blood positive |
21 |
21.0 |
|
Abnormal findings |
14 |
14.0 |
|
|
Urine |
Hematuria |
5 |
5.0 |
|
Proteinuria |
3 |
3.0 |
The clinical examination findings revealed that pallor was present in all patients (100%), confirming it as the most consistent sign of anaemia. Pedal edema (18%) and icterus (6%) were observed in a smaller proportion. Cardiovascular examination showed tachycardia in 61% of patients and flow murmurs in 27%, reflecting compensatory hyperdynamic circulation. Gastrointestinal findings included occult blood positivity in 21% of patients, suggesting chronic blood loss as an important etiological factor, while 14% had other abdominal abnormalities. Urine examination revealed hematuria in 5% and proteinuria in 3% of patients, indicating that renal causes were relatively less common.
Table 4: Overall ECG Findings and Rhythm (n = 100)
|
Parameter |
Finding |
n |
% |
|
ECG status |
Normal |
38 |
38.0 |
|
Abnormal |
62 |
62.0 |
|
|
Heart rate |
Normal |
39 |
39.0 |
|
Tachycardia |
61 |
61.0 |
|
|
Rhythm |
Sinus rhythm |
94 |
94.0 |
|
Arrhythmias |
6 |
6.0 |
The electrocardiographic evaluation revealed that 62% of patients had abnormal ECG findings, while 38% had normal ECGs, indicating a high prevalence of cardiac involvement in anaemia. Sinus tachycardia was observed in 61% of patients, reflecting a compensatory response to reduced oxygen-carrying capacity, whereas 39% had a normal heart rate. The majority of patients (94%) maintained a normal sinus rhythm, with only 6% exhibiting arrhythmias.
Table 5: Detailed ECG Changes (n = 100)
|
Parameter |
Finding |
n |
% |
|
PR interval |
Abnormal |
6 |
6.0 |
|
QRS duration |
Abnormal |
3 |
3.0 |
|
QT interval |
Prolonged |
33 |
33.0 |
|
ST changes |
Present |
31 |
31.0 |
|
T wave changes |
Present |
34 |
34.0 |
|
LVH |
Present |
11 |
11.0 |
The detailed electrocardiographic analysis showed that repolarization abnormalities were the most prominent findings in anaemic patients. QT interval prolongation was observed in 33% of patients, while T wave changes were present in 34% and ST segment changes in 31%, indicating myocardial hypoxia and altered ventricular repolarization. Conduction abnormalities were relatively less common, with abnormal PR interval seen in 6% and abnormal QRS duration in 3% of patients. Evidence of left ventricular hypertrophy was noted in 11% of cases, suggesting chronic hemodynamic stress.
Table 6: Pattern of ECG Abnormalities (n = 100)
|
ECG Abnormality |
n |
% |
|
Sinus tachycardia |
61 |
61.0 |
|
T wave abnormalities |
34 |
34.0 |
|
QT prolongation |
33 |
33.0 |
|
ST changes |
31 |
31.0 |
|
Hypertrophy |
14 |
14.0 |
|
Conduction defects |
5 |
5.0 |
The pattern of electrocardiographic abnormalities in the study population demonstrated that sinus tachycardia was the most common finding, observed in 61% of patients, reflecting a compensatory response to anaemia. Repolarization abnormalities were also frequent, with T wave changes in 34%, QT interval prolongation in 33%, and ST segment changes in 31%, indicating myocardial hypoxia and altered electrical activity. Structural changes such as cardiac hypertrophy were present in 14% of patients, while conduction defects were relatively uncommon, seen in only 5% of cases.
Table 7: Correlation Between Severity of Anaemia and ECG Abnormalities (n = 100)
|
Severity |
Normal ECG |
Abnormal ECG |
% Abnormal |
|
Mild |
21 |
16 |
43.2 |
|
Moderate |
13 |
28 |
68.3 |
|
Severe |
4 |
18 |
81.8 |
p = 0.003 (Statistically significant)
The correlation between severity of anaemia and ECG abnormalities demonstrated a clear increasing trend. Among patients with mild anaemia, 43.2% showed abnormal ECG findings, whereas the proportion increased to 68.3% in moderate anaemia and 81.8% in severe anaemia. Conversely, the proportion of normal ECG findings decreased with increasing severity.
DISCUSSION:
The present study was undertaken to evaluate electrocardiographic (ECG) changes in patients with anaemia and to assess their correlation with the severity of anaemia. The findings demonstrate a high prevalence of ECG abnormalities (62%), with a clear trend of increasing abnormalities as haemoglobin levels decline. These observations highlight the significant cardiovascular impact of anaemia, even in relatively young populations without major confounding cardiac comorbidities.
In the present study, the majority of patients belonged to the 30–49 years age group, with a mean age of 36.8 ± 8.4 years, and a female predominance (58%). This is consistent with epidemiological patterns reported in developing countries, where nutritional anaemia is more prevalent among women due to menstrual blood loss, pregnancy, and dietary deficiencies [13]. Similar demographic trends were reported by Toteja et al., who observed a higher prevalence of anaemia among women in India [13].
Fatigue (82%) and dyspnea (64%) were the most common presenting symptoms, reflecting reduced oxygen delivery and compensatory cardiopulmonary mechanisms. These findings are in agreement with studies by Nand et al., who also reported fatigue and exertional dyspnea as predominant symptoms in anaemic patients [14]. Palpitations and dizziness observed in the present study further support the role of increased cardiac output and cerebral hypoxia in symptomatology.
The mean haemoglobin level in the present study was 9.1 ± 1.8 g/dL, with moderate anaemia being the most common (41%). Peripheral smear examination revealed a predominance of microcytic hypochromic anaemia (56%), indicating iron deficiency as the leading cause. These findings are consistent with global and Indian data, where iron deficiency remains the most common etiology of anaemia [15].
The presence of occult blood in stool in 21% of patients suggests chronic gastrointestinal blood loss as a significant contributing factor. Similar findings were reported by DeLoughery, who emphasized gastrointestinal blood loss as an important cause of iron deficiency anaemia in adults [16].
Tachycardia was observed in 61% of patients, with a mean pulse rate of 102.6 ± 12.4 beats/min, indicating a compensatory increase in cardiac output. Most patients maintained normal blood pressure, although hypotension was noted in 9%. These findings are consistent with the physiological adaptations described by Guyton and Hall, where reduced oxygen-carrying capacity leads to increased heart rate and decreased systemic vascular resistance [3].
The present study demonstrated ECG abnormalities in 62% of patients, which is comparable to findings by Nand et al., who reported ECG changes in approximately 60–70% of patients with severe anaemia [14]. Sinus tachycardia was the most common abnormality (61%), followed by T wave changes (34%), QT prolongation (33%), and ST segment changes (31%).
Repolarization abnormalities observed in the present study are attributable to myocardial hypoxia and altered ionic currents. Similar findings were reported by Yokusoglu et al., who demonstrated QT interval prolongation in patients with iron deficiency anaemia, indicating increased risk of ventricular arrhythmias [10]. The present study also found QT prolongation in 33% of patients, supporting these observations.
ST segment depression (29%) and T wave inversion/flattening (34%) observed in this study are indicative of subendocardial ischemia. These findings are in agreement with Gupta et al., who reported a higher prevalence of ST-T changes in moderate to severe anaemia [9]. Such changes may mimic ischemic heart disease, emphasizing the need for careful clinical correlation.
Conduction abnormalities were relatively rare (5%), which aligns with previous studies suggesting that conduction defects are less common compared to repolarization changes in anaemia [17]. Left ventricular hypertrophy (11%) observed in the present study reflects chronic volume overload and sustained hyperdynamic circulation, as described in earlier studies on chronic anaemia [18].
A key finding of the present study is the statistically significant correlation between anaemia severity and ECG abnormalities (p = 0.003). The prevalence of abnormal ECG increased from 43.2% in mild anaemia to 81.8% in severe anaemia. This dose-dependent relationship has been reported in earlier studies by Gupta et al. and Nand et al., who demonstrated increasing ECG abnormalities with declining haemoglobin levels [9,14].
These findings reinforce the concept that myocardial hypoxia and hemodynamic stress intensify with worsening anaemia, leading to more pronounced electrophysiological changes. The strong correlation observed in this study underscores the importance of ECG as a non-invasive marker for assessing the severity and cardiovascular impact of anaemia.
The findings of the present study highlight the clinical utility of ECG as a simple, cost-effective tool for early detection of cardiac involvement in anaemia. In resource-limited settings, routine ECG evaluation in patients with moderate to severe anaemia may aid in risk stratification and timely intervention, thereby preventing progression to overt cardiac complications
CONCLUSION:
The present study demonstrates that electrocardiographic abnormalities are common in patients with anaemia, with a prevalence of 62%. Sinus tachycardia and repolarization abnormalities such as ST-T changes and QT prolongation were the most frequent findings. A significant positive correlation was observed between the severity of anaemia and the occurrence of ECG abnormalities, with severe anaemia showing the highest prevalence. These findings emphasize that anaemia has a substantial impact on cardiac electrophysiology and that ECG can serve as a valuable, non-invasive tool for early detection of cardiac stress. Routine ECG evaluation should be considered in patients with moderate to severe anaemia to facilitate early diagnosis and management of potential cardiovascular complications.
REFERENCES:
1. World Health Organization. Global anaemia estimates, 2021 edition. Geneva: WHO; 2021.
2. McLean E, Cogswell M, Egli I, Wojdyla D, de Benoist B. Worldwide prevalence of anaemia. Public Health Nutr. 2009;12(4):444–54.
3. Guyton AC, Hall JE. Textbook of Medical Physiology. 13th ed. Philadelphia: Elsevier; 2016.
4. Anand IS. Anemia and chronic heart failure. J Am Coll Cardiol. 2008;52(7):501–11.
5. Surawicz B, Knilans TK. Chou’s Electrocardiography in Clinical Practice. 6th ed. Philadelphia: Saunders; 2008.
6. Braunwald E. Heart Disease: A Textbook of Cardiovascular Medicine. 11th ed. Philadelphia: Elsevier; 2019.
7. Karthikeyan G, Teo KK, Islam S, et al. Anaemia and cardiovascular disease. Circulation. 2014;129(8):845–54.
8. Nand N, Aggarwal HK, Sharma M. ECG changes in severe anaemia. J Assoc Physicians India. 2000;48:110–12.
9. Gupta A, Gupta R, Soni RK. Correlation of ECG changes with severity of anaemia. Indian Heart J. 2018;70(3):S123–7.
10. Yokusoglu M, Nevruz O, Baysan O, et al. QT interval in iron deficiency anaemia. Ann Noninvasive Electrocardiol. 2007;12(3):203–8.
11. Toteja GS, Singh P. Micronutrient deficiency disorders in India. Indian J Med Res. 2004;120(5):537–46.
12. DeLoughery TG. Iron deficiency anemia. Med Clin North Am. 2017;101(2):319–32.
13. Toteja GS, Singh P. Micronutrient deficiency disorders in India. Indian J Med Res. 2004;120(5):537–46.
14. Nand N, Aggarwal HK, Sharma M. ECG changes in severe anaemia. J Assoc Physicians India. 2000;48:110–12.
15. World Health Organization. Iron deficiency anaemia: assessment, prevention and control. Geneva: WHO; 2001.
16. DeLoughery TG. Iron deficiency anemia. Med Clin North Am. 2017;101(2):319–32.
17. Surawicz B, Knilans TK. Chou’s Electrocardiography in Clinical Practice. 6th ed. Philadelphia: Saunders; 2008.
18. Anand IS. Anemia and chronic heart failure. J Am Coll Cardiol. 2008;52(7):501–11.