A Cross-Sectional Study of Thyroid Function in Chronic Liver Disease.
- Amala P. , Junior Resident, Department of General Medicine, District Hospital, Tumkur, Karnataka, India.
- P Bhanuprakash. , Senior Consultant, Department of General Medicine, District Hospital, Tumkur, Karnataka, India.
- Daruka K M. , Senior Consultant & Head of Department, Department of General Medicine, District Hospital, Tumkur, Karnataka, India.
Article Information:
Abstract:
Objective: To evaluate the relationship between the functioning of the thyroid and the chronic liver disease. Methodology: Over three years, this hospital-based cross-sectional study enrolled 70 patients with chronic liver disease. The free triiodothyronine (FT3), free thyroxine (FT4), and thyroid-stimulating hormone (TSH) levels were among the thyroid function tests done. The Child-Pugh classification was used to evaluate the degree of severity of liver disease. Statistical correlations were made to check the relationship between the levels of thyroid hormones and the severity of the disease. Results: The most common thyroid abnormality found, affecting most patients, was low T3 syndrome. FT3 levels across patients showed a consistent drop with liver disease increasing in severity, while FT4 levels were preserved and only mildly decreased. TSH levels showed a consistent increase with disease worsening. There was a particularly significant correlation between FT3 levels and the thyroid hormones with the Child-Pugh class. Conclusion: Low T3 syndrome and other types of thyroid dysfunction are common among people with chronic liver disease and correlate with the severity of the disease. Non-invasive markers of disease progression and helping with clinical decisions would be thyroid function tests, especially the FT3.
Keywords:
Article :
INTRODUCTION:
Chronic liver disease (CLD) continues to be one of the leading causes of illness and death, with nearly two million deaths each year, with liver disease related deaths due to cirrhosis and liver cancer being the highest (1,2). With the last tup of the global pandemic, the world is also grappling to contain the viral infectious disease pandemic that is being observed and liver diseases of CLD have risen (3). The liver is essential for the homeostatic equilibrium of the body, being pivotal in the metabolism of hormones, proteins, and nutrients; some of which are thyroid hormones, which serve as feedback to the hypothalamus and pituitary and increase basal metabolic rate (4,5). The principal thyroid hormones that circulate in the body are thyroxine (T4) and triiodothyronine (T3), with T3 being the active hormone that is primary to controlling metabolism (6).
Competition occurs to bind the circulating thyroid hormones, which are partly bound to proteins, largely swallow thyroxine-binding globulin (TBG) as well as to thyroxine (TT4) binding transthyretin and TT4 binding-albumin, all of which are produced and synthesized in the liver; hence, hepatic dysfunction is likely to alter the quantity of these binding proteins and thereby thyroid hormone levels and biological availability (7,8). The liver also plays an important role in the peripheral conversion of T4 to T3 via deiodinase enzymes, which are deficient in chronic liver disease; hence, there is a reduction in T3 and an increase in the production of reverse T3 (rT3), which is an inactive metabolite, (9,10), hence this cause of the “low T3 syndrome” or “sick euthyroid syndrome”, which is a normal state in patients of chronic systemic disease (11).
Cytokines like interleukin-6 and tumor necrosis factor-alpha have a major role in altering thyroid hormone metabolism. In chronic liver disease, these cytokines are involved in deiodinase activity inhibition and disruption of the hypothalamic-pituitary-thyroid axis which lead to thyroid dysfunction (12,13). In chronic illness, these changes are adaptive to a response aimed at reducing metabolic demand. Many studies have concluded that people with chronic liver disease have frequent thyroid function test abnormalities. The most frequent abnormality seen is a low T3 syndrome, followed by abnormalities in T4 and thyroid-stimulating hormone (14,15). It is these abnormalities that may act as prognostic indicators due to the correlation with disease severity.
Chronic liver disease severity is evaluated with scoring systems like the Child-Pugh classification and the Model for End-Stage Liver Disease (MELD) score (16,17). Within clinical practice, these scoring systems are used to predict prognosis and evaluate treatment strategies. Emerging studies suggest that these scoring systems, T3, and liver disease severity may have a relationship. Previous research has shown that in chronic liver disease, thyroid dysfunction is linked to the alteration of hypothalamic-pituitary-thyroid axis action and reduces peripheral metabolism of thyroid hormones (18,19). Additionally, low T3 levels are associated with deteriorating liver function and increased mortality in patients with cirrhosis (20,21).
Thyroid dysfunction has been linked to increased severity of liver disease in a number of studies. Advanced liver disease has consistently been associated with low levels of T3 and FT3 and/or uncharacteristic TSH levels (22-24). Additionally, thyroid function test abnormalities have been linked with poor outcomes and increased complications in patients with cirrhosis (25-27). Therefore, thyroid function testing is likely to help in understanding the progression and prognosis of chronic liver disease (28).
Aim of the study
Assessing the thyroid function deviations in patients suffering from chronic liver disease.
Objective
To evaluate the relationship between the functioning of the thyroid and the chronic liver disease.
METHODOLOGY:
This research was executed in the course of three years, between 2019 and 2022, at the Department of General Medicine located in District Hospital, Tumakuru, Karnataka, India, investigating the degree of thyroid function abnormalities in association with the degree of severity in patients with chronic liver disease (CLD). The research participants were adult patients with chronic liver disease (CLD) who were in the outpatient department or were admitted to the hospital at any time, during the research period. The diagnosis of CLD was done, based on a combination of clinical presentations, blood tests, and imaging done as per the criteria for Chronic liver disease. 70 patients were recruited in the research, fulfilling the requirements for enrolment during the time of the research. In the course of the study, the researchers have used the sample size based on, the logistical feasibility and the availability of patients who qualify for the study.
Inclusion Criteria
The research included all patients who were 18 years old, and had been diagnosed with chronic liver disease through clinical assessment, blood tests, and imaging studies. Only patients who were willing to partake and who signed an informed consent form were included in the research.
Exclusion Criteria
• Patients with previously diagnosed thyroid conditions.
• Patients taking certain amiodarone, steroid) medications that affect thyroid activity.
• Women who are pregnant.
• Patients diagnosed with acute hepatic failure.
• Patients with severe illnesses, unrelated to liver disorders, that may modify thyroid activity.
Data Collection Procedure
Upon receiving informed consent, specific demographic details, elements of clinical history, and findings from physical examinations were captured with the aid of a structured pro forma. Special emphasis was captured for symptoms and signs pertaining to liver and thyroid diseases.
Assessment of Liver Disease Severity
The severity of chronic liver disease was assessed using the Child-Pugh scoring system, which includes five parameters: serum bilirubin, serum albumin, prothrombin time, presence of ascites, and hepatic encephalopathy. Based on the score, patients were classified into:
• Child-Pugh Class A (mild disease)
• Child-Pugh Class B (moderate disease)
• Child-Pugh Class C (severe disease)
Laboratory Investigations
Venous blood samples were collected under aseptic conditions from all participants. The following investigations were performed:
• Thyroid Function Tests (TFTs):
• Free Triiodothyronine (FT3)
• Free Thyroxine (FT4)
• Thyroid Stimulating Hormone (TSH)
• Liver Function Tests (LFTs):
• Serum bilirubin
• Serum albumin
• Liver enzymes (AST, ALT)
• Prothrombin time
All laboratory investigations were carried out using standard automated analyzers and validated techniques.
Outcome Measures
The main objective was to explore the pattern of thyroid dysfunction in chronic liver disease patients. The secondary objective was to assess the relationship between the levels of thyroid hormones and the degree of liver disease as classified by the Child-Pugh system.
Statistical Analysis
Data processing was conducted via Microsoft Excel along with statistical packages (like SPSS). All continuous variables were reported as mean \(\pm\) standard deviation and all categorical variables were reported in terms of frequency and percent. Thyroid functions FT3, FT4, TSH with respect to the severity of liver disease were correlated using the appropriate Pearson and Spearman correlation coefficients. Group comparisons were done via Student's t-test or ANOVA. A p-value of less than 0.05 was statistically significant.
Ethical Considerations
The Institutional Ethics Committee provided approval before the study commenced. The study participants provided their written informed consent before their inclusion in the study. The study ensured strict confidentiality regarding the patients’ data and maintained the patients’ anonymity during the entire study.
RESULTS:
Table 1: Demographic Characteristics
|
Variable |
Frequency |
Percentage (%) |
|
Age (Mean ± SD) |
45.2 ± 12.6 years |
— |
|
Male |
48 |
68.6% |
|
Female |
22 |
31.4% |
The baseline demographic features of the study population are detailed in Table 1. 70 patients with chronic liver disease participated in the study. The average age of the participants was 45.2 ± 12.6 years which shows that most patients are middle aged. There was a notable male predominance as males made up 68.6% of the study population while females made up 31.4%. Such an imbalance demonstrates the greater occurrence of chronic liver disease in males, likely attributable to the presence of potential causative agents like alcohol use and viral hepatitis.
Table 2: Thyroid Function Parameters
|
Parameter |
Mean ± SD |
|
FT3 (pmol/L) |
2.8 ± 0.9 |
|
FT4 (pmol/L) |
13.5 ± 3.2 |
|
TSH (mIU/L) |
4.8 ± 2.1 |
Baseline thyroid hormone function parameters among chronic liver disease patients are provided in Table 2. FT3 level data indicates that chronic liver disease (n = 109) results in a significantly reduced FT3 (2.8 ± 0.9pmol/L) when compared to normal range values. In addition, the mean FT4 (13.5 ± 3.2 pmol/L) in this population is within or slightly below normal range levels. Similarly, the mean TSH (4.8 ± 2.1 mIU/L) is elevated compared to normal range values, suggesting that some individuals with chronic liver disease may demonstrate elevation in TSH. The collective findings are consistent with altered metabolization of thyroid hormones and demonstrate the low T3 syndrome, which is often described in conjunction with chronic liver disease.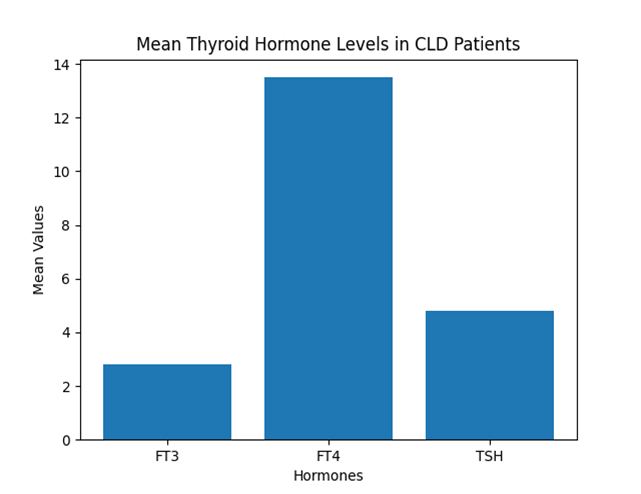
Figure 1: Mean Thyroid Hormone Levels in CLD Patients
Figure 1 shows an illustration of the average levels of thyroid hormones; FT3 is viewed as being less than FT4 with moderate TSH elevation shown in the graph. Thus, the graph visually illustrates that the levels of all three thyroid hormones are not in balance with each other. Hence, it supports the findings that there is abnormal thyroid function in individuals with chronic liver disease.
Table 3: Thyroid Function Across Child-Pugh Classes
|
Parameter |
Class A |
Class B |
Class C |
p-value |
|
FT3 |
3.4 ± 0.8 |
2.7 ± 0.7 |
2.1 ± 0.6 |
<0.001 |
|
FT4 |
15.2 ± 2.9 |
13.1 ± 2.8 |
11.8 ± 3.0 |
0.01 |
|
TSH |
3.9 ± 1.8 |
4.7 ± 2.0 |
5.6 ± 2.3 |
0.02 |
The comparative data on thyroid hormone levels by Child-Pugh criteria are presented in Table 3. The decrease in FT3 from Class A to Class C indicates there is a corresponding degree of progressive thyroid dysfunction associated with the increase in the severity of chronic liver disease. The FT4 levels also demonstrate this downward trend across Child-Pugh classes. Conversely, TSH levels demonstrate an increase in their measurements as the liver disease class progresses. The p-values support these differences being statistically significant and therefore demonstrating a strong association between chronic liver disease and thyroid function.
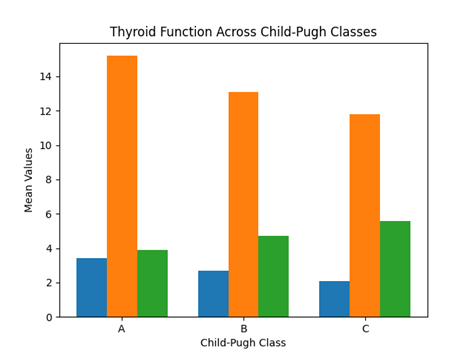
Figure 2: Thyroid Function Across Child-Pugh Classes
The graph, represented by Figure 2, displays the relationship between thyroid hormone levels and all Child-Pugh class levels. A reduction in both FT3 and FT4 and an increase in TSH is noted as the degree of liver failure progresses from Class A to Class C. This visualization provides direct evidence linking the progression of liver dysfunction (decreasing liver function) with the progression of thyroid function (increasing thyroid dysfunction).
Table 4: Distribution of Thyroid Dysfunction
|
Type of Dysfunction |
Frequency |
Percentage (%) |
|
Low T3 Syndrome |
40 |
57.1% |
|
Subclinical Hypothyroidism |
12 |
17.1% |
|
Euthyroid |
15 |
21.4% |
|
Overt Hypothyroidism |
3 |
4.3% |
The majority of individuals included in the research have been diagnosed with thyroid dysfunction according to the information presented in Table 4. The leading occurrence of thyroid dysfunction was low T3 syndrome which was observed in the majority of individuals (57.1%) included in this study. Subclinical hypothyroidism was present in 17% of patients diagnosed with thyroid dysfunction, while overt hypothyroidism accounted for only 4% of the total population. A total of 21.4% of the individuals studied were euthyroid and presented with normal biochemical laboratory results for thyroid hormones. Therefore, the findings demonstrate that thyroid dysfunction is seen in a large percentage of individuals with chronic liver disease, with nearly all cases displaying some form of low T3 syndrome.
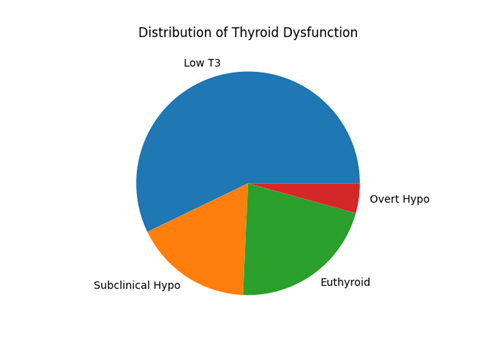
Figure 3: Distribution of Thyroid Dysfunction
Thyroid dysfunction prevalence and distribution are presented in pie chart format (Figure 3). The pie chart illustrates that the largest group of cases is represented by low T3 syndrome; subclinical hypothyroidism is the second largest group of cases; euthyroid is the third group of cases; and overt hypothyroidism is the smallest group. Therefore, the graphical format helps illustrate to readers how common thyroid abnormalities are and the pattern of thyroid conditions in the study sample.
DISCUSSION:
This research evaluated thyroid function in patients with chronic hepatic disease, highlighting previously established links between thyroid hormone metabolism and hepatic function. The present study also confirms a decrease in T3 levels as the primary abnormality observed in patients with chronic liver disease (CLD), which agrees with previous studies by Borzio et al. (1) and Van Thiel et al. (2), reporting that decreased T3 levels are the most common thyroid hormone abnormality presented in cirrhosis. The relationship between T3 and hepatic dysfunction can be explained by impaired conversion of T4 to T3 as a result of decreased activity of hepatic deiodinase enzymes, as explained by Chopra IJ (3).
Warner MH and Beckett GJ's work (4) supports the concept of 'low T3 syndrome' or 'sick euthyroid syndrome' seen in this study as a typical adaptive mechanism to chronic systemic illnesses. Chronic liver disease may adaptively decrease metabolic requirements due to substantial acute illness. In this study, FT4 levels were maintained fairly stable or had mild decline versus FT3 levels. Similar observations were made by Vincken S et al. and Verma SK et al. with respect to their findings on FT4 levels. Findings from both those studies demonstrated that FT4 levels remain well within normal limits, or declining slightly while FT3 levels decrease dramatically as the disease progresses (5,6). Thus, this provides further support for the hypothesis that impaired conversion rather than reduction in production is the primary mechanism.
TSH levels were noted to increase in this study as part of a general trend seen in other studies by Govindan MK et al. and Punekar P et al., who found elevated or high normal TSH levels to occur in patients with end-stage liver disease (7,8). This might represent a compensatory response to decreased levels of T3 in the blood. A key finding of this study was the correlation between the levels of thyroid hormones and the severity of liver disease determined by the Child-Pugh Classification system. FT3 levels progressively decreased as the severity of liver disease increased from Class A to Class C on the Child-Pugh Classification system, indicating an increase in the dysfunction of the thyroid gland as the severity and progression of the liver these illnesses have increased. Inversely related levels of T3 and severity of liver disease have been noted in previous studies conducted by Mansour-Ghanaei F et al., Patira NK et al., and Shaik et al., all of which showed T3 levels to decrease as the severity of liver disease progressed (9,10,27).
In the study being reported, low T3 syndrome occurred at a high rate (57.1%), similar to other researchers’ findings such as Neeralagi S et al., which also found a high incidence of thyroid dysfunction in patients with cirrhosis, especially in those who were most advanced in their illness (11). Therefore, this supports the need to assess the thyroid function in patients who have chronic liver disease. The connection between thyroid function and the severity of liver disease can be understood through multiple pathways such as the inability of the liver to metabolise thyroid hormone, the decreased synthesis of binding proteins for thyroid hormones, the inhibition of the deiodinase enzyme by cytokines, and malnutrition which is often seen in those who have advanced chronic liver disease. Both Malik R and Hodgson H discuss this complicated relationship between the liver and thyroid in health and disease (12).
Overall, these findings support the conclusion that thyroid dysfunction is highly prevalent and correlates with the severity of disease in those who develop chronic liver disease, and that using thyroid function tests such as FT3 values may provide useful information about disease progression and possible future outcome in these patients.
CONCLUSION:
Thyroid function irregularities are frequent in individuals who are suffering from a chronic liver condition, with abnormal T3 function being the most commonly observed result in terms of thyroid function. FT3 levels decrease significantly, while FT4 levels are either fairly stable or slightly reduced; TSH levels are trending upward as well. There is a very strong association between thyroid dysfunction and hepatic impairment, and FT3 levels are also considerably correlated with the Child-Pugh classification system, suggesting that FT3 could be used as a disease severity marker. Given that thyroid function tests are both relatively inexpensive and easy to perform, they can provide an additional source of clinical information for assessing and monitoring patients with chronic liver disease. In summary, routine assessment of thyroid function, especially FT3 levels, should become part of thorough assessment in chronic liver disease patients, as it could facilitate the evaluation of disease progression and consequently improve the overall management of these patients
REFERENCES:
1. Asrani SK, Devarbhavi H, Eaton J, Kamath PS. Burden of liver diseases worldwide. J Hepatol. 2019;70(1):151–171.
2. Mokdad AA, et al. Liver cirrhosis mortality trends. BMC Med. 2014;12:145.
3. Lozano R, et al. Global burden of disease study. Lancet. 2012;380:2095–2128.
4. Malik R, Hodgson H. The relationship between liver and thyroid. J Hepatol. 2002;36:599–606.
5. Brent GA. Mechanisms of thyroid hormone action. J Clin Invest. 2012;122:3035–3043.
6. Larsen PR, et al. Williams Textbook of Endocrinology. 13th ed. Elsevier; 2016.
7. Benvenga S, et al. Thyroid hormone transport proteins. Endocr Rev. 2002;23:38–89.
8. Stockigt JR. Free thyroid hormone measurement. Endocrinol Metab Clin North Am. 2001;30:265–289.
9. Chopra IJ. Thyroid hormone metabolism in liver disease. Endocr Rev. 1997;18:431–442.
10. Bianco AC, Kim BW. Deiodinases. Endocr Rev. 2006;27:38–89.
11. Warner MH, Beckett GJ. Sick euthyroid syndrome. Clin Endocrinol. 2010;72:131–139.
12. Boelen A, et al. Cytokines and thyroid function. J Endocrinol. 2011;209:1–13.
13. Fliers E, et al. Thyroid function in illness. Nat Rev Endocrinol. 2015;11:93–103.
14. Borzio M, et al. Thyroid function in chronic liver disease. Hepatology. 1983;3:837–842.
15. Van Thiel DH, et al. Thyroid hormones and liver disease. Hepatology. 1985;5:115–121.
16. Pugh RN, et al. Child-Pugh classification. Br J Surg. 1973;60:646–649.
17. Kamath PS, et al. MELD score. Hepatology. 2001;33:464–470.
18. Green JR, et al. Thyroid function in cirrhosis. Gut. 1977;18:14–18.
19. Kayacetin E, et al. Thyroid hormones and encephalopathy. J Gastroenterol. 2003;38:852–857.
20. Mansour-Ghanaei F, et al. Thyroid function and liver severity. Hepat Mon. 2012;12:e6095.
21. Vincken S, et al. Thyroid profile in cirrhosis. Eur J Intern Med. 2017;43:44–49.
22. Verma SK, et al. Thyroid dysfunction in cirrhosis. Int J Res Med Sci. 2017; 5:123–128.
23. Govindan MK, et al. Thyroid abnormalities in CLD. J Clin Diagn Res. 2018;12: OC01–OC05.
24. Punekar P, et al. Thyroid hormones and cirrhosis severity. J Clin Exp Hepatol. 2018; 8:143–149.
25. Patira NK, et al. Thyroid profile in cirrhosis. Int J Adv Med. 2019; 6:101–106.
26. Neeralagi S, et al. Thyroid dysfunction in alcoholic liver disease. Int J Res Med Sci. 2020; 8:221–226.
27. Shaik RA, Holyachi SK, Ahmad MS, et al. The impact of delay in HIV diagnosis on patient survival: analysis of HIV infection trends from 2007 to 2023. BMC Infect Dis. 2025;25(1):177.
28. Shaik RA, Ahmad MS, Miraj M, et al. Evaluating the burden and transmission dynamics of chikungunya virus infections in the Eastern Mediterranean Region: a systematic review and meta-analysis. Eur J Public Health. 2025;35(Suppl 1): i27–i34.