The Measurement of Splenic Volume in Adults by using CT scan and its Correlation with various Demographic Markers.
- Yusra Magrey , Senior Resident, Department of Anatomy GMC Anantnag, India.
- Jatinder Kour , Senior Resident, Department of Anatomy AIIMS Jammu, India.
- Nusrat Jabeen , Professor and Head, Department of Anatomy GMC Jammu, India.
Article Information:
Abstract:
Background: Spleen is a purple, fist sized organ and plays an important role in the immune system. The size of adult spleen is usually 9-14 cm long, 6-8 cm wide and 3-5 cm thick and its average weight lies between 70-120g. The changes in size and volume of an organ may be related to various diseases, so to detect these changes, normal anatomic values should be known. The common spleen evaluations are physical examination (deep palpation), ultrasound, MRI and CT scan are done to make an appropriate diagnosis. Aims and objectives: To estimate the splenic volumes in adults by using the computed tomography and correlation of splenic volume with various demographic markers. Methodology: This cross-sectional observational study was conducted in the Post Graduate Department of Anatomy in collaboration with the department of Radio-diagnosis and Imaging, Government Medical College, Jammu for a period of 18 months. Contrast enhanced CT (CECT) examination of abdomen was done using Somatom definition flash 256 slice multi-detector CT scan. The splenic length, width, thickness and volume were taken in to account in the study. All the data was analyzed using statistical package for Social Sciences (SPSS) software. Results: In our study among all the subjects 61% were males and 39% were females. The mean splenic volume in females was 169.87±18.65 cm3 and in males was 179.31±21.52 cm3. The overall mean splenic volume of the study population was 175.63±20.87 cm3 with statistically insignificant correlation for splenic volume in different age groups. Conclusion: The present study concluded that mean splenic volume was higher in males than in females in our study population as there was significant difference in splenic volume among male and female patients.
Keywords:
Article :
INTRODUCTION:
Spleen is a purple, fist sized organ and plays an important role in the immune system. It is slightly oval shaped and covered by a weak capsule which allow it to expand. Spleen protects from invading germs in the blood, controls the level of blood cells (white blood cells, red blood cells and platelets) and filters the blood and removes the damaged and old red blood cells 1.
The size of adult spleen is usually 9-14 cm long, 6-8 cm wide and 3-5 cm thick and its average weight lies between 70-120g. The size and weight increases during puberty and tends to diminish in old age 2. The changes in size and volume of an organ may be related to various diseases, so to detect these changes, normal anatomic values should be known. Comparison of these values produce data that can be used for diagnosing specific disease and allow the clinician to identify the grade of atrophy or hypertrophy of an organ 3. It was observed that various diseases, mainly inflammatory diseases can result in alteration of shape and size of the spleen. The various type of infectious diseases leads to enlargement of spleen. As it there are high chances of rupture of spleen 4 The common spleen evaluations are physical examination (deep palpation), ultrasound, MRI and CT scan are done to make an appropriate diagnosis 5. The computed tomography scan is a highly accurate and reproducible diagnostic tool of spleen volume for better evaluation 6. Thus, the present study was undertaken to estimate the splenic volume in adults by using the computed tomography.
Aims and Objectives
1. To measure the normal splenic volumes in adults by using CT scan.
2. To correlate the splenic volume measurements with various demographic markers.
METHODOLOGY:
This cross-sectional observational study was conducted in the Post Graduate Department of Anatomy in collaboration with the department of Radio-diagnosis and Imaging, Government Medical College, Jammu for a period of 18 months from February 2021 up to August 2022. Selection of patients was done as per the following inclusion and exclusion criteria:
INCLUSION CRITERIA
· The patients of either sex, in the age group of 20-50 years, who after the routine clinical evaluation, will undergo CT examination in the Department of Radio-diagnosis, due to various indications for the abdominal CT.
· Only those CT images, which will be declared as ‘normal’ by the radiologists will be included in this study.
EXCLUSION CRITERIA
· Presence of either clinical or CT signs of any splenic or peri-splenic pathology.
· Patients with previous splenectomy.
· Patients with difficult identification of splenic margins from the adjacent structures.
· Patients with various pathological conditions affecting the adjacent organs (stomach, peritoneum, or retroperitoneum) such as large tumors, fluid collections, massive lymph node enlargement with consecutive compression, infiltration or displacement of the spleen.
· Pregnant women.
· Patients with history of Diabetes Mellitus, Malaria.
Imaging Protocol
Contrast enhanced CT (CECT) examination of abdomen was done using Somatom definition flash 256 slice multi-detector CT scan at Government Medical College, Jammu. The following measurement (in centimeters) were taken, after identification of normal spleen on CT scans:
· Maximum Length (L) - It was measured as the greatest overall dimension of spleen on longitudinal images.
· Maximum Width (W) – It was measured as the greatest overall dimension on transverse images.
· Maximum Thickness (T) - It was measured as the distance between the hilum and the outer convex surface of the spleen keeping them perpendicular to each other.
The splenic volume was computed by using the following Standard clinical prolate ellipsoid Equation:
SV = 0.524 X L X W X T
The data was collected in a pre-defined proforma and was entered in a Microsoft Excel Spreadsheet. Continuous variables were summarized as mean and standard deviation. Categorical variables were summarized as percentages. All the data was analyzed using statistical package for social science (SPSS) software and appropriate statistical analytical tests..
RESULTS:
In our study the subjects were categorized in 3 categories according to age, i.e. 20-30 years, 31-40 years and 41-50 years, among all the subjects 61% were males and 39% were females. The female subjects were in the age group of 31-40 years and male subjects were in the age group of 20-30 years.
Table 1. Maximum splenic length.
|
Age Group |
Maximum Splenic Length (cm) |
|||||||
|
Females |
P
|
Males |
P
|
|||||
|
N |
Mean |
SD |
N |
Mean |
SD |
|||
|
20-30 |
10 |
11.050 |
0.3894 |
0.333 |
23 |
10.391 |
0.78966 |
0.037 |
|
31-40 |
18 |
10.800 |
0.6773 |
22 |
10.840 |
0.56959 |
||
|
41-50 |
11 |
10.609 |
0.8407 |
16 |
10.900 |
0.65524 |
||
|
Total |
39 |
10.810 |
0.6738 |
61 |
10.686 |
0.70981 |
||
P<0.001
Table 1 depicts the maximum splenic length among different age groups. The mean maximum splenic length in females was 10.81±0.67 cm and in males was 10.68±0.70 cm. The overall mean maximum splenic length of the study population was 10.73±0.69 cm. The mean splenic length among different age groups is not statistically significant.
Table 2. Maximum splenic width
|
Age Group |
Maximum Splenic Length (cm) |
|||||||
|
Females |
P
|
Males |
P
|
|||||
|
N |
Mean |
SD |
N |
Mean |
SD |
|||
|
20-30 |
10 |
7.7900 |
1.3295 |
0.430 |
23 |
7.7870 |
0.87402 |
0.136 |
|
31-40 |
18 |
7.2556 |
0.7382 |
22 |
7.4045 |
0.98729 |
||
|
41-50 |
11 |
7.4909 |
1.1571 |
16 |
8.0063 |
0.93842 |
||
|
Total |
39 |
7.4590 |
1.0312 |
61 |
7.7066 |
0.94936 |
||
Table 2 depicts the maximum splenic width among different age groups. The mean maximum splenic width in females was 7.45±1.03 cm and in males was 7.70±0.94 cm. The overall mean maximum splenic width of the study population was 7.61±0.98 cm. The mean splenic width among different age groups is not statistically significant.
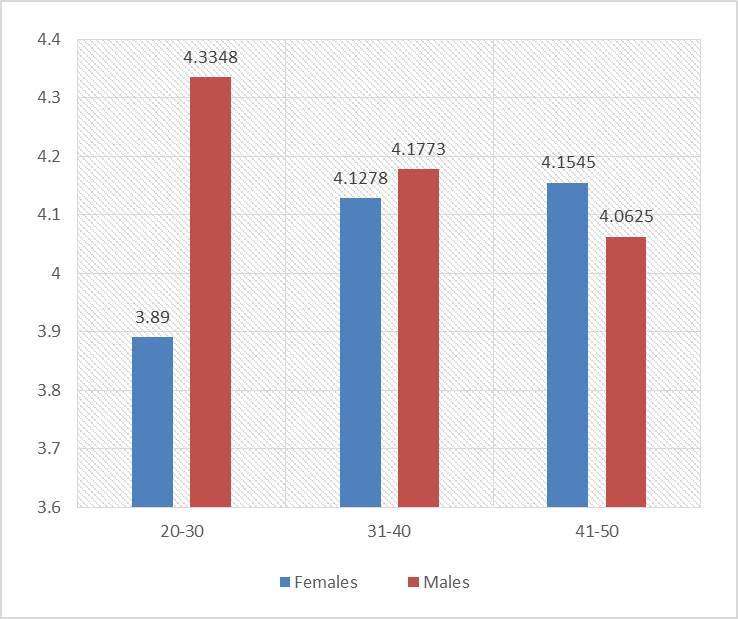
Fig 1. Maximum splenic thickness among different age groups
The mean maximum splenic thickness in females was 4.07±0.50 cm and in males was 4.20±0.56 cm. The overall mean maximum splenic thickness of the study population was 4.15±0.54 cm (Fig.1). The mean splenic thickness among different age groups is not statistically significant.
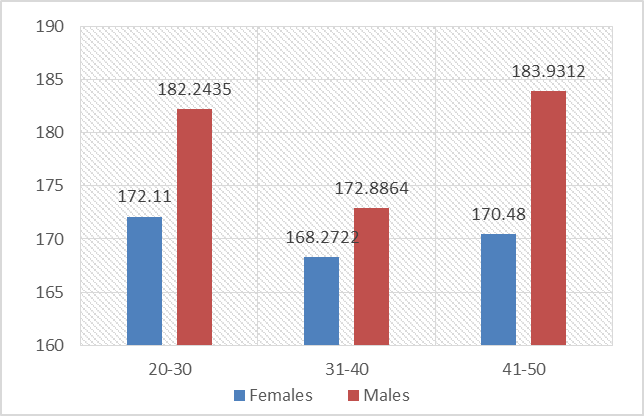
Fig.2Splenic Volume among different age groups
Fig. 2 depicts splenic volume among different age groups. The mean splenic volume in females was 169.87±18.65 cm3 and in males was 179.31±21.52 cm3. The overall mean splenic volume of the study population was 175.63±20.87 cm3. The mean splenic volume among different age groups is not statistically significant.
DISCUSSION:
The determination of the Splenic Volume has significant potential for analyzing the various clinical diagnosis. The present study aimed to measure the normal splenic volumes in adults by using CT scan and to correlate the splenic volume measurements with various demographic markers. The data was collected, analyzed and discussed with previously available literature.
In our study the subjects were categorized in 3 categories according to age, i.e. 20-30 years, 31-40 years and 41-50 years, among the majority the female subjects were in the age group of 31-40 years and male subjects were in the age group of 20-30 years. The majority of the subjects were males. The mean splenic length in females was 10.81±0.67 cm and in males was 10.68±0.70 cm. The reported overall mean splenic length of the study population was 10.73±0.69 cm. The mean splenic length among different age groups is not statistically significant. The findings are in accordance with the study conducted by Bezerra A S, et al., (2005) who observed that the mean splenic length was 9.76 cm 8. In a similar study conducted by Ehimwenma O et al., (2011) of subjects aged between 20 and 60 years, it was concluded that the mean spleen length in majority of male patients was 11.19±0.60 cm and mean spleen length in majority of female patients was 10.01±0.65cm9. There was statistical insignificant correlation between age of subjects and splenic length which is again in favour of the inference derived from the present study.
The present study found that the mean splenic width in females was 7.45±1.03 cm and in males was 7.70±0.94 cm. The overall mean splenic width of the study population was 7.61±0.98 cm. The mean splenic width among different age groups is not statistically significant. In another study conducted by Bezerra A S, et al., (2005) who reported that the mean splenic width was 11.1 cm which indicates splenomegaly, the value is higher than the results of the present study 4.
In our study it was reported that the mean splenic thickness in females was 4.07±0.50 cm and in males was 4.20±0.56 cm. The overall mean splenic thickness of the study population was 4.15±0.54 cm. The mean splenic thickness among different age groups is not statistically significant. The findings are in accordance with the study conducted by Kumar G et al., (2021) who reported the mean splenic thickness was 3.69 ± 0.05 cm 9. In another study conducted by Caglar V et al., (2014) it was found that the mean splenic thickness was 4.58 ±0.8 cm which is also in favour of the present study3.
The present study reported that the mean splenic volume in females was 169.87±18.65 cm3 and in males was 179.31±21.52 cm3. The overall mean splenic volume of the study population was 175.63±20.87 cm3. The mean splenic volume among different age groups is not statistically significant. The outcomes of the present study are in accordance with the studies conducted by Asghar A et al., (2011), Caglar V et al., (2014), Siddiqui M A et al., (2014) and Singh VK et al., (2015) found that the mean splenic volume was 161.57 ± 90.2 cm³, 198 ± 88cm³, 161.42 ± 54.91 cm3 and 140-184 cm3 respectively 10,3,11,4..
CONCLUSION:
The present observational study concluded that mean splenic volume was higher in males than in females in our study population as there was significant difference in splenic volume among male and female patients. The mean splenic volume in females was 169.87±18.65 cm3 and in males was 179.31±21.52 cm3. Nomograms from this data can be used by clinicians to estimate more accurately the degree of atrophy or hypertrophy of organs in certain disorders and thus, avoid false positive and false negative diagnosis of pathological enlargement or reduction of spleen in clinical practice.
REFERENCES:
1. NHS. Spleen problems and spleen removal. Available at:https://www.nhs.uk/conditions/spleen-problems-and-spleen-removal.
2. Standring, S. Spleen, Gray’s Anatomy. The Anatomical basis of clinical practice, 41st Ed. King’s Col London, UK. 2016;1188.
3. Caglar V., Alkoc O.A., Uygur R., Serdaroglu O., Ozen O.A. Determination of normal splenic volume in relation to age, gender and body habitus: a stereological study on computed tomography. Folia Morphol. 2014;73(3):331–338.
4. Jacob HS. Splenomegaly. MSD Manual Professional Version. 2022. Available at: https://www.msdmanuals.com/en-in/professional/hematology-and-oncology/spleen-disorders/splenomegaly.
5. Hoffman M. Picture of the spleen. WebMD.2021. Available at: https://www.webmd.com/digestive-disorders/picture-of-the-spleen.
6. Rabushka LS, Kawashima A, Fishman EK. Imaging of the spleen: CT with supplemental MR examination. Radiographics. 1994;14:307– 332.
7. Bezerra AS, D’Ippolito G, Faintuch S, Szejnfeld J, Ahmed M. Determination of Splenomegaly by CT: Is There a Place for a Single Measurement. AJR. 2005; 184:1510–1513.
8. Ehimwenma O, Tagbo MT. Determination of normal dimension of the spleen by ultrasound in an endemic tropical environment.Niger Med J. 2011; 52(3): 198-203.
9. Kumar G, Kumar V, Kumari M, Mishra H., T.I. Suruthi. Abdominal CT scan based estimation of splenic index and splenic volume in north Indian adults. J Evolution Med Dent Sci. 2021; 10(33): 2749-2753.
10. Asghar A, Agrawal D, Yunus SM, Sharma PK, Zaidi SH, Sinha A. Standard Splenic Volume Estimation in North Indian Adult Population: Using 3D Reconstruction of Abdominal CT Scan Images. Anat Res Int. 2011;707325.
11. Siddiqui M A, Hassan A. Ali, A. Abdelmohsen Bedewi M., O. Serhan O. Estimation of Standard Splenic Volume in Saudi Arabian Adult Population: Using 3D Reconstruction of Abdominal CT Scan Images. Open Journal of Internal Medicine. 2014;4:7-12.
12. Singh VK, Khare R, Shankar P, Singh D, Kumar A, Dixit RK. Estimation of splenic volume in Indian adult population by Ultrasonography and its comparison with CT scan. World J of Pharma Res. 2015; 4(10): 2159-63.