Inducible Clindamycin Resistance among Staphylococcal Species: A Comparative Study.
- Mohammed Hameeda Tasneem , IInd Year Post Graduate, Department of Microbiology, Guntur Medical College , Guntur, Andhra Pradesh, India.
- Nazia Begum Mohammed , Assistant Professor, Department of Microbiology, Guntur Medical College, Guntur, Andhra Pradesh, India.
- V. Naga Madhavi , Assistant Professor, Department of Microbiology, Guntur Medical College, Guntur, Andhra Pradesh, India.
Article Information:
Abstract:
Background: Staphylococci are among the most important human pathogens and are associated with considerable morbidity and mortality because of increasing antimicrobial resistance. Clindamycin remains a valuable therapeutic option for the treatment of staphylococcal infections; however, inducible clindamycin resistance may result in therapeutic failure if it is not detected routinely. Aim: To detect and compare inducible clindamycin resistance among Staphylococcus species by using the phenotypic D-test. Objectives: To isolate and identify Staphylococcus aureus and coagulase-negative staphylococci [CoNS] from various clinical specimens and to compare their antimicrobial resistance patterns, with special emphasis on inducible clindamycin resistance. Methods: A total of 200 staphylococcal isolates, including S. aureus and CoNS, were obtained from various clinical samples. Identification was performed using standard microbiological methods. Inducible clindamycin resistance was detected phenotypically by the D-test using erythromycin and clindamycin discs placed 15 mm apart, centre to centre, in accordance with CLSI guidelines. Results: Of the 200 isolates, 165 were S. aureus and 35 were CoNS. Among the S. aureus isolates, 90 were methicillin-sensitive S. aureus [MSSA] and 75 were methicillin-resistant S. aureus [MRSA]. Among the CoNS isolates, 20 were methicillin-sensitive CoNS [MSCoNS] and 15 were methicillin-resistant CoNS [MRCoNS]. Phenotypic analysis showed the presence of inducible MLSB [iMLSB], constitutive MLSB [cMLSB], MS, and S phenotypes, with frequencies of 3.63%, 95.74%, 61.54%, and 39.03%, respectively. Conclusion: The D-test is an essential phenotypic method for detecting inducible clindamycin resistance in staphylococcal isolates. Routine performance of the D-test in clinical microbiology laboratories is necessary to avoid inadvertent use of clindamycin and to ensure appropriate antimicrobial therapy for infected patients.
Keywords:
Article :
INTRODUCTION:
Staphylococcus aureus and coagulase-negative staphylococci [CoNS] are important human pathogens responsible for a wide spectrum of both community-acquired and hospital-acquired infections worldwide [1]. These organisms are increasingly associated with significant morbidity because of their growing resistance to commonly used antimicrobial agents. In particular, the rising prevalence of methicillin-resistant strains has further limited available therapeutic options and complicated clinical management.
Macrolide-Lincosamide-Streptogramin B [MLSB] antibiotics act by inhibiting bacterial protein synthesis. Resistance to MLSB antibiotics in staphylococci is commonly mediated by erm genes, which encode ribosomal methylases. This resistance may be expressed either constitutively, in which methylase is continuously produced, or inducibly, in which methylase production occurs only in the presence of an inducing agent such as a macrolide. Erythromycin is a potent inducer of erm-mediated resistance [2].
Clindamycin is widely used in the treatment of staphylococcal infections, particularly in cases involving skin and soft tissue infections and infections caused by multidrug-resistant strains. Its advantages include good tissue penetration, oral bioavailability, and the ability to serve as an alternative in penicillin-allergic patients. However, increasing clindamycin resistance, especially inducible resistance, poses a major therapeutic challenge because isolates that appear susceptible in routine in vitro testing may become resistant during treatment, leading to clinical failure [3].
The phenotypic D-test is a simple and reliable method for detecting inducible clindamycin resistance in erythromycin-resistant staphylococcal isolates. Early identification of this resistance pattern is essential for guiding appropriate antimicrobial therapy and avoiding inadvertent use of clindamycin in resistant infections [4]. The present study was undertaken to assess and compare inducible clindamycin resistance among Staphylococcus species using the D-test.
Aim
To detect and compare inducible clindamycin resistance among Staphylococcus species using the phenotypic D-test.
Objectives
To isolate and identify Staphylococcus aureus and coagulase-negative staphylococci [CoNS] from various clinical specimens.
To compare the antimicrobial resistance patterns of these isolates, with special emphasis on inducible clindamycin resistance.
MATERIALS AND METHODS:
This prospective study was conducted over a period of 6 months in the Department of Microbiology, Guntur Medical College, Guntur.
Inclusion criteria
Patients of all age groups were included in the study.
Clinical specimens such as blood, urine, pus, and other body fluids received in the microbiology laboratory were included.
Exclusion criteria
Organisms other than Staphylococcus aureus and coagulase-negative staphylococci [CoNS] were excluded from the study.
Patients already receiving antibiotic therapy were excluded.
Procedure
A total of 200 clinical specimens, including blood, urine, pus, and other body fluids, were collected aseptically and processed according to standard microbiological procedures. The specimens were cultured on Blood agar and MacConkey agar and incubated aerobically at 35°C for 24 hours. Identification of staphylococcal isolates was carried out on the basis of colony morphology, Gram staining, catalase test, mannitol fermentation test, and coagulase test. Antimicrobial susceptibility testing was performed by the Kirby-Bauer disc diffusion method on Mueller-Hinton agar in accordance with Clinical and Laboratory Standards Institute [CLSI] guidelines.
Phenotypic detection of inducible clindamycin resistance was performed by the D-test using erythromycin [15 µg] and clindamycin [2 µg] discs placed at a distance of 15 mm from edge to edge, as recommended by CLSI guidelines. A small correction for scientific accuracy: the usual CLSI-described spacing for the D-test is commonly reported as 15–26 mm edge-to-edge, while many papers also mention 15 mm. If your department protocol specifically used 15 mm, keep it as such for consistency.
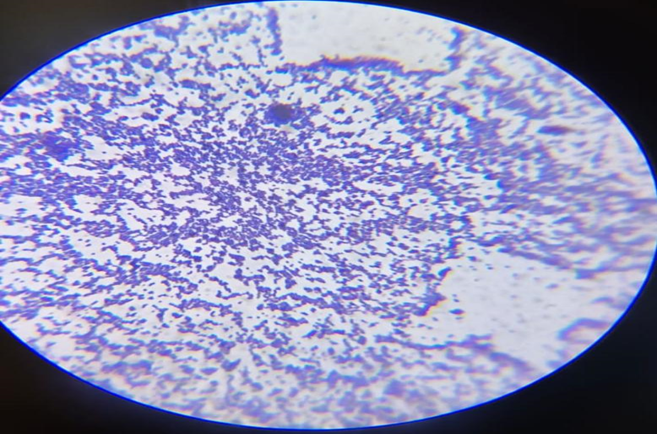
Figure 1: Gram staining revealed gram-positive cocci arranged in clusters.
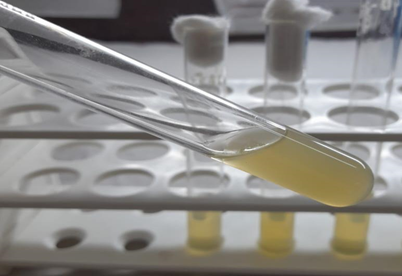
Figure 2: Coagulase test: clot is formed (Positive)

Figure 3: Coagulase test: clot not formed (Negative)
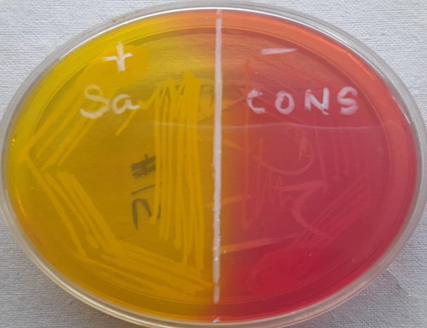
Figure 4: Mannitol fermentation by Staphylococcus aureus (+) and CONS (-)
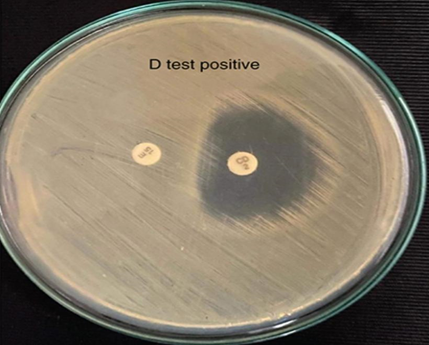
D test
Figure 5: D-Test for Inducible Clindamycin Resistance (iMLSB)
Prepare a lawn culture of isolate was prepared adjusted to 0.5 McFarland standard on Mueller Hinton agar, Erythromycin and Clindamycin discs were placed 15 mm apart (centre-to-centre). Routine antibiotic susceptibility testing was performed alongside. D-shaped flattening around clindamycin disc indicated a positive test (inducible resistance, clindamycin was not used). No flattening, with a circular zone indicated a negative test (clindamycin could be safely used).
Interpretation of different phenotypes
As shown in Table-1
Sensitive (S) phenotype: Sensitive to both E (>23mm) and CD (>21mm).
Constitutive clindamycin (cMLSB) phenotype: Resistance to both E (<13mm) and CD (<14mm).
Inducible clindamycin Resistance (iMLSB) phenotype: E (<13mm) resistance and CD (>21mm) sensitive giving a D shape zone around CD with flattening towards E disc (D test positive).
Macrolide Streptogramin B (MS) phenotype: E (<13mm) Resistance and CD (>21mm) Sensitive giving circular zone, no flattening of the CD zone ( D test negative).
CLSI M100-Performance Standards for Antimicrobial Susceptibility Testing¹⁴.
|
Phenotype |
E |
Zone of inhibition (mm) |
CD |
Zone of inhibition (mm) |
Final Interpretation |
|
S |
S |
≥23mm |
S |
≥21mm |
Sensitive to both E and CD |
|
cMLSB |
R |
≤13mm |
R |
≤14mm |
Resistance to both E and CD |
|
iMLSB (D-test positive) |
R |
≤13mm |
S |
≥21mm |
CD appear sensitive but should be reported as Resistance |
|
MS (D-test negative) |
R |
≤13mm |
S |
≥21mm |
True CD Sensitive |
Table -1 Interpretation of zone sizes of Erythromycin and Clindamycin in Staphylococcus
Antibiotics Tested (with concentrations):
Amikacin (30 µg), Ampicillin (10 µg), Cefoxitin (30 µg), Clindamycin (2 µg), Doxycycline (30 µg), Erythromycin (15 µg), Gentamicin (10 µg), Linezolid (30 µg), Nitrofurantoin (300 µg), Vancomycin (5 µg).
Quality Control: Staphylococcus aureus ATCC 25923.
Ethical considerations
Prior to commencement of the study, ethical approval was obtained from the Institutional Ethics Committee of Guntur Medical College, Guntur. The study protocol was reviewed and approved under IEC approval number GMC/IEC/12/2025, dated 30-07-2025. The study was conducted in accordance with the ethical principles laid down in the Declaration of Helsinki and institutional research guidelines. Written informed consent was obtained from all study participants or their legally authorized representatives before enrolment. Confidentiality of patient information was strictly maintained throughout the study, and all collected data were used solely for research purposes
RESULTS:
Of the 200 staphylococcal isolates studied, 165 [82.5%] were Staphylococcus aureus and 35 [17.5%] were coagulase-negative staphylococci [CoNS]. Blood was the most common clinical specimen yielding staphylococcal isolates [89, 44.5%], followed by pus [80, 40%], urine [25, 12.5%], and body fluids [6, 3%]. Overall, Staphylococcus aureus was the predominant isolate, comprising MSSA in 90 [45%] and MRSA in 75 [37.5%] cases, whereas CoNS included MSCoNS in 20 [10%] and MRCoNS in 15 [7.5%] cases. Among blood isolates, MSSA, MRSA, MSCoNS, and MRCoNS constituted 30 [33.7%], 28 [31.5%], 20 [22.5%], and 11 [12.4%], respectively. Pus samples predominantly yielded S. aureus, with MSSA and MRSA accounting for 39 [48.8%] and 37 [46.2%] isolates, respectively, while MRCoNS accounted for 4 [5%]. Urine specimens yielded only S. aureus, with MSSA in 15 [60%] and MRSA in 10 [40%] isolates. All isolates obtained from body fluids were MSSA [6, 100%]. The specimen-wise distribution of isolates is shown in Table 2 and Figure 1.
Table-2 Sample wise distribution of Staphylococcal isolates
|
Sample |
S.aureus(165) |
CONS(35) |
|||
|
MSSA |
MRSA |
MSCNS |
MRCNS |
||
|
BLOOD(89) |
30(33.7%) |
28(31.5%) |
20(22.5%) |
11(12.4%) |
|
|
PUS(80) |
39(48.8%) |
37(46.2%) |
0 |
4(5%) |
|
|
FLUID(6) |
6(100%) |
0 |
0 |
0 |
|
|
URINE(25) |
15(60%) |
10(40%) |
0 |
0 |
|
|
TOTAL |
90(45%) |
75(37.5%) |
20(10%) |
15(7.5%) |
|
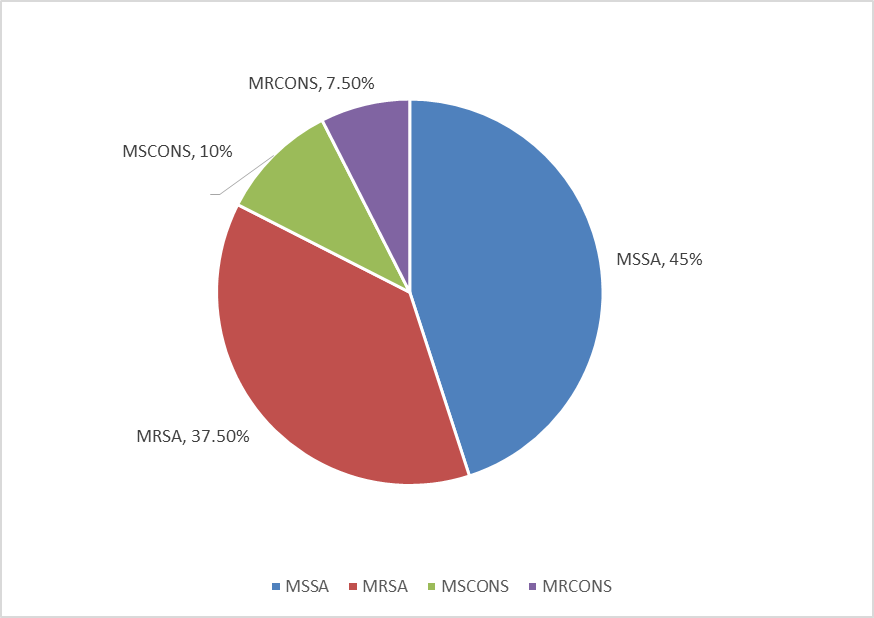
Figure: 1 Distribution of Staphylococcal isolates.
Antibiotic resistance
The antimicrobial resistance pattern revealed that Staphylococcus aureus isolates exhibited higher resistance rates than coagulase-negative staphylococci [CoNS]. Among S. aureus isolates, erythromycin showed the highest resistance [48%], followed by cefoxitin [37.5%], suggesting a considerable burden of methicillin-resistant Staphylococcus aureus [MRSA]. Clindamycin resistance was observed in 29.5% of isolates, emphasizing the need for D-test performance to detect inducible clindamycin resistance. Resistance to gentamicin and ciprofloxacin was 21% and 16.5%, respectively, whereas resistance to cephalosporins was 15%. Linezolid resistance was comparatively low [8.5%]. In contrast, CoNS isolates demonstrated lower overall resistance. Erythromycin resistance was the highest among CoNS [16%], followed by cefoxitin [12%], cephalosporins [11%], and clindamycin [10.5%]. Resistance to gentamicin and linezolid was 5.5% each, while ciprofloxacin showed the lowest resistance [2.5%]. The comparative antibiotic resistance pattern of Staphylococcus aureus and CoNS is shown in Figure 2.
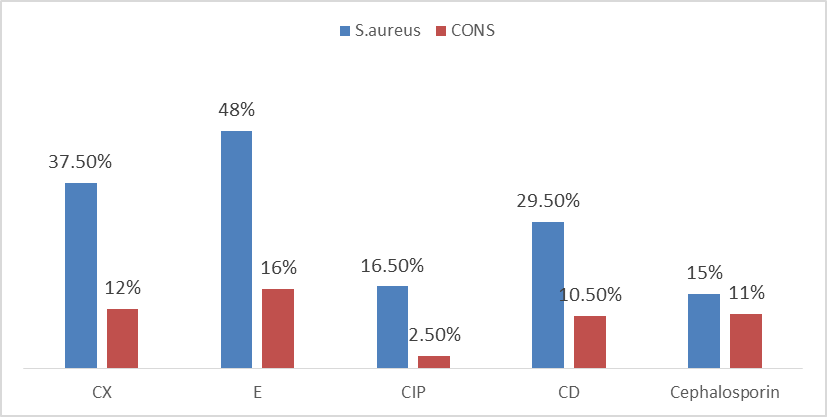
Figure: 2 Antibiotic Resistance-S.aureus vs CONS
Clindamycin resistance
Clindamycin resistance showed a clear association with methicillin resistance among staphylococcal isolates. Among Staphylococcus aureus, resistance to clindamycin was markedly higher in methicillin-resistant Staphylococcus aureus [MRSA], with 47 of 75 isolates [62.7%] resistant and 28 [37.3%] sensitive. In contrast, among methicillin-sensitive Staphylococcus aureus [MSSA], only 12 of 90 isolates [13.3%] were resistant, whereas 78 [86.7%] were sensitive, indicating better clindamycin activity against methicillin-sensitive isolates. A similar trend was observed among coagulase-negative staphylococci [CoNS], with greater clindamycin resistance among methicillin-resistant CoNS than among methicillin-sensitive CoNS. Overall, clindamycin resistance was more frequent among methicillin-resistant staphylococcal isolates than among methicillin-sensitive isolates, indicating an association between methicillin resistance and reduced clindamycin susceptibility.
D - test
Of the 200 staphylococcal isolates studied, 6 [3%] demonstrated a positive D-test, indicating inducible clindamycin resistance. Among MRSA isolates obtained from blood samples, 4 of 56 [7.14%] were D-test positive, whereas among MSSA isolates recovered from pus samples, 2 of 109 [1.83%] showed D-test positivity. Most isolates were D-test negative [194, 97%], as depicted in Table 3.
Table-3 Findings of D-Test
|
Organism |
Phenotype |
Total Isolates |
D Test positive |
D Test negative |
|
S.aureus(165) |
MRSA |
56 |
4(7.14%) |
52(92.86%) |
|
MSSA |
109 |
2(1.83%) |
107(98.17%) |
|
|
CONS(35) |
MRCNS |
9 |
0 |
9(100%) |
|
MSCNS |
26 |
0 |
26(100%) |
|
|
Total |
200 |
6(3%) |
194(97%) |
Table 4 shows the distribution of clindamycin susceptibility phenotypes among the staphylococcal isolates. The iMLSB phenotype was observed in 6 isolates, including 4 [2.42%] MRSA and 2 [1.21%] MSSA. The cMLSB phenotype was observed in 80 isolates, including 12 [7.27%] MRSA, 47 [28.48%] MSSA, 2 [5.71%] MRCoNS, and 19 [54.28%] MSCoNS. The MS phenotype was identified in 57 isolates, of which 31 [18.78%] were MRSA, 14 [8.48%] were MSSA, 7 [20%] were MRCoNS, and 5 [14.28%] were MSCoNS. The S phenotype was also seen in 57 isolates and comprised 9 [5.45%] MRSA, 46 [27.87%] MSSA, and 2 [5.71%] MSCoNS isolates.
Table-4 Phenotypes of Staphylococcal isolates
|
|
Phenotype |
iMLSB |
cMLSB |
MS |
S |
|
Staphylococcus aureus(165) |
MRSA (56) |
4 (2.42%) |
12 (7.27%) |
31 (18.78%) |
9 (5.45%) |
|
MSSA (109) |
2 (1.21%) |
47 (28.48%) |
14 (8.48%) |
46 (27.87%) |
|
|
Coagulase negative staphylococcus (35) |
MRCNS (9) |
0 |
2 (5.71%) |
7 (20%) |
0 |
|
MSCNS (26) |
0 |
19 (54.28%) |
5 (14.28%) |
2 (5.71%) |
|
|
Total(200) |
|
6 (3.63%) |
80 (95.74%) |
57 (61.54%) |
57 (39.03%) |
DISCUSSION:
The present study evaluated inducible clindamycin resistance among Staphylococcus aureus and coagulase-negative staphylococci [CoNS] isolated from clinical specimens by using the phenotypic D-test. In the current series, S. aureus constituted the majority of isolates, erythromycin resistance was the most frequent resistance pattern, and clindamycin resistance was more prominent among methicillin-resistant isolates than among methicillin-sensitive isolates. The overall frequency of D-test positivity in the present study was low, whereas constitutive MLSB resistance was more common, indicating that constitutive resistance was the predominant clindamycin resistance phenotype in this setting.
These findings are comparable with earlier reports showing that resistance to macrolide-lincosamide-streptogramin B antibiotics is an important therapeutic concern in staphylococci. Gadepalli et al. [7] documented inducible clindamycin resistance in clinical isolates of S. aureus and highlighted its clinical relevance. Mokta et al. [8] reported that 30.85% of S. aureus isolates were resistant to clindamycin, with 13.71% showing inducible MLSB resistance and 17.14% constitutive resistance. In the Kashmir Valley study by Akhter et al. [9], inducible resistance was particularly high among MRSA isolates, with iMLSB, cMLSB, MS, and sensitive phenotypes reported in 42.5%, 10.5%, 28%, and 19% of MRSA isolates, respectively. Together, these observations support the view that clindamycin resistance patterns vary considerably across institutions and regions, with methicillin-resistant strains generally demonstrating a greater burden of resistance than methicillin-sensitive strains.
The present study also aligns with other Indian studies that emphasized the importance of distinguishing inducible resistance from true clindamycin susceptibility. Prabhu et al. [10] found inducible and constitutive resistance rates of 10% and 9%, respectively, with both phenotypes being more frequent in MRSA than in MSSA. Ciraj et al. [11] reported inducible clindamycin resistance in 13.1% of clinical staphylococcal isolates, demonstrating that this phenotype is not restricted to S. aureus alone and may also occur in CoNS. Juyal et al. [12] observed D-test positivity in 33.6% of erythromycin-resistant and clindamycin-susceptible discordant isolates and concluded that routine D-testing is necessary to avoid false susceptibility reporting. Likewise, Lall and Sahni [13] reported an overall MLSBi prevalence of 20.3%, with inducible resistance particularly frequent in MRSA. Compared with these studies, the lower iMLSB prevalence in the present study may reflect differences in local antibiotic pressure, specimen profile, institutional prescribing practices, and circulating staphylococcal strains.
An important observation in the present study was the predominance of cMLSB phenotype over iMLSB phenotype. This suggests that constitutive erm-mediated resistance may be more prevalent in the study population than inducible resistance. However, even a relatively low proportion of iMLSB isolates remains clinically significant, because these isolates may appear clindamycin-susceptible on routine testing but can become resistant during therapy, leading to therapeutic failure. Therefore, the D-test retains major practical importance in routine microbiology reporting. The presence of MS phenotype in a subset of isolates is also clinically relevant, because such isolates are truly clindamycin-susceptible despite erythromycin resistance and should not be misclassified as resistant in the absence of a positive D-test. These distinctions have direct implications for antimicrobial stewardship and appropriate drug selection in staphylococcal infections.
Overall, the present study reinforces the importance of routine phenotypic detection of inducible clindamycin resistance in erythromycin-resistant staphylococcal isolates. Standardized antimicrobial susceptibility interpretation should remain aligned with CLSI M100 guidance [14]. In view of the variability in inducible and constitutive resistance rates reported across studies [7-13], local surveillance data are essential for guiding empirical therapy, preventing inadvertent clindamycin use in inducibly resistant isolates, and supporting rational antibiotic policy in the hospital setting.
CONCLUSION:
Inducible clindamycin resistance cannot be reliably detected by routine antibiotic susceptibility testing alone. The D-test is a simple, inexpensive, reliable, and easily performed phenotypic method for identifying inducible clindamycin resistance in erythromycin-resistant and clindamycin-sensitive staphylococcal isolates. Routine use of the D-test in clinical microbiology laboratories is essential to ensure accurate susceptibility reporting and to prevent inadvertent use of clindamycin in isolates that may subsequently express resistance during therapy. Failure to detect this resistance may lead to therapeutic failure and inappropriate clinical management. As the prevalence of inducible clindamycin resistance varies across different geographic regions, regular surveillance and local antibiogram-based assessment are necessary before initiating empirical therapy. The present study emphasizes the need for routine D-test testing as part of standard laboratory practice to support appropriate antimicrobial therapy and strengthen antibiotic stewardship.
REFERENCES:
1. Koppad M, Parameshwar S, Halesh LH, Siddesh KC. Detection of inducible clindamycin resistance in Staphylococcus aureus and CoNS at tertiary care hospital. Indian J Microbiol Res. 2015;2(4):192-7.
2. Tanmaya S, Dhanalakshmi TA, Venkatesha D. Antibiogram of staphylococcal isolates with special reference to inducible clindamycin resistance. Indian J Microbiol Res. 2019;6(4):323-7. doi:10.18231/j.ijmr.2019.069.
3. Janardhan KVB, Venkata Ramana P, Suryamani C. Phenotypic detection of inducible clindamycin resistance in Staphylococcus species isolated from clinical samples in a tertiary care hospital. Int J Adv Res. 2023;11(3):178-83. doi:10.21474/IJAR01/16404.
4. Suneel KA, Nagasrilatha B, Smiline GAS. Inducible clindamycin resistance in coagulase-negative staphylococci. Int J Health Sci. 2022;6(S1):9639-48. doi:10.53730/ijhs.v6nS1.7253.
5. Kadam K, Patil S, Totad RD, Warad SR, Nakate P. Detection of inducible clindamycin resistance in Staphylococcus aureus isolated from different clinical samples. Al Ameen J Med Sci. 2024;17(2):141-6.
6. Singh P, Mane P, Singla P, Sangwan J. Prevalence of inducible clindamycin resistance in Staphylococcus: a study from a rural teaching tertiary care hospital in Southern Haryana. Natl J Lab Med. 2021;10(2):MO06-MO09. doi:10.7860/NJLM/2021/46903.2461.
7. Gadepalli R, Dhawan B, Mohanty S, Kapil A, Das BK, Chaudhry R. Inducible clindamycin resistance in clinical isolates of Staphylococcus aureus. Indian J Med Res. 2006;123(4):571-3.
8. Mokta KK, Verma S, Chauhan D, Ganju SA, Singh D, Kanga A, et al. Inducible clindamycin resistance among clinical isolates of Staphylococcus aureus from sub-Himalayan region of India. J Clin Diagn Res. 2015;9(8):DC20-3. doi:10.7860/JCDR/2015/13846.6382.
9. Akhter S, Nazir A, Karnain O, Rouf M. Prevalence of constitutive and inducible clindamycin resistance among methicillin-resistant Staphylococcus aureus isolates in a tertiary care hospital, Kashmir Valley. J Med Microbiol Infect Dis. 2022;10(3):104-13. doi:10.52547/JoMMID.10.3.104.
10. Prabhu K, Rao S, Rao V. Inducible clindamycin resistance in Staphylococcus aureus isolated from clinical samples. J Lab Physicians. 2011;3(1):25-7.
11. Ciraj AM, Vinod P, Sreejith G, Rajani K. Inducible clindamycin resistance among clinical isolates of staphylococci. Indian J Pathol Microbiol. 2009;52(1):49-51.
12. Juyal D, Shamanth AS, Pal S, Sharma MK, Prakash R, Sharma N. The prevalence of inducible clindamycin resistance among staphylococci in a tertiary care hospital: a study from the Garhwal Hills of Uttarakhand, India. J Clin Diagn Res. 2013;7(1):61-5. doi:10.7860/JCDR/2012/4877.2671.
13. Lall M, Sahni AK. Prevalence of inducible clindamycin resistance in Staphylococcus aureus isolated from clinical samples. Med J Armed Forces India. 2014;70(1):43-7.
14. Clinical and Laboratory Standards Institute. Performance standards for antimicrobial susceptibility testing. 36th ed. CLSI supplement M100. Wayne, PA: Clinical and Laboratory Standards Institute; 2026.