Management of Antenatal Anemia and Effects on Materno-Fetal Outcome - A retrospective Analysis
- Manimegalai K , Assistant Professor, Department of Obstetrics and Gynecology, Dhanalakshmi Srinivasan Medical College and Hospital, Siruvachur, Perambalur, Tamil Nadu, India.
- Prithisha S , Intern, Medical Undergraduate, Dhanalakshmi Srinivasan Medical College and Hospital, Siruvachur, Perambalur, Tamil Nadu, India.
- Geetha J , Professor, Department of Anaesthesia, Dhanalakshmi Srinivasan Medical College and Hospital, Siruvachur, Perambalur, Tamil Nadu, India.
- B. U. Ilayaraja. , Postgraduate in Anesthesia, Department of Anaesthesia, Dhanalakshmi Srinivasan Medical College and Hospital, Siruvachur, Perambalur, Tamil Nadu, India.
Article Information:
Abstract:
Background: Anemia is a global problem that significantly affect the morbidity and mortality of a population. Iron deficiency anemia is the commonest in pregnancy. Pregnancy anemias are classified into MILD, MODERATE and SEVERE ranging from up to 11grams% of Hemoglobin to less than 7grams%. Pregnancy anemia are often linked to an increased risk of maternal fetal and neonatal health outcomes. The likelihood of these outcomes depends on case severity, Gestational timing onset and duration of anemia. Moderate to Severe anemia in our Centre has been managed by Parenteral Iron or blood Transfusion. This study retrospectively analyses the effects of pretreatment hemoglobin, type of management on mode of delivery and fetal wellbeing at birth. MATERIALS AND METHODS: Study Place: Dhanalakshmi Srinivasan Medical College, Siruvachur Perambalur. Study Period: Aug 2025 to Feb 2026. Study Popolation: Pregnant ladies attending obstetric outpatient, Study: Retrospective analysis of case records, Sample Size: 100, Parameters: Age, trimester at which they attended our OP, Haemoglobin, Packed cell volume, red cell width distribution, mean corpuscular volume at the time of antenatal evaluation, treatment received in the form of iron sucrose or blood transfusions, mode of delivery on C-section and foetal APGAR at 1min for two minutes and every 5minutes thereafter for four values (20minutes). RESULTS: • Hemoglobin versus type of delivery by T test and Chi-Square did not show any significant associations. • Maternal pretreatment hemoglobin and APGAR did not show any linear correlation by Pearsor or spearman correlations. • Age of the mother did not significantly correlate fetal APGAR. • Parenteral iron and blood transfusion modes had equal distribution in the sample, and no significant association was noted with fetal APGAR. • Thus, neonatal outcomes were stable across groups. CONCLUSION • Anemia did not impact the type of delivery neither the mode of treatment for anemia did not impact neonatal outcomes. • First trimester severe anemia may affect fetal growth and development which was not found in our sample. • Management and correction of antenatal anemia may have significant impact on the woman's morbidity during her postnatal course of life. • Tracking of anemia and correction by supplements may be recommended throughout the reproductive age span of females.
Keywords:
Article :
INTRODUCTION:
Maternal mortality rate and infant mortality rate constitute the essential factors affecting the development of a country as the indices of socio-economic well-being of the population. 20-40% of maternal mortality is caused by moderate to severe anaemia
MMR was 88 per one lakh birth based on 2020-2022 statistics, the target of 70 is to be achieved by 2030. More than 40-60% of pregnant women are anaemic, the preventable cause of female morbidity and mortality blood loss from menorrhagia at menarche and nutritional deficiency before pregnancy often falls into the three classes of anaemia mild <11g% of haemoglobin, moderate <9g% and severe <7g% values during pregnancy both due to physiological changes in the mother and increased demand by the foetus. Several worldwide and Indian obstetric societies along with WHO have been forming strategies, recommendations and various surveys to tackle the increasing burden of iron deficiency anaemia which is the predominant cause of pregnancy anaemia.
In this study we have attempted to analyse the management of antenatal anaemia in our institutions. In the last six months where most were managed by either parenteral iron sucrose or blood transfusion, and how the treatment modalities affected the maternal and foetal outcome on delivery.
Aims and Objectives
1. To classify anaemia in pregnant women attending obstetric outpatient by lab values and note types of management received.
2. To follow and detect mode of delivery and foetal APGAR in antenatal anaemic patients.
3. To correlate antenatal haemoglobin and packed cell volume with the treatment receive namely iron therapy and blood transfusion and foetal APGAR.
MATERIALS AND METHODS:
Study Place
Dhanalakshmi Srinivasan Medical College, Siruvachur Perambalur.
Study Period
Aug 2025 to Feb 2026.
Study Population
Pregnant ladies attending obstetric outpatient.
Study
Retrospective analysis of case records.
Sample Size
100
Parameters
Age, trimester at which they attended our OP, Haemoglobin, Packed cell volume, red cell width distribution, mean corpuscular volume at the time of antenatal evaluation, treatment received in the form of iron sucrose or blood transfusions, mode of delivery whether normal vaginal delivery or C-section and foetal APGAR at 1min for two minutes and every five minutes thereafter for four values (20minutes).
The Data were Tabulated and Analysed
· Haemoglobin reduction was associated predominately with fall in MCV (r=0.49) denoting Microcytic hypochromic anaemia as the major type of anaemia.
· An increased in RDW was associated well with fall in haemoglobin denoting anisocytosis with anaemia.
· Most of the anaemia patients in our study sample belonged to moderate anaemia.
· The type of management namely iron therapy or blood transfusion had no significant correlation with type of delivery namely natural labour or Operational delivery.
· The severity of anaemia had no significant correlation with type of delivery.
· No significant correlation with 1minute, 5minutes and extended APGAR of the newborn with type of treatment for anaemia, whether blood transfusion or iron therapy
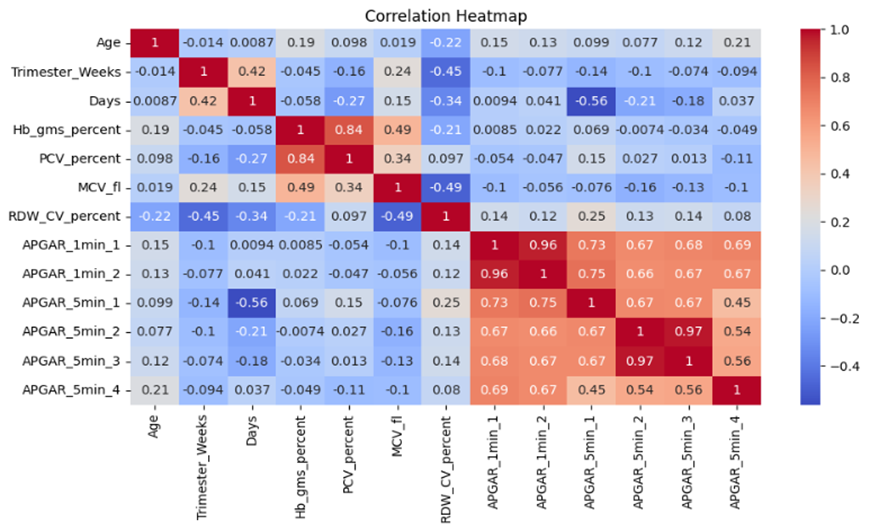
Figure 1: Correlation Heat Map
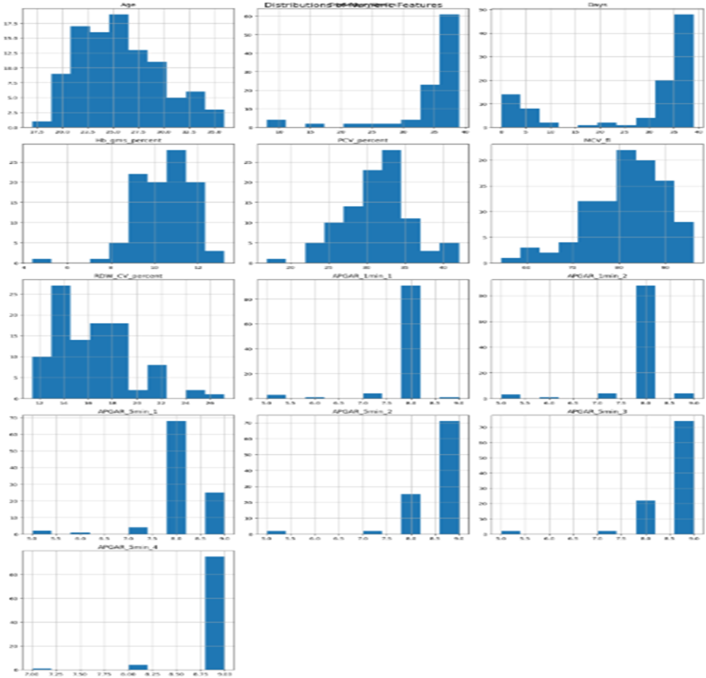
Figure 2: Distribution of Features
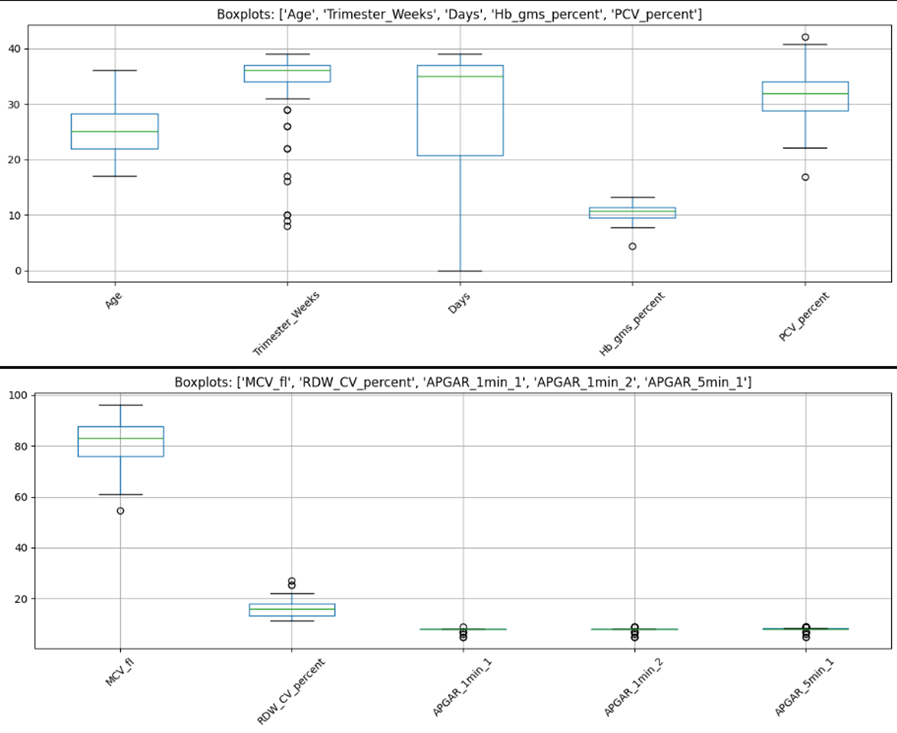
Figure 3: Box Plots (Age, Trimester, Weeks, Days, Hb, PCV)
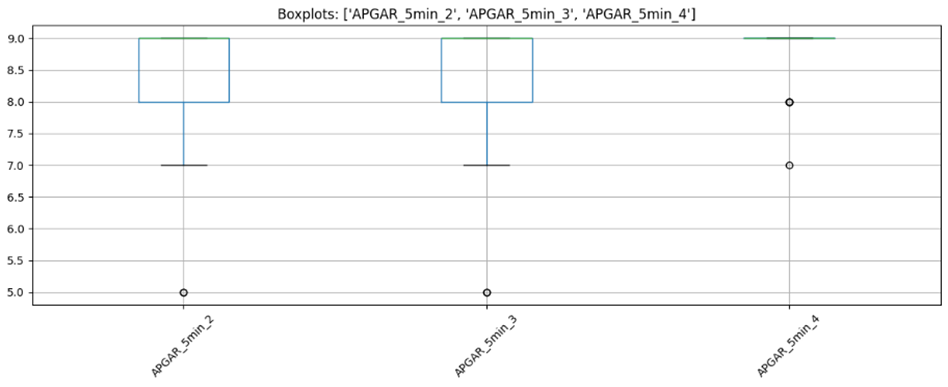
Figure 4: Box Plots (APGAR 5 MIN;2,3,4)
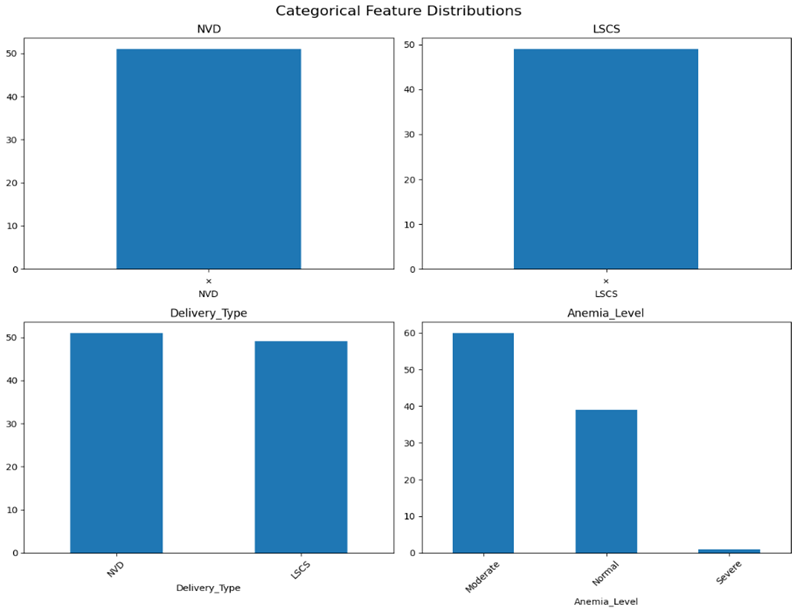
Figure 5: Categorical Feature Distributions
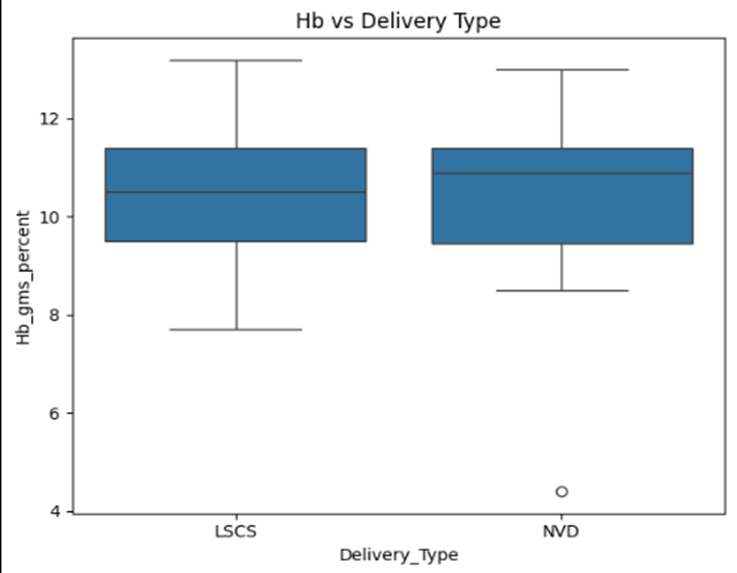
Figure 6: Hb vs Delivery Type
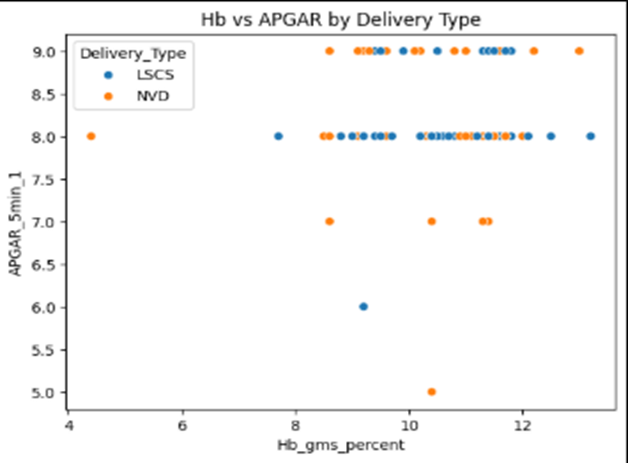
Figure 7: Hb vs APGAR by Delivery Type
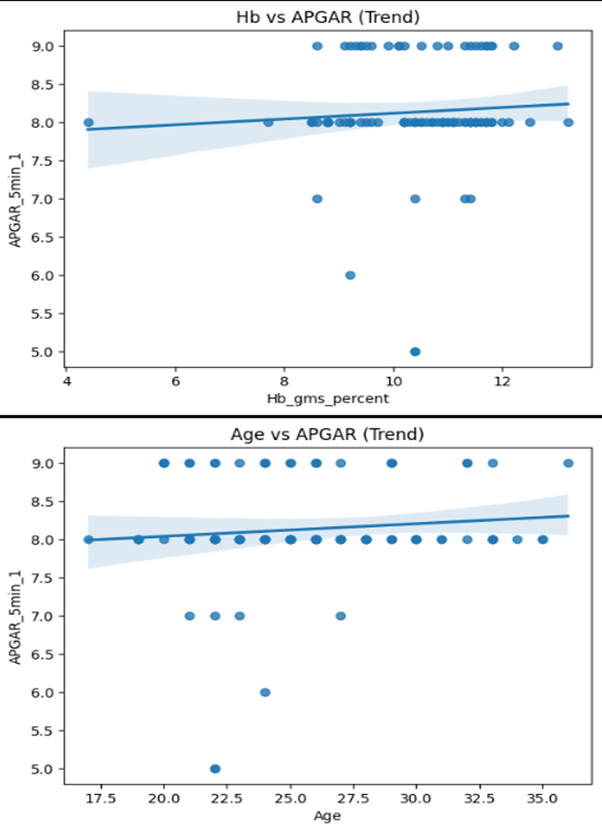
Figure 8: Hb vs APGAR (Trend)
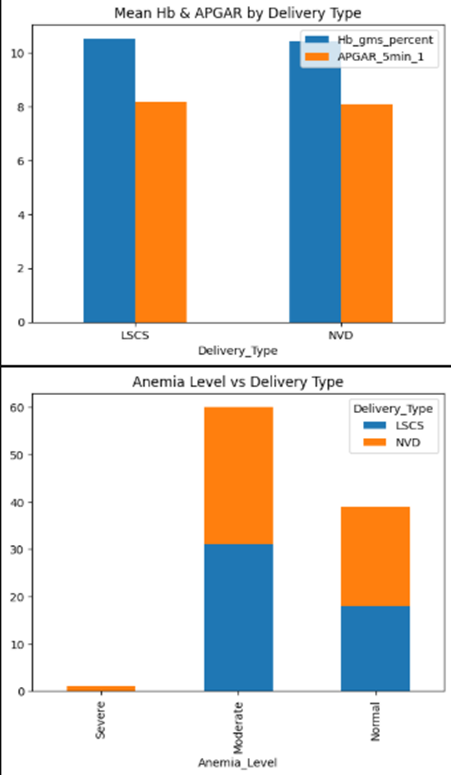
Figure 9: Mean Hb and APGAR by Delivery Type
Table 1: Hypothesis Testing Result
|
Test |
Variables |
Statistic |
P-value |
Significance (α = 0.05) |
Interpretation |
|
T-Test |
Hb vs Delivery Type |
-0.426 |
0.671 |
❌ Not Significant |
No difference in Hb between LSCS and NVD |
|
ANOVA |
Hb across anaemia Levels |
116.41 |
1.67E-26 |
✅ Significant |
Expected (Hb defines anaemia levels) |
|
Chi-Square |
anaemia vs Delivery Type |
1.258 |
0.533 |
❌ Not Significant |
No association between anaemia and delivery type |
|
Pearson Correlation |
Hb vs APGAR |
0.069 |
0.495 |
❌ Not Significant |
No linear relationship |
|
Spearman Correlation |
Hb vs APGAR |
0.072 |
0.478 |
❌ Not Significant |
No monotonic relationship |
|
Pearson Correlation |
Age vs APGAR |
0.099 |
0.326 |
❌ Not Significant |
Age does not impact APGAR |
Table 2: Delivery Type Comparison
|
Metric |
LSCS |
NVD |
Insight |
|
Avg Hb (g/dL) |
10.52 |
10.41 |
Nearly identical |
|
Avg APGAR (5 min) |
8.18 |
8.08 |
No meaningful difference |
Table 3: Anaemia Vs Delivery Distribution
|
Anaemia Level |
LSCS |
NVD |
Insight |
|
Severe |
0 |
1 |
Too few cases to conclude |
|
Moderate |
31 |
29 |
Balanced distribution |
|
Normal |
18 |
21 |
Balanced distribution |
DISCUSSION:
The Physiological changes of pregnancy are focussed on foetal well-being sometimes even compromising maternal health factors the physiologic alterations in the cardiovascular system function to support foetal growth and metabolism, increase uterine perfusion and prepare the parturient for blood loss during delivery.[1] An increase in plasma volume to red cell ratio causes the haemodilution anaemia of pregnancy. Both intra and extravascular fluid volumes. Increase in pregnancy contributing significantly to the average of 12.5Kg weight gain in pregnancy. The rise in plasma volume is likely achieved by a decreased osmotic threshold for thirst and alterations in Arginine vasopressin metabolism.[2] Increased red cell production is stimulated by a rise in Erythropoietin by second month of gestation.[3] Plasma volume increases by 55 percent from 40 to 70 ml/kg and red cell volume increases only by 17% from 25 to 30 ml per kg bodyweight that results in physiologic anaemia of pregnancy. When haemoglobin levals falls below 11.6g% it is called anaemia of pregnancy. Preparation for blood loss during parturition which ranges from 500 to 1000 ml is made by the increase in blood volume that occurs in pregnancy.
The centres for Disease control and Prevention CDC (1998) defined anaemia in Iron supplemented pregnant women using a cutoff of the 5th percentile,11g% in the first and third trimesters and 10.5g/dl in the second trimester.[4]
Bresani 2013 are conducting an ongoing study regarding use of serum ferritin levels to predict responsiveness to iron therapy. Most studies of anaemia during pregnancy especially by Klebanoff (1991) found a slightly increased risk of preterm birth with mid trimester anaemia. Ren and colleagues (2007) found that first trimester anaemia increased the risk of low birth weight, Preterm births and small for gestational age infants. Tanzanio, Kidanto and coworkers reported that the incidence of preterm delivery and low birth weight was increased with the severity of anaemia.
Kumar et.al studied 1000 Indian women confirmed the same findings that second and third trimester anaemia was associated with preterm and low birth weight infants. Children born to iron deficient women were followed up by Chang and associates (2013) those without iron supplementation had lower mental development. This suggests that prenatal iron deficiency is associated with mental development. The two most common causes of anaemia during pregnancy and puerperium are iron deficiency and acute blood loss. Vandevijvere (2013) found 21 percent of women with third trimester anaemia of which 16% was iron deficiency anaemia
Additional iron is needed in third trimester to be diverted to the foetus. As the amount of iron diverted to foetus is the same in normal and iron deficient mother the newborn infant of a severely anaemic mother does not suffer from iron deficiency anaemia.
Morphological classification of Anaemias
Red cell indices are helpful in morphological classification of anaemia. They are derived from values of red cell count, haemoglobin concentration and packed cell volume. Electronic haematology cell analysers more reliably perform tests better than manual methods.
The normal ranges of red cell indices are:
MCV=80-100 FL
MCH=27-32 pg.
MCHC=32-36 g/dl
Mean corpuscular volume represents the average volume of a single red cell. It is expressed in femtolitres or FL
(1 FL=10¹⁵litres).
MCV=PCV % / Red cell count in million/mm³ ×10.
Anaemias are classified Normocytic, micro or macrocytic depending on MCV.
MCV measures average cell volume, it may be normal even though there is a marked variation in size of red cells. (anisocytosis). The degree of variation in size of red blood cells as red cell distribution width (RDW).[5]
Mean Corpuscular Haemoglobin (MCH) is the average amount of haemoglobin in each red cell.
It is expressed in picograms 1pg=10⁻¹² gram
MCH = Hb ÷RBC Count × 10
Low MCH IS found in Microcytic hypochromic anaemia
Mean Corpuscular Haemoglobin Concentration (MCHC)
represents the average concentration of haemoglobin in a given volume of packed cells.
MCHC= Hb ÷PCV (%) × 10
Low MCHC occurs in microcytic hypochromic anaemia.
Red Cell Distribution Width
RDW is the degree of variation of red cell size and may be helpful in distinguishing iron deficiency anaemia from thalassemia minor, Low MCV is seen in both types of anaemia namely Thalassemia minor and iron deficiency anaemia, whereas red cell width distribution is high in iron deficiency anaemia and normal in thalassemia minor.
Table 4: Differential diagnosis of anaemia based on MCV and RDW
|
MCV |
RDW |
Causes |
|
Low |
Normal |
Thalassemia carrier, anemia of chronic disease |
|
Low |
High |
Iron deficiency anemia, hemoglobin H disease, sickle-cell-β thalassemia |
|
High |
Normal |
Myelodysplastic syndrome, aplastic anemia |
|
High |
High |
Megaloblastic anemia, immune hemolytic anemia |
|
Normal |
Normal |
Anemia of chronic disease, sickle cell trait, hereditary spherocytosis |
|
Normal |
High |
Early iron deficiency or megaloblastic anemia, sideroblastic anemia, myelofibrosis, sickle cell anemia |
Similarly, to differentiate megaloblastic anemia from myelodysplastic anemia, both of which have macrocytosis with high MCV, megaloblastic anemia has high RDW and normal values of RDW in myelodysplastic syndrome.
Table 5: Laboratory Biomarkers for Differential Diagnosis of Iron Deficiency
|
Parameter |
Iron Deficiency |
Anaemia of Inflammation |
|
Ferritin (µg/L) |
Low (<15–30) |
Normal to high (>100) |
|
Serum iron (µmol/L) |
Low |
Low |
|
Transferrin saturation (%) |
Low (<10) |
Low (<20) |
|
MCV (fL) |
Low (<80) |
Low to normal |
|
RDW |
High |
Normal |
|
% HYPO |
High (>6%) |
High |
|
CHr |
Low |
Low |
|
sTfR |
High |
Low to normal |
|
sTfR/log ferritin |
>2 |
<1 |
|
Hepcidin |
Very low |
Normal to high |
|
Zn-PP (µmol/mol heme) |
High (>80) |
Normal to high |
The red cell indices are mainly helpful in detecting mild or early red cell abnormalities. In severe anemia, peripheral blood smear is sufficiently characteristic and red cell indices do not provide additional information.
Iron deficiency anemia
The commonest cause of anemia worldwide is due to iron deficiency. It is a state of low total body content of iron, due to depletion of body iron stores, reduced circulating level of iron, or when insufficient iron is available for erythropoiesis thus situations with reduced intake, reduced absorption and increased demand contribute to iron deficiency anemia.
Iron is important for multiple cell functions including oxygen delivery, DNA Replication, repair metabolism and energy production. Total body iron is 50mg/kg body weight in males,40mg/kg body weight in females. Hemoglobin iron is 65% and storage iron as ferritin or hemosiderin is 30%, transport iron namely transferrin bound to iron is 1% and tissue iron as myoglobin and enzymes is 4%.
Transferrin
Is a bilobed glycoprotein of hepatic origin abundant in plasma(204-360mg/dl) that binds iron within a single monoferric or both lobes, diferric transferrin. Transferrin carries only 3-4 mg iron but has a fast turnover.[6]
Free iron is always bound to proteins due to its propensity to generate reactive oxygen species and become toxic.
In order to produce 200 billion erythrocytes daily, erythroid precursors need 20-25 mg of iron mainly supplied by macrophage recycling since dietary iron absorption is limited to 1-2 mg Diferric transferrin binds with high affinity the iron importer transferrin receptor in all the cells.
The ligand receptor complex is internalized via clarithrin coated pits to form endosome. Released by pH, iron is exported to cytosol by divalent metal transporter (DMT1) and mainly used for Heme and iron-Sulphur cluster biosynthesis in mitochondria.Apo transferrin and transferrin receptors are recycled to cell surface and reutilized.
Excess iron is sequestered by cytosolic ferritin a large hollow shell formed by 24 heavy and light subunits of variable combination that stores iron into its central cavity. This process is efficiently done in spleen macrophages.
Ferritin is secreted into blood and serves as marker for storage of iron.
Erythroblasts express the highest number of transferrin receptors. (3 to 4 lakhs/cell) and take up iron only from from transferrin. Liver, pancreas and heart- not erythroblasts can take up non transferrin bound iron which appears in the circulation when Transferring saturation exceeds 60%.
Cell desquamation and menstrual loss in females balance physiologically the amount of iron absorbed daily.
Regulation of Iron Homeostasis
Systemic iron homeostasis is regulated by hepcidin, A 25 amino acid peptide mainly produced by hepatocytes.
Hepcidin acts by
· Blocking iron exports
· Degrading iron exporter Ferroportin
· Inhibits iron exporter Ferroportin
· Inhibits plasma iron flux from duodenal Enterocytes.
· Inhibits plasma iron flux from macrophages and iron storing hepatocytes.
High hepcidin levels decrease and low hepcidin levels increase Iron delivery to plasma. epcidin is increased by high plasma and liver iron as well as inflammatory cytokines.
Hepcidin is inhibited in iron deficiency by hepatic transmembrane serineprotease and erythroferrone, a hormone secreted by erythroblasts following hemorrhage and hypoxia. Testosterone and platelet derived growth factors also inhibit hepcidin.
Iron regulatory proteins control synthesis of transferrin receptor, Ferritin and ferroprotein. They tune erythropoiesis by regulating hypoxia inducible factor 2x, erythropoietin and 5-aminolevulinate synthase-2 the first enzyme of heme bio synthesis.
Table 6: Daily Iron Requirements (mg/day) According to Age and Gender
|
Gender |
Requirement (mg/day) |
|
Children |
0.5–1.0 |
|
Adolescents |
1.2–1.5 |
|
Adult males |
1.0 |
|
Females (fertile age) |
1.20–1.50 |
|
Pregnancy second trimester |
2.8–3.0 |
|
Pregnancy third trimester |
4.0–5.0 |
|
Breastfeeding |
1.0–1.5 |
|
Females (postmenopausal) |
1.0 |
Table 7: Proteins Involved in Iron Absorption
|
Divalent Metal Transporter 1 (DMT1) |
|
Ferroportin 1 |
|
Hepcidin |
|
Hephaestin |
Absorption of Iron
Dietary iron content is closely related to calorie intake about 6-7mg elemental iron for every 1000 calories. Iron absorption occurs mostly in duodenum and upper jejunum. Absorption is usually in ferrous form. Meat contains heme iron about one fourth of which is directly absorbed by the intestinal epithelial cells. After cellular uptake heme is broken down and Iron is released into cytoplasm. Green vegetables contain inorganic iron and only 1 to 2% of which is absorbed. Absorption of inorganic iron is affected by tannates, Phytates and phosphates in the diet and drugs such as antacids and proton pump inhibitors. Ascorbate and amino acids facilitate absorption.
Milk, milk products contain different forms of calcium and phosphates, tea has manganese and green vegetables have phytates and tannins-all of these in excess could inhibit absorption.[7]
Iron absorption occurs in epithelial cells, lining the Villi close to gastroduodenal junction. Low pH of gastroduodenal contents facilitates dissolution of ingested iron.
Ferric is converted to ferrous form by an enzyme ferric reductase also called duodenal Cytochrome- b O2 DCYTB located in the brush border of epithelial cells. Iron is transported from apical cell surface into the cell by divalent metal transporter (DMT1). Inside the cell iron is stored as ferritin or transported to plasma and released from the cell through ferroprotein 1 at the basolateral surface in the ferrous state. Ferroprotein 1 is the cellular exporter of iron. In plasma iron is converted back to ferric state by copper containing enzyme. Hephaestin located is the basal border of enterocyte or by circulating ceruloplasmin. This fe3+ combines plasma transferrin and transported to various body tissues.
Clinical Applications
Understanding absorption of iron by epithelial cells explains the epithelial abnormalities in iron deficiency anemia manifested as nail changes, alopecia angular stomatitis, glossitis and so on. Chronic diarrheal diseases lead to loss of brush border of enterocytes and affect iron stores leading to iron deficiency anemia. Interaction with concurrent excessive specific food intake or nutritional supplement could prevent or reduce iron absorption leading to iron deficiency anemia.
While discussing regulation of iron homeostasis, the focus is on 3 areas:
1. Intestinal Iron Absorption
2. Macrophage iron recycling and
3. Iron utilization
Macrophage Iron Recycling
Specialized liver and spleen macrophages of the reticuloendothelial system remove senescent erythrocytes 0.8-1% daily and recycle to plasma the iron recovered from heme. The high macrophage flux of 20-25mg daily maintains steady state iron supply to erythropoiesis.
High hepcidin levels in inflammation lead to decreased iron recycling and leads to anemia. In intravascular hemolysis, hepatocytes and macrophages recover iron from hemoglobin-haptoglobin and heme-hemopexin complexes.
Iron Utilization
Erythropoiesis utilizes a large amount of iron for heme/Hb production and facilitates its own iron supply by releasing erythroferrone up erythropoietin stimulation.
Causes of Absolute Iron Deficiency with or Without Anemia
• Increased Iron needs:
• Children, adolescents (growth spurt)
• Pregnancy and breastfeeding
• Treatment with erythropoiesis-stimulating agents
• Inadequate iron intake
• Vegan or vegetarian diet
• Malnutrition, poverty
• Prolonged breast feeding
• Decreased iron absorption
• Gastrectomy, bariatric surgery
• Celiac diseases
• Helicobacter pylori gastritis
• Atrophic/autoimmune gastritis
• Proton pump inhibitors
• Excess consumption of iron absorption inhibitors (e.g.-tea, calcium)
• IRIDA (TMPRSS6 Mutations)
• Chronic blood losses
• Gastrointestinal
• Erosive esophagitis/gastritis
• Peptic ulcer
• Large hiatal hernia
• Antral gastric ectasia (watermelon stomach)
• Benign lesions (e.g. large polyps)
• Meckel's diverticulum
• Angiodysplasias (including Heyde's syndrome with concurrent aortic stenosis and acquired von Willebrand disease)
• Malignancy (especially right colon cancer
• Large hemorrhoids
• Inflammatory bowel diseases
• Parasites (hookworms, others)
• Gynecologic
• Heavy menstrual bleeding'
• Fibroids
• Uterine cancer
• Urinary
• Intravascular hemolysis (e.g., PNH, prosthetic heart valves, march hemoglobinuria)
• Urinary schistosomiasis (Schistosoma haematobium
• Bladder or renal cancer
• Pulmonary
• Pulmonary hemosiderosis
• Severe hemoptysis
• Iatrogenic
• Hemodialysis
• Surgical blood losses
• Excess blood drawn for diagnostic testing
• Drugs inducing or facilitating GI bleeding (aspirin, nonsteroidal anti-inflammatory drugs, corticosteroids antithrombotic drugs)
• Bleeding disorders
• von Willebrand disease, other coagulation defects, platelet disorders
• Hereditary hemorrhagic telangiectasia (Rendu-Osler-Weber disease
• Frequent blood donors
• Self-inflicted in psychiatric disorders (Munchausen's syndrome)
•
Types of Iron Deficiency Anemia
In Iron deficiency anemia, the iron stores are depleted, and iron is insufficient for erythropoiesis. Isolated iron deficiency is characterized by depleted iron stores and normal hemoglobin levels.
Absolute iron deficiency occurs when stores are exhausted, Functional iron deficiency occurs when erythropoiesis is iron restricted, but stores are adequate or increased.
Pathophysiology of Iron Deficiency
Isolated iron deficiency with low or absent iron stores is a common condition induced by rapid growth, inadequate nutrition, and profuse menorrhagia, When iron is still sufficient for erythropoiesis, erythrocytes are normochromic normocytic while ferritin is decreased to less than 15 to 30 micro(u)g/l, with transferrin saturation <15 to 20% iron supply to erythropoiesis is insufficient and erythrocytes become hypochromic and microcytic. Though anemia is the most evident outcome, other organs such as heart, muscles and brain are affected by iron deficiency. Immune response may be blunted because lymphocytes require iron during the metabolic burst that mounts adaptive defense against infectious agents. Absolute and functional iron deficiency coexists as in inflammatory bowel diseases, chronic kidney disease and aging, Erythrocyte stimulating agents cause imbalance between iron demand and supply.
Clinical Presentation
Due to slow progression of the disease and efficient compensatory mechanisms, clinical features may not be evident hemoglobin falls below 8 g% especially in youngsters. Sub optimal metabolic function of myocytes, cardiomyocytes and neurons may lead to fatigue, irritability, poor concentration, restless legs syndrome and reduced exercise capability.
Clinical clues include craving and compulsive ingestion of non-nutritive substances Such as ice, soil or clay, nail fragility and koilonychia, hair loss, cheilitis, atrophic glossitis and dysphagia due to esophageal webs.
Table 8: Laboratory Biomarkers for Differential Diagnosis of Iron Deficiency
|
Parameter |
Iron Deficiency |
Anaemia of Inflammation |
|
Ferritin (µg/L) |
Low (<15–30) |
Normal to high (>100) |
|
Serum iron (µmol/L) |
Low |
Low |
|
Transferrin saturation (%) |
Low (<10) |
Low (<20) |
|
MCV (fL) |
Low (<80) |
Low to normal |
|
RDW |
High |
Normal |
|
% HYPO |
High (>6%) |
High |
|
CHr |
Low |
Low |
|
sTfR |
High |
Low to normal |
|
sTfR/log ferritin |
>2 |
<1 |
|
Hepcidin |
Very low |
Normal to high |
|
Zn-PP (µmol/mol heme) |
High (>80) |
Normal to high |
Serum Ferritin
• Most sensitive and specific test for diagnosis of iron deficiency anemia.
• Serum ferritin decreases even before the appearance of anemia.
• Serum ferritin correlates with body iron stores (1 ug/L serum ferritin ~10 mg storage iron).
• Serum ferritin <12 ug/L is highly specific for diagnosis of iron deficiency anemia.
• Not suitable for diagnosing iron deficiency in patients with concomitant inflammatory, neoplastic, or liver disorder since serum ferritin is an acute phase reactant. Thus, normal serum ferritin does not exclude iron deficiency.
Laboratory Iron Studies:
• Gold standard Iron deficiency is absence of stainable iron in the bone marrow.
• Serum ferritin reflects iron stores; ferritin levels less than 30 microgram/l has 92% sensitivity and 98% specificity.
• Reduced serum Iron.
• Serum Iron to total iron binding capacity ratio is called transferrin saturation measures iron available for erythropoiesis.
• Mean Corpuscular Volume < 80 femtolitres.
• Elevated RDW reflects anisocytosis.
• Soluble transferrin receptor levels increase in iron deficiency.
• Reduced reticulocyte hemoglobin content.
• Serum hepcidin levels are low in undetectable iron deficiency.
• Except serum ferritin and transferrin saturation other tests lack standardization
• Severe iron deficiency is accompanied by thrombocytosis due to prevalent megakaryocyte commitment of the common erythroid platelet progenitor in the presence of insufficient iron.
•
Table 9: Iron Preparations for Replacement Therapy Oral Compounds
|
Preparation |
Elemental Iron Content (mg) |
Dosage |
|
Iron sulfate |
65–105 |
65–100 mg 1–2 times/day or 65-100mg on alternate day |
|
Iron gluconate |
27–38 |
1–2 doses/day |
|
Iron fumarate |
29–105 |
1–2 doses/day |
|
Sucrosomial iron |
30 |
30 mg/day |
|
Polysaccharide iron complex (tablet or elixir) |
50–200 15/mL 125/mL |
50–200 mg/day |
|
Ferric maltol |
30 |
30 mg twice/day |
|
Ferric citrate |
45–210 |
3 doses/day (CKD patients with hyperphosphatemia) |
Table 10: Intravenous Compounds
|
Preparation |
Iron Content (mg/mL) |
Maximum Single Dose |
|
Iron sucrose |
20 |
200–300 |
|
Iron gluconate |
12.5 |
125, (slow infusion) |
|
Low-molecular-weight dextran |
50 |
1000, over 1 hr. |
|
Iron carboxymaltose |
50 |
750–1000, over 15 minutes infusion |
|
Iron derisomaltose |
100 |
Up to 20/kg (rapid infusion) |
|
Ferumoxytol |
30 |
510, (rapid infusion) |
Treatment of for Deficiency Anemia
1. Detect the cause and treat the cause.
2. Oral iron therapy as ferrous sulphate 200mg has 60mg of elemental iron.
Dose: 1 Tablet thrice daily
3. Following initiation of therapy reticulocytosis develops within 3 to 7 days and peaks to 8-10% between 8th and 10th day. This is followed by a gradual rise in hemoglobin.
4. Hb should rise by 1g/dl or packed cell volume by 3% in 4weeks, reticulocyte hemoglobin content begins to rise before reticulocyte count and hemoglobin concentration. About 6 to 8 weeks is the period needed to restore hemoglobin levels. 4-6 months are needed to replace blood iron stores.[8] Gastrointestinal intolerance and patient compliance are the major drawbacks of oral iron therapy.
5. Parenteral iron therapy is indicated in poor response to oral therapy, moderate to severe anemia of pregnancy and iron malabsorption.
6. Iron preparations may be single dose multidose formulations. Iron Dextran, ferrumoxytol, ferric carboxymaltose, and Iron maltoside are single dose formulation.
7. Iron salts given in multiple doses are ferrous gluconate and iron sucrose. The relaboration of preparations are mentioned in the table.
8. The amount of iron needed by the patient is derived from the formula bodyweight x 2.3 x Hemoglobin deficit +500 mg
9. Iron requirements vary with the trimesters of pregnancy. Severe anemia of less than 7 grams and moderate anemia of 9 to 7 grams hemoglobin in pregnancy needing operative delivery or presence of comorbidities need blood transfusion.
10. Packed cells transfusion increase hemoglobin by 1g per unit transfused fresh frozen plasma may be needed in liver dysfunction, multiple transfusion with packed cells and deranged coagulation profiles
Newer parameters for early detection of functional iron deficiency or iron restricted erythropoiesis:[9]
1. ½ HYPO or percentage of hyperchromic red cells-normal<6%
2. Low hemoglobin Density or LHD is calculated by mathematical transformation of MCHC. It is useful in identification of reduced iron availability.
3. Reticulocyte hemoglobin content (Chr) falls during iron deficient erythropoietic stage even when clinical features of anemia are not evident. Thus, it is an early Indicator of iron deficiency.
CONCLUSION:
Anemia is a global health problem and pregnancy anemia could affect society. If uncorrected it could persist as chronic anemia in the lady challenging her important events in her future life such as work efficiency, cardiorespiratory functional reserves, facing next pregnancy or a surgery and tendency for co morbid illnesses of advancing age.
In this study of 100 women,60 percent were found under the category of moderate anemia of hemoglobin 7 to 9 g% and treatment by Blood transfusion and parenteral iron was equally distributed. No significant correlation between the mode of anemia management was noted with mode of delivery or of fetal APGAR. Whatever may be the severity of anemia fetal wellbeing at birth was maintained. severe anemia of first trimester and early second trimester was associated with mild IUGR The anemia of menorrhagia at the time of menarche is often unevident clinically and untreated. These progressed to first trimester severe anemia.
Lack of early clinical manifestations of anemia and study of morbidity and mortality of acute on chronic anemia especially in clinical situations of increased demand such as sepsis, pregnancy and trauma-have led to innovate and research on tests that offer early detection of anemia.
Serum ferritin, transferrin saturation and reticulocyte hemoglobin content appear to be promising for early detection of iron deficiency anemia.
American and Indian societies have recommended initiation of oral iron therapy in school going girls from the time of menarche after confirming by screening tests. In order to track and follow up anemic women color coding has been recommended, pink for normal Hb, orange for mild, yellow for moderate and white for severe anemia.[10]
Thus, we infer that antenatal anemia should be viewed seriously and benefits of aggressive management of moderate to severe anemia would persist and progress throughout the life of the woman.
REFERENCES:
1. Bucklin BA, Fuller AJ. Physiologic changes in pregnancy. Chap- 1. In: Suresh M. ed. Shnider and Levinson’s anesthesia for obstetrics. 5th edn. Wolters Kluwer/Lippincott Williams and Wilkins 2013:1-10.
2. Pritchard JA. Changes in the blood volume during pregnancy and delivery. Anesthesiology 1965;26(4):393-9.
3. Cotes PM, Canning CE, Lind T. Changes in serum immunoreactive erythropoietin during menstrual cycle and normal pregnancy. Br J Obstet Gynaecol 1983;90(4):304-11.
4. Cunningham FG, Leveno KJ, Bloom ST, et al Hematological disorders. Chap- 56. Williams obstetrics. 24th edn. McGraw Hill 2014:1101-21.
5. Kauethalkar SM. Approach to diagnosis of Anemias. Sec. 2. Essentials of hematology. 3rd edn Jaypee Brothers 2023:61-80.
6. Camaschella C, Girelli D. Iron deficiency and other Acquired Anemias. Chap- 102. In: Longo DL, Fauci AS, Kasper DL, et al. Harrison's principles of internal medicine. 22nd edn. McGraw Hill 2025:762-6.
7. Samuel TM, Thomas T, Finkelstein J, et al. Correlates of anaemia in pregnant urban South Indian women: a possible role of dietary intake of nutrients that inhibit iron absorption. Public health nutrition. 2013;16(2):316-24.
8. Umbriet J. Iron deficiency - a concise review Am J Hemat 2005;78:225-31.
9. Kauethalkar SM. Essential of hematology. Chap- 3, 3rd edn. New Delhi / London: Jaypee Brothers Medical Publishers 2023: p. 88.
10. Standard Operating Procedures – Prevention and Management of Anemia in pregnant women coming to hospitals, maternity homes and primary health facilities. Maternal Health Section, Directorate of Family Welfare SOP/DFW/MH-1 / Anemia in pregnancy/ Version – 1, 2024 / Updated 2025