STUDY OF ROLE OF INSULIN RESISTANCE AND BETA CELL FUNCTION IN DEVELOPMENT OF PREDIABETES AND TYPE 2 DIABETES USING HOMEOSTATIC MODEL ASSESSMENT (HOMA).
- Mangi Lal , MD Medicine, Senior Resident, Government Medical College Hanumangarh.
- Prashant Ranwa , MD Medicine, Senior Resident, Government Medical College Chittorgarh Rajasthan.
- Sunil Kumar Beniwal , MD Medicine Assistant Professor, Department of General Medicine Government Medical College Hanumangarh.
- Swati Srivastava , Senior Proffessor SMS Medical College Jaipur.
Article Information:
Abstract:
Background: Type 2 diabetes (T2DM) in youth is a serious public health problem that has exhibited an epidemic growth in recent decades. It is a chronic condition in which blood glucose (sugar) can no longer be regulated. AIM: To assess insulin resistance and beta cell function status in patients with prediabetes and type 2 diabetes mellitus. METHODOLOGY: This was a hospital-based observational study conducted in the Department of General Medicine at SMS Medical College and its attached group of hospitals in Jaipur. RESULT: Significant differences were observed between prediabetic and diabetic patients in fasting blood sugar, HbA1c, lipid profile, BMI, waist-hip ratio, and several HOMA parameters, reflecting increased insulin resistance and β-cell dysfunction in diabetes. Fasting C-peptide showed strong positive correlation with all HOMA indices in both groups, while thyroid profile parameters showed no significant difference between the groups. CONCLUSION: The study demonstrated significant alterations in glycemic status, lipid profile, anthropometric indices, and HOMA parameters between prediabetic and type 2 diabetic patients, indicating progressive insulin resistance and β-cell dysfunction with advancement of disease. Fasting C-peptide showed strong correlation with HOMA indices and served as a useful marker for assessing insulin resistance and β-cell function in both prediabetes and diabetes.
Keywords:
Article :
INTRODUCTION:
Type 2 diabetes (T2DM) in youth is a serious public health problem that has exhibited an epidemic growth in recent decades1,2. It is a chronic condition in which blood glucose (sugar) can no longer be regulated.Type 2 diabetes (formerly called non-insulin-dependent or adult-onset) results from the body’s ineffective use of insulin. This type of diabetes is largely the result of excess body weight and physical inactivity. However beta cell dysfunction is also implicated in pathophysiology. Currently, at least 463 million people suffer from type 2 diabetes, but by the year 2045, 700 million people are projected to have the disease.3 Since 2000, the International Diabetes Federation (IDF) has reported the national, regional and global occurrence of diabetes4.
In 2009 it was estimated that 285 million people had diabetes (T1DM and T2DM combined), increasing to 366 million in 2011, 382 million in 2013, 415 million in 2015 and 425 million in 2017.In 2019 approximately 463 million adults (20-79 years) were living with diabetes; by 2045 this will rise to 700 million. The proportion of people with type 2 diabetes is increasing in most countries. 79% of adults with diabetes were living in low and middle-income countries. 1 in 5 of the people who are above 65 years old have diabetes. 1 in 2 (232 million) people with diabetes were undiagnosed5. Diabetes caused 4.2 million deaths. 74 million people are at increased risk of developing type 2 diabetes.India has had the maximum increase during the last few years6. Prevalence of diabetes increased in both rural and urban India from 2.4% and 3.3% in 1972 to 15.0% and 19.0% respectively in 2015-2019.
The prevalence of impaired glucose tolerance is also high in the urban population.Beta-cell dysfunction and insulin resistance are the two major pathophysiological mechanisms7,8 . Early beta-cell dysfunction is characterized by impairment in the first phase of insulin secretion following glucose stimulation. As the disease progresses, the second phase of insulin secretion also declines, resulting in fasting hyperglycemia (i.e., either impaired fasting glucose [IFG] or frank T2DM). Measurement of insulin resistance and beta cell dysfunction are important for diagnosis of T2DM and can be a potential tool in evaluation, risk stratification and monitoring treatment of DM.Homeostatic model assessment (HOMA) of beta -cell function(beta) and insulin resistance (IR) was first described in 19859. The technique is a method for assessing beta -cell function and IR from basal glucose and insulin or C-peptide concentrations. Some studies have also suggested that HOMA-IR values are increased in non-alcoholic fatty liver disease10. This study was carried out to assess the role of insulin resistance and beta cell function in development of prediabetes and type 2 diabetes using homeostatic model assessment (homa).11
AIM
To assess insulin resistance and beta cell function status in patients with prediabetes and type 2 diabetes mellitus.
METHODOLOGY :
This was a hospital-based observational study conducted in the Department of General Medicine at SMS Medical College and its attached group of hospitals in Jaipur. The study duration was one year or until the required sample size was achieved, followed by an additional two months for data analysis. A total of 60 patients were included in the study, with 30 participants in each group.
The study population was divided into two groups. Group A included patients with prediabetes. The inclusion criteria for this group were patients aged 18 years or more who were willing to provide written informed consent. Patients suffering from chronic illnesses, chronic liver disease and/or renal disease, and pregnant women were excluded from the study. Group B included patients with type 2 diabetes mellitus who were insulin naïve. The inclusion criteria for this group were individuals aged 18 years or more who were willing to provide written informed consent. Similar to Group A, patients with chronic illnesses, chronic liver disease and/or renal disease, and pregnant women were excluded from the study.
RESULTS
Table 1: Distribution of prediabetes and diabetes patients according to Gender.
|
Gender |
Prediabetes |
Diabetes |
||
|
N |
% |
N |
% |
|
|
Male |
11 |
36.67 |
20 |
66.67 |
|
Female |
19 |
63.33 |
10 |
33.33 |
|
Total |
30 |
100 |
30 |
100 |
There were 11 (36.67%) males and 19 (63.33%) females in prediabetes group. Similarly, in diabetes group there were 20 (66.67%) males and 10 (33.33%) females. Here, a statistically significant difference in gender was found between two group (P-value = 0.0200).
Table 2: Distribution of prediabetes and diabetes patients according to age and gender.
|
Gender |
Prediabetes |
Diabetes |
P-value |
||
|
Mean |
SD |
Mean |
SD |
||
|
Male |
47.45 |
1.75 |
48.70 |
6.28 |
0.5258 |
|
Female |
48.79 |
13.54 |
54.70 |
4.40 |
0.1935 |
|
P-value |
0.7481 |
0.0117 |
|
||
We found that there was no statistically significant difference in mean age of males and females between two groups (P-value>0.05). Within group we found that in pre-diabetes there was no significant difference in mean age of males and females (P-value= 0.7481), but in diabetes there was significant difference in mean age of males and females (P-value = 0.0117).
TABLE 3: Distribution of prediabetes and diabetes patients according to various parameters, HOMA, Thyroid Profile and BMI and WHR
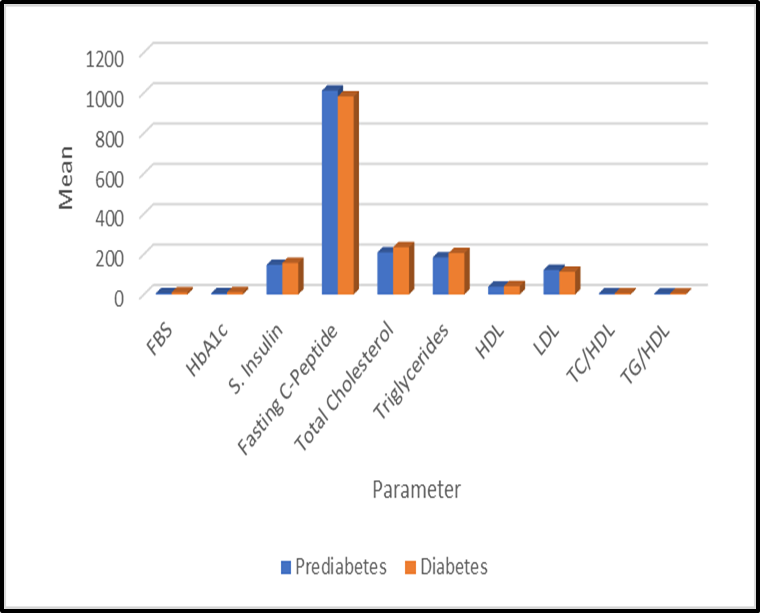
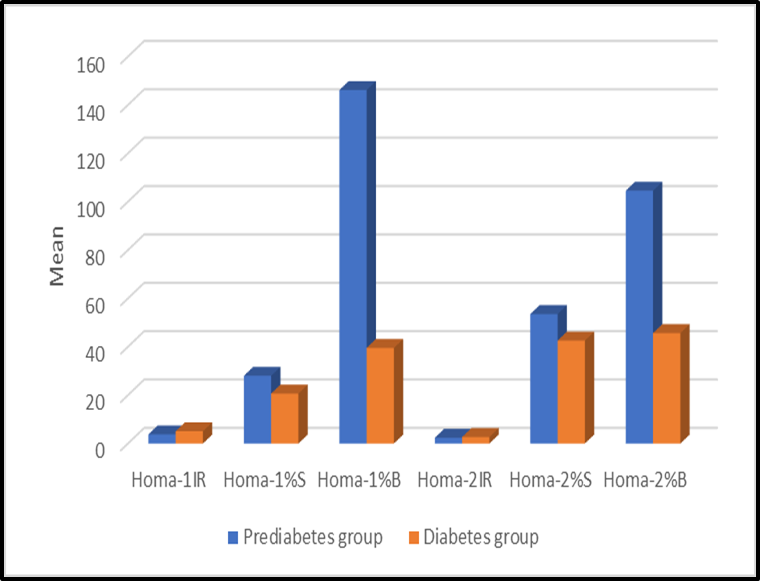
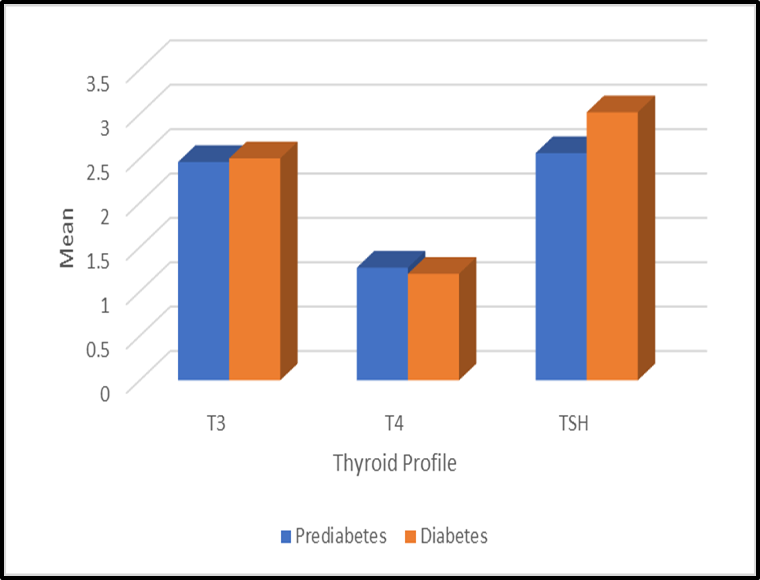
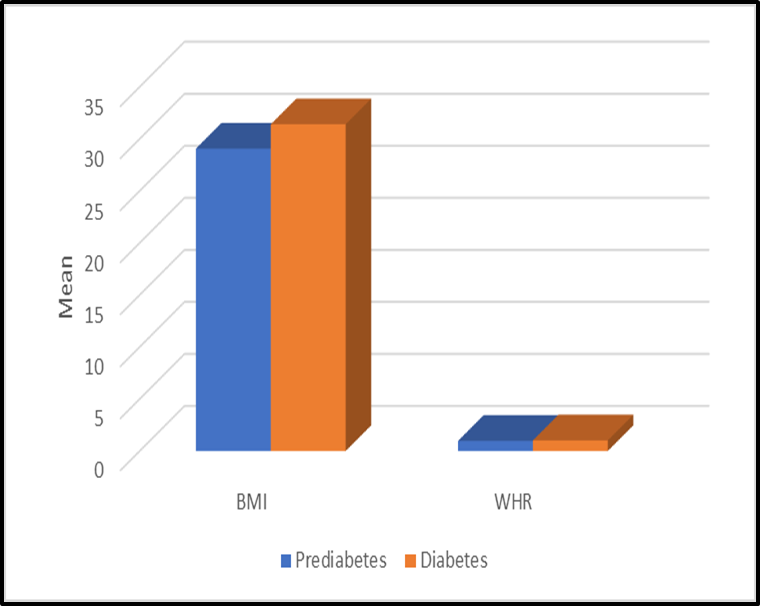
We found that there was a statistically significant difference in fasting blood sugar, HbA1c, total cholesterol, triglycerides, HDL, and LDL levels between prediabetes and diabetes patients. However, serum insulin, fasting C-peptide, TC/HDL ratio, and TG/HDL ratio did not show significant differences between the two groups. Significant differences were also observed in HOMA-1IR, HOMA-1%S, HOMA-1%B, and HOMA-2%B, whereas HOMA-2IR and HOMA-2%S were not statistically significant. Thyroid profile parameters (T3, T4, and TSH) showed no significant difference, while BMI and waist-hip ratio demonstrated statistically significant differences between prediabetes and diabetes patients.
Table 4: Pearson correlation between FCP, insulin and BMI with HOMA parameters in diabetes group
|
Diabetic cases |
Homa-1IR |
Homa-1%S |
Homa-1%B |
Homa-2IR |
Homa-2%S |
Homa-2%B |
|
FCP (nmol) |
0.979 |
-0.974 |
0.959 |
0.991 |
-0.955 |
0.945 |
|
Homa-1IR |
P-value <0.0001 |
P-value <0.0001 |
P-value <0.0001 |
P-value <0.0001 |
P-value <0.0001 |
P-value <0.0001 |
|
S.Insulin |
0.346 |
-0.363 |
0.518 |
0.394 |
-0.381 |
0.567 |
|
Homa-1%B |
P-value 0.581 |
P-value 0.231 |
P-value 0.0091 |
P-value 0.231 |
P-value 0.335 |
P-value 0.0026 |
|
BMI |
0.353 |
-0.373 |
0.406 |
0.367 |
-0.383 |
0.413 |
|
Homa-2%S |
P-value 0.531 |
P-value 0.487 |
P-value 0.026 |
P-value 0.231 |
P-value 0.337 |
P-value 0.020 |
In diabetes group we found that Fasting C-Peptide Fasting C-Peptide is directly correlated with HOMA-1IR, Homa-1%B and Homa-2IR Homa-2%B and inversely proportional to Homa-1%S and Homa-2%S.However serum-Insulin is statistically significant with HOMA-1%B and HOMA-2%B and this correlation is direct correlation.Lastly, BMI is not statistically significant with any of the HOMA parameters.
Table 5 : Pearson correlation between FCP, insulin and BMI with HOMA parameters in prediabetes group
|
Pre-diabetes |
Homa-1IR |
Homa-1%S |
Homa-1%B |
Homa-2IR- |
Homa-2%S |
Homa-2%B |
|
FCP (nmol) |
0.998 |
-0.921 |
0.99 |
1 |
-0.733 |
0.985 |
|
P-value <0.0001 |
P-value <0.0001 |
P-value <0.0001 |
P-value <0.0001 |
P-value <0.0001 |
P-value <0.0001 |
|
|
S.Insulin |
0.538 |
-0.523 |
0.575 |
0.547 |
-0.448 |
0.581 |
|
P-value 0.020 |
P-value 0.023 |
P-value 0.011 |
P-value 0.019 |
P-value 0.0335 |
P-value 0.010 |
|
|
BMI |
0.298 |
-0.241 |
0.257 |
0.285 |
-0.198 |
0.236 |
|
P-value 0.663 |
P-value 0.787 |
P-value 0.726 |
P-value 0.535 |
P-value 0.887 |
P-value 0.797 |
In Prediabetes group we found that Fasting C-Peptide is directly correlated with HOMA-1IR, Homa-1%B and Homa-2IR HOMA-2%B and, inversely proportional to Homa-1%S and Homa-2%S.However serum-Insulin is statistically significant with HOMA parameters and among them serum-Insulin is directly correlated with HOMA-1IR, Homa-1%B and Homa-2IR HOMA-2%B and, inversely proportional to Homa-1%S and Homa-2%S.Lastly, BMI is not statistically significant with any of the HOMA parameters.
Table 6: ROC analysis for HOMA1-IR for predicting diabetes and diabetes cases
|
Area |
0.806 |
0.626 |
|
P-value |
0.0001 |
0.095 |
|
95 confidence intervals |
0.685-0.926 |
0.469-0.782 |
|
Cut-off |
3.9 |
2.7 |
|
Sensitivity |
83.3% |
73.3% |
|
Specificity |
73.3% |
80% |
In our study we found that HOMA1-IR with a cut off value of 3.9 was 83.3% sensitive and 73.3% specific in predicting diabetes. We found that a cut of HOMA1-IR above which diabetes is present.In our study we found that HOMA2-IR with cut off value of 2.7 at 73.3% sensitivity and 80% specificity was a good predictor of insulin resistance in prediabetic patients.
DISCUSSION:
There were 11 (36.67%) males and 19 (63.33%) females in prediabetic group. However in diabetic group there were 20 (66.67%) males and 10 (33.33%) females. we found a statistically significant difference in gender was found between two group (P-value = 0.0200). We also found that there was no statistically significant difference in mean age of males and females between two groups (P-value>0.05). Within group we found that in pre-diabetics there was no significant difference in mean age of males and females (P-value= 0.7481), but in diabetics there was significant difference in mean age of males and females (P-value = 0.117).Liu et al12 found mean age of 70.7 years and 71.4 years of pre-diabetic and diabetic patients respectively.
In our study, statistically significant difference in fasting blood sugar (P-value<0.0001), HbA1c (P-value<0.0001) Total Cholesterol (P-value=0.02), Triglycerides (P-value=0.01), HDL (P-value=0.02) and LDL (P-value=0.02) was found between prediabetes and diabetes patients. However, S. Insulin(P-value=0.7), Fasting C-Peptide(P-value=0.7), TC/HDL(P-value=0.67) and TG/HDL(P-value=0.5) had no significant difference between prediabetes and diabetes patients.In study by Cai et al13 (A) found that there was statistically significant difference mean BMI was 23.4 kg/m2 and 23.7 kg/m2 and WHR was 0.92 and 0.93 respectively of prediabetes and diabetes patients (p-value<0.0001) in case of BMI and WHR both.
We found that there was statistically significant difference in Homa-1IR (p-value<0.0001), Homa-1%S (p-value 0.0001), Homa-1%B (p-value<0.0001), Homa-2%B (p-value<0.0001) between Pre-diabetes and diabetes patients. But Homa-2IR (p-value 0.1), Homa2%S (p-value 0.19) are statistically not significant between Pre-diabetes and diabetes patients. Roehrich et al14 have reported LDL-C above 6 mmol/l to induce apoptosis of beta- cells.
Among Thyroid profile, T3, T4 and TSH does not statistically significant between diabetes and pre-diabetes with p-value 0.23, 0.21 and 0.18 respectively.
BMI and waist hip ratio show statistically significant difference between pre-diabetes and diabetes patients with p-value is 0.03 and 0.01 respectively. In our study we found that FCP is statistically significant correlation with all the HOMA parameters like Homa-1IR (r=0.979; P-value <0.0001), Homa-1%S (r=--0.974; P-value <0.0001), Homa-1%B (r=0.959; P-value <0.0001), Homa-2IR (r=0.991; P-value <0.0001), Homa-2%S (r-0.955; P-value <0.0001) and Homa-2%B (r=0.945; P-value <0.0001) in diabetes patients.
In prediabetes cases FCP statistically significant correlation with all of the HOMA parameters like Homa-1IR (r=0.998; P-value <0.0001), Homa-1%S (r-0.921; P-value <0.0001), Homa-1%B (r=0.99; P-value <0.0001), Homa-2IR (r=1.0; P-value <0.0001), Homa-2%S (r=-0.733; P-value <0.0001) and Homa-2%B (r=0.985; P-value <0.0001). In diabetes cases insulin is statistically significant correlation with all of the HOMA parameters like Homa-1IR (r=0.538; P-value 0.02), Homa-1%S (r=-0.523; P-value 0.023), Homa-1%B (r=0.575; P-value 0.011), Homa-2IR (r=0.547; P-value 0.019), Homa-2%S (r=-0.448; P-value 0.0335) and Homa-2%B (r=0.581; P-value 0.01).
Inulin is not statistically significant correlation in prediabetes with HOMA parameters like Homa-1IR (r=0.346; P-value 0.581), Homa-1%S (r=-0.363; P-value 0.231), Homa-2IR (r=0.394; P-value 0.231), Homa-2%S (r=--0.381; P-value 0.335). But Inulin is statistically significant correlation with Homa-1%B (r=0.518; P-value 0.0091), and Homa-2%B (r=0.567; P-value 0.0026) in prediabetes patients. BMI is not statistically significant correlation with HOMA parameters like Homa-1IR (r=0.353; P-value 0.531), Homa-1%S (r=-0.373; P-value 0.487), Homa-2IR (r=0.367; P-value 0.231), Homa-2%S (r=-0.383; P-value 0.337) in diabetes patients. But significant correlation with Homa parameters like Homa-1%B (r=0.406; P-value 0.026), Homa-2%B (r=0.413; P-value 0.02) in diabetes patients.
In prediabetes cases BMI is not statistically significant correlation with any of the HOMA parameters like Homa-1IR (r=0.298; P-value 0.663), Homa-1%S (r=--0.241; P-value 0.787), Homa-1%B (r=0.257; P-value 0.726), Homa-2IR (r=0.285; P-value 0.535), Homa-2%S (r=--0.198; P-value 0.887) and Homa-2%B (r=0.236; P-value 0.797) in prediabetes patient.
After ROC analysis, we found that HOMA2-IR with a cut -off value of 2.7 at 73.3% sensitivity and 80% specificity was a good predictor of insulin resistance in diabetic patients. Similarly, HOMA1-IR with cut off of 3.9 at 83.3% sensitivity and 73.3% specificity was a good predictor of insulin resistance in diabetic patients. Basukala et al15 found that HOMA2-IR was used as gold standard (>1.8 was taken as positive for insulin resistance).
CONCLUSION:
The present study demonstrated significant differences in demographic, biochemical, anthropometric, and insulin resistance parameters between prediabetic and type 2 diabetic patients. Female predominance was observed in the prediabetic group, whereas males were predominant in the diabetic group, Fasting blood sugar, HbA1c, lipid profile parameters, BMI, and waist-hip ratio showed significant differences between prediabetes and diabetes, indicating worsening metabolic abnormalities with progression to diabetes.
HOMA-1IR, HOMA-1%S, HOMA-1%B, and HOMA-2%B were significantly altered between the two groups, suggesting increased insulin resistance and β-cell dysfunction in diabetic patients. Fasting C-peptide demonstrated strong statistically significant correlations with all HOMA parameters in both groups, indicating its usefulness as a marker of insulin resistance and β-cell function. Serum insulin showed significant correlation with HOMA parameters mainly in diabetic patients, while BMI showed poor correlation with insulin resistance indices, supporting previous findings that BMI alone may not reliably predict insulin resistance. Thyroid profile parameters (T3, T4, and TSH) did not differ significantly between the groups. ROC analysis revealed that HOMA2-IR and HOMA1-IR are useful predictors of insulin resistance in diabetic patients with good sensitivity and specificity.
REFERENCES:
1. https://pubmed.ncbi.nlm.nih.gov/12674166/
2. Kahn SE: The importance of beta-cell failure in the development and progression of type 2 diabetes. J Clin Endocrinol Metab 2001;86:4047–4058.
3. Pratley RE, Weyer C: The role of impaired early insulin secretion in the pathogenesis of type II diabetes mellitus. Diabetologia 2001;44:929–945.
4. DeFronzo RA: The triumvirate: beta-cell, muscle, liver: a collusion responsible for NIDDM. Diabetes 1988;37:667–687.
5. Porte D Jr: b-Cells in type II diabetes mellitus. Diabetes 1991; 40:166–180.
6. Antuna-Puente B, Disse E, Rabasa-Lhoret R, Laville M, Capeau J, et al. (2011) How can we measure insulin sensitivity/resistance? Diabetes Metab 37: 179-188.
7. Saisho Y (2014) Postprandial C-peptide Index: The Best Marker of Beta Cell Function? Int J Diab Clin Diagn.
8. Kim CH, Kim HK, Kim EH, Bae SJ, Choe J, Park JY, et al. Longitudinal changes in insulin resistance, beta-cell function and glucose regulation status in prediabetes. Am J Med Sci 2018;355:54-60.
9. Baynes HW. Classification, pathophysiology, diagnosis, and management of diabetes mellitus. J Diabetes Metab 2015;6:541.
10. Matthews DR, Hosker JP, Rudenski AS, Naylor BA, Treacher DF, Turner RC: Homeostasis model assessment: insulin resistance and beta-cell function from fasting plasma glucose and insulin concentrations in man. Diabetologia 28:412– 419, 1985.
11. Salgado AL, Carvalho Ld, Oliveira AC, Santos VN, Vieira JG, Parise ER. Insulinresistance index (HOMA-IR) in the differentiation of patients with nonalcoholic fatty liver disease and healthy individuals. Arq Gastroenterol. 201AprJun;47 (2):165-9.
12. Wang C, Liu Z, Zhang P, Ma X, Che K, Wang Y. The differences in homeostasis model assessment values in type 2 diabetic patients with different lengths of history of diabetes. Arch Endocrinol Metab(2019);63/3.
13. Cai X, Xia L, Pan Y, He D, Zhu H, Wei T, He Y. Diferential role of insulin resistance and β-cell function in the development of prediabetes and diabetes in middle-aged and elderly Chinese population. Diabetol Metab Syndr (2019);11:24.
14. Goto A, Takaichi M, Kishimoto M, et al. Body mass index, fasting plasma glucose levels, and C-peptide levels as predictors of the future insulin use in Japanese type 2 diabetic patients. Endocr J. 2010;57:237–44.
15. Bhosle D, Sayyed A, Bhagat A, Sheikh H, Londhe V. Homeostasis Model Assessment of Insulin Resistance (HOMA-IR) in the Diagnosis of Insulin Resistance and Prediabetes. JMSCR (2016);4: 2455-0450.