A STUDY TO COMPARE THE HEMODYNAMIC RESPONSE FOLLOWING SPINAL ANESTHESIA BETWEEN CONTROLLED HYPERTENSIVE AND NORMOTENSIVE PATIENTS UNDERGOING SURGERY.
- Palash Kumar , Junior Resident, Department of Anesthesia K.M MEDICAL COLLEGE AND HOSPITAL.
- Neelam Gupta , HOD, MD anesthesiologists, Department of Anesthesia K.M MEDICAL COLLEGE AND HOSPITAL.
- Ashish Gupta , Assistant professor, Department of Anesthesia K.M MEDICAL COLLEGE AND HOSPITAL.
Article Information:
Abstract:
Introduction: Spinal anaesthesia (SA), also known as a subarachnoid block, is a fundamental technique in modern anaesthesiology and is commonly used for surgeries involving the lower abdomen, perineum, and lower extremities. Despite its advantages, its mechanism poses significant challenges. The anaesthetic agents affect both somatic sensory fibres and autonomic sympathetic fibres. Blockade of the thoracolumbar sympathetic outflow (T1–L2) leads to a series of physiological changes, the most important of which is hemodynamic instability, which complicates patient management during SA. Objective: The aim of this study was to assess and compare the changes in blood pressure and heart rate following spinal anaesthesia in patients with controlled hypertension and those with normal blood pressure undergoing surgery. Methodology: A prospective, observational, and comparative study conducted over 18 months at Krishna Mohan Medical College and Hospital, Mathura, Uttar Pradesh. A total of 110 patients were included, with 55 patients in each group (controlled hypertensive and normotensive). The study population consisted of consenting adults aged 20–70 years with a baseline heart rate of 60–100 bpm and ASA physical status Grade I or II. Results: The results showed that both groups were comparable in terms of baseline demographics, age distribution, and block characteristics. However, significant differences were observed in hemodynamic stability and clinical outcomes following spinal anaesthesia. The controlled hypertensive group had a significantly higher proportion of patients classified as ASA Grade II (p < 0.0001). A key finding was the markedly higher incidence of intraoperative hypotension in this group, approximately four times greater than in normotensive patients (21.8% vs. 5.5%). Notably, all hypotensive episodes occurred at 15 minutes after spinal anaesthesia, identifying this as a critical monitoring period. Furthermore, the controlled hypertensive group consistently showed a higher average heart rate during the procedure (p < 0.0001). These hemodynamic differences were associated with worse perioperative outcomes, including longer surgery times, greater intraoperative fluid requirements, and longer hospital stays (all p < 0.0001). While postoperative nausea and vomiting occurred more often in this group, the difference was not statistically significant. Conclusion: Patients with controlled hypertension represent a distinct high-risk group when undergoing spinal anaesthesia. They demonstrate greater hemodynamic variability, particularly an increased susceptibility to early hypotension, and tend to require more intensive perioperative care. These findings emphasise the need for careful monitoring and proactive management strategies in this patient population.
Keywords:
Article :
INTRODUCTION:
Spinal anaesthesia (SA), also known as subarachnoid block, is a commonly employed anaesthetic technique for surgeries involving the lower abdomen, perineum, and lower extremities due to its rapid onset and reliable sensory and motor blockade. [1,2] Its effectiveness is achieved by injecting local anaesthetic agents into the cerebrospinal fluid, thereby interrupting nerve impulse transmission at the spinal root level.[3]
However, this mechanism is non-selective and also affects sympathetic nerve fibres from the thoracolumbar region (T1–L2). This leads to vasodilation, lower systemic vascular resistance, decreased venous return, and a subsequent drop in cardiac output, resulting in hypotension. [4–6] Moreover, unopposed vagal activity can cause bradycardia, further disturbing hemodynamic stability.
While these physiological changes are usually manageable in individuals with normal blood pressure, patients with controlled hypertension face specific challenges. Even with blood pressure under control, they still have underlying vascular issues, such as decreased arterial elasticity and impaired baroreceptor sensitivity, that hinder their ability to adapt to sudden changes in blood flow.
Furthermore, the use of antihypertensive medications may blunt compensatory mechanisms like tachycardia and vasoconstriction, increasing susceptibility to hypotension. Therefore, evaluating and comparing the hemodynamic responses between controlled hypertensive and normotensive patients is essential for improving perioperative management and ensuring patient safety.
MATERIALS AND METHODS:
This prospective, observational, comparative study was carried out over 18 months at Krishna Mohan Medical College and Hospital, Mathura, following ethical approval and informed consent.
A total of 110 patients undergoing elective surgery under spinal anaesthesia were included and divided into two groups: controlled hypertensive (n=55) and normotensive (n=55). Patients aged 20–70 years with heart rates 60–100 bpm and ASA physical status I–II were enrolled. Controlled hypertension was defined as blood pressure <140/90 mmHg on stable treatment.
All patients underwent pre-anaesthetic evaluation and continued their medications until surgery. Standard monitoring was applied. Preloading was done with 500 mL Ringer’s lactate. Spinal anaesthesia was administered at L3–L4/L4–L5 using a 23-G needle with intrathecal levobupivacaine.
Heart rate and blood pressure were recorded at baseline, every 5 minutes for 30 minutes, and then every 10 minutes up to 60 minutes. Hypotension (≥20% fall in SBP) was treated with fluids and vasopressors, while bradycardia (HR <50 bpm) was managed with atropine.
RESULTS:
A total of 110 patients were included, with 55 patients each in the controlled hypertensive (CH) and normotensive (N) groups. Both groups were comparable in baseline demographic characteristics, including age, gender, and anthropometric parameters, with no statistically significant differences (p > 0.05) (Table 1, Table 2, Table 3; Graph 1–3).
However, a significantly higher proportion of patients in the CH group were classified as ASA Grade II compared to the normotensive group (36.4% vs. 5.5%, p < 0.0001) (Table 4; Graph 4).
Spinal block characteristics, including onset time and maximum sensory level, were comparable between the groups. However, the duration of surgery was significantly longer in the CH group (93.45 ± 6.09 min vs. 80.72 ± 11.88 min, p < 0.0001) (Table 5; Graph 5).
Both groups demonstrated a similar trend in systolic and diastolic blood pressure following spinal anaesthesia, with the greatest decline observed at 15 minutes and a gradual recovery thereafter (Table 6; Graphs 6(A, B)).
The CH group consistently showed slightly lower blood pressure values at all time points. The incidence of intraoperative hypotension was significantly higher in the CH group compared to the normotensive group (21.8% vs. 5.5%), representing an approximately fourfold increase. Notably, all hypotensive episodes occurred at 15 minutes post-spinal anaesthesia, identifying this as a critical monitoring period.
Heart rate analysis revealed a significantly higher mean heart rate in the CH group throughout the observation period (p < 0.0001), although the time course of change was similar in both groups (Table 7; Graph 7). The incidence of bradycardia was comparable between groups (7.3% each), with most cases occurring at 15 minutes.
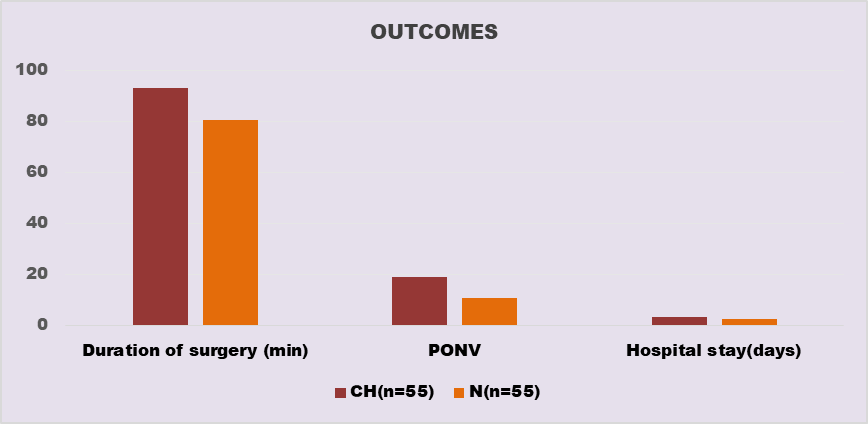
Regarding perioperative outcomes, the CH group required significantly greater intraoperative fluid administration (1209 ± 75.73 ml vs. 1070 ± 89.79 ml, p < 0.0001) and had a longer hospital stay (3.32 ± 0.54 days vs. 2.58 ± 0.77 days, p < 0.0001). Although postoperative nausea and vomiting were more frequent in the CH group (34.5% vs. 20.0%), the difference was not statistically significant (p = 0.099). No 30-day cardiovascular events were observed in either group (Table 8; Graph 8).
Table 1: Showing Age distribution among the patients
|
AGE |
CH(n=55) |
N(n=55) |
P-Value |
|
21-30 |
2 |
5 |
0.12 |
|
31-40 |
5 |
14 |
|
|
41-50 |
20 |
14 |
|
|
51-60 |
22 |
18 |
|
|
61-70 |
6 |
4 |
|
|
Mean |
49.4±9.3 |
48.2±10.4 |
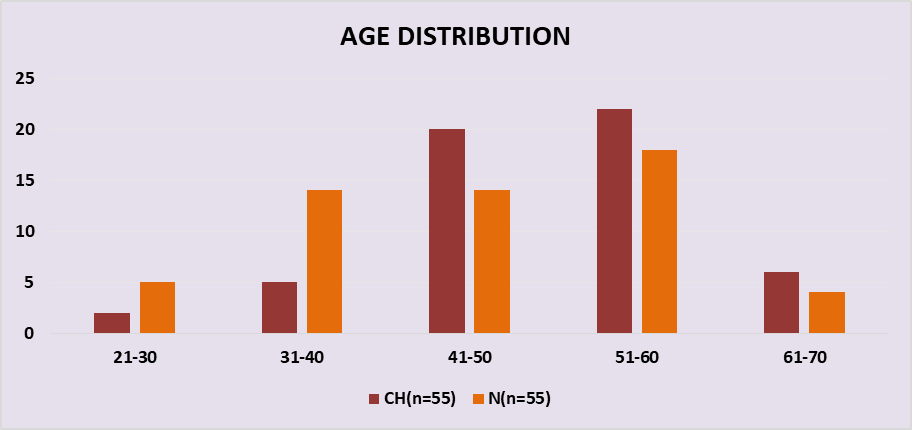
Graph 1: Showing Age distribution among the patients
Table 2: Showing Gender distribution among the patients
|
GENDER |
CH(n=55) |
N(n=55) |
P-Value |
|
Male |
35 |
38 |
0.545 |
|
Female |
20 |
17 |
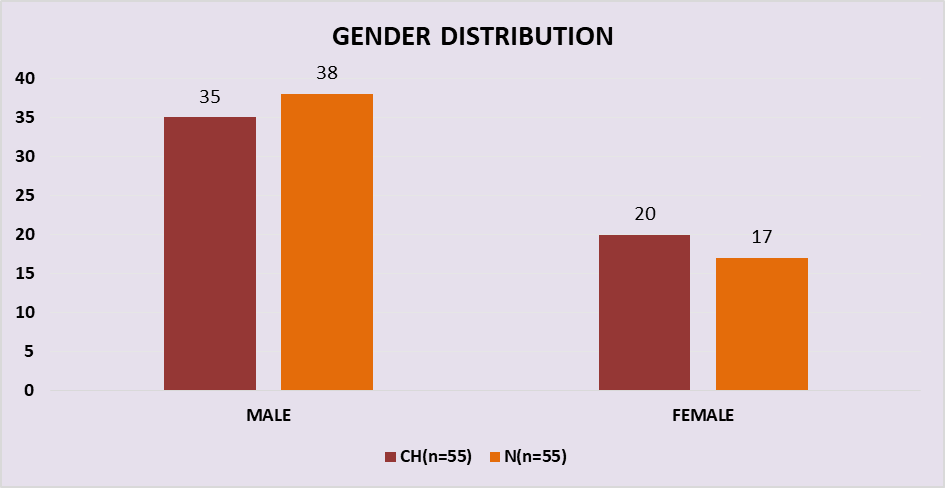
Graph 2: Showing Gender distribution among the patients
Table 3: Showing Mean Weight, Height and BMI distribution among the patients
|
Mean± SD |
CH(n=55) |
N(n=55) |
P-Value |
|
WEIGHT |
63.74±4.9 |
63.78±5.3 |
0.967 |
|
HEIGHT |
163.02±3.18 |
162.86±5.66 |
0.855 |
|
BMI |
23.98±1.81 |
24.08±2.08 |
0.788 |
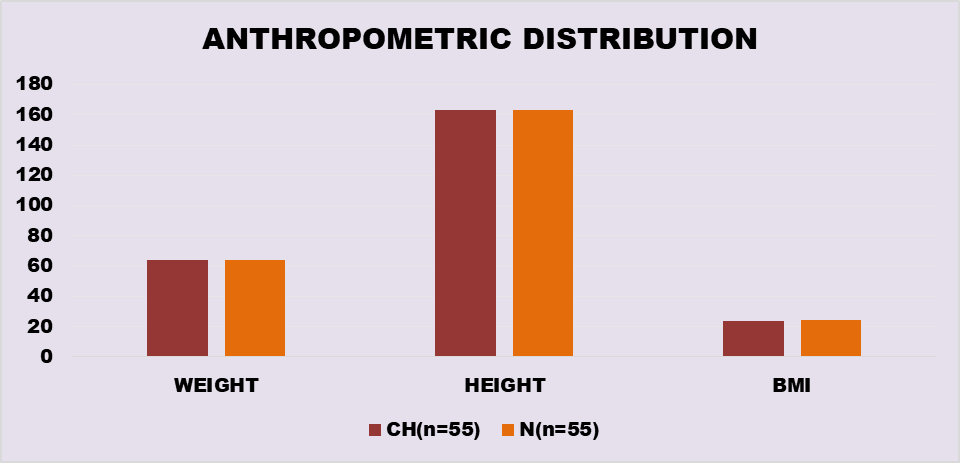
Graph 3: Showing Mean Weight, Height and BMI distribution among the patients
Table 4: Showing ASA grade of the patients
|
ASA GRADE |
CH(n=55) |
N(n=55) |
P-Value |
|
GRADE I |
35 |
52 |
< 0.0001 |
|
GRADEII |
20 |
3 |
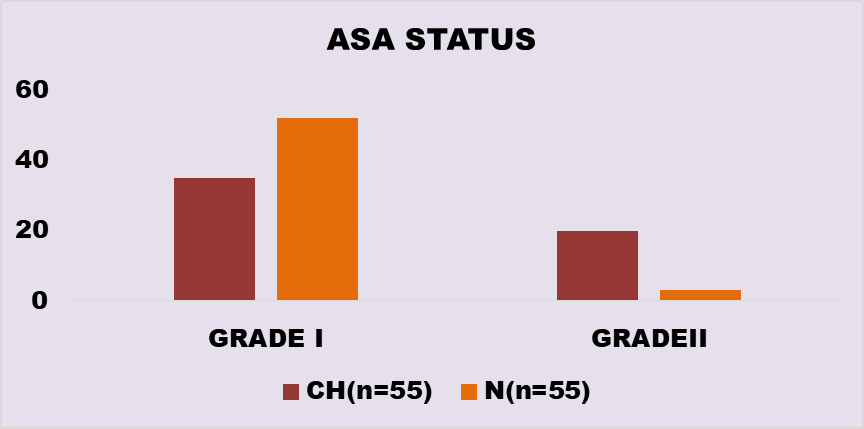
Graph 4: Showing the ASA grade of the patients
Table 5: Showing Distribution of block characteristics among study population:
|
BLOCK CHARACTERISTIC |
CH(n=55) |
N(n=55) |
P-Value |
|
Onset Time (min) |
4.21±0.77 |
4.2±0.79 |
0.947 |
|
Max Sensory Level (T) |
T10 |
T10 |
NA |
|
Duration of surgery (min) |
93.45±6.09 |
80.72±11.88 |
<0.0001 |
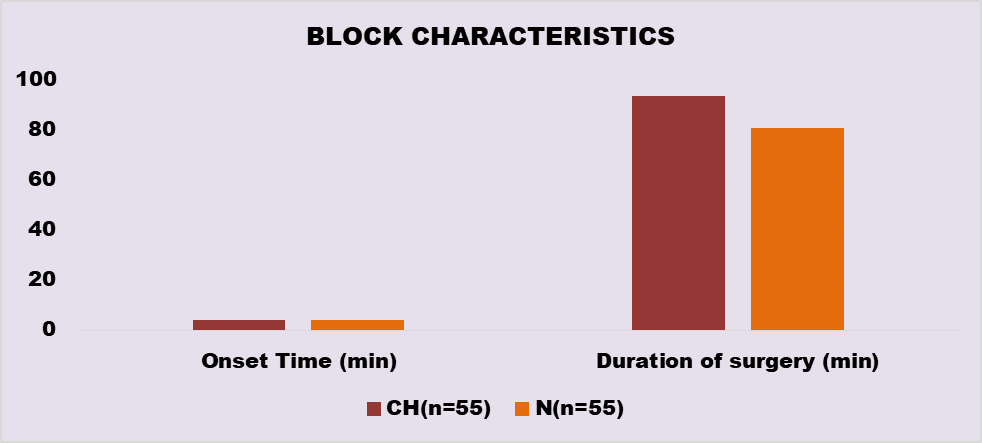
Graph 5 : Showing Distribution of block characteristics among study population:
Table 6: Showing Mean Systolic and Diastolic BP distribution among study population:
|
Time line |
Systolic BP |
Diastolic BP |
||
|
|
CH |
N |
CH |
N |
|
Baseline |
132.1±4.86 |
133.38±5.11 |
80.16±5.04 |
81.85±4.59 |
|
5min |
121.2±3.85 |
124±4.45 |
74.65±4.74 |
76.47±4.48 |
|
10min |
112.9±3.55 |
115.89±4.27 |
70.21±4.40 |
72.25±4.42 |
|
15min |
105.7±3.87 |
109.67±4.31 |
66.25±4.29 |
68.21±4.18 |
|
20min |
109.7±3.84 |
113.52±4.56 |
68.25±4.29 |
70.21±4.18 |
|
25min |
113.7±3.84 |
117.52±4.59 |
70.25±4.29 |
72.14±4.24 |
|
30min |
117.7±3.84 |
121.67±4.54 |
72.25±4.29 |
74.21±4.18 |
|
40min |
121.7±3.84 |
125.45±4.63 |
74.25±4.29 |
76.21±4.18 |
|
50min |
125.9±3.63 |
129.09±4.62 |
76.54±4.40 |
78.29±4.27 |
|
60min |
129.3±3.89 |
131.89±5.22 |
78.40±4.51 |
80.21±4.45 |
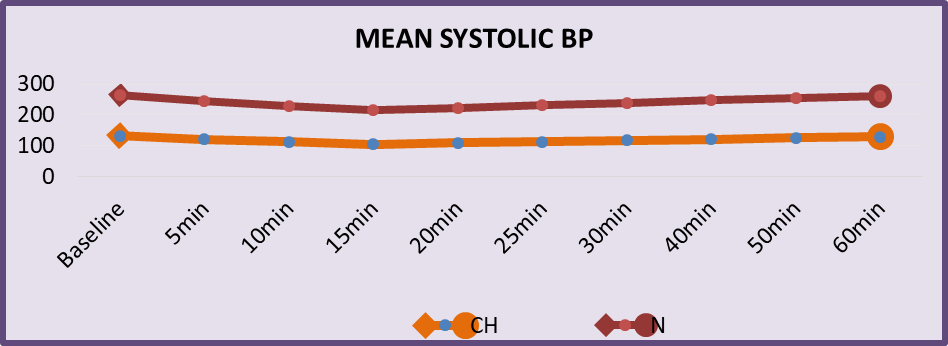
Graph 6 (A): Showing Mean Systolic and Diastolic BP distribution among study population:
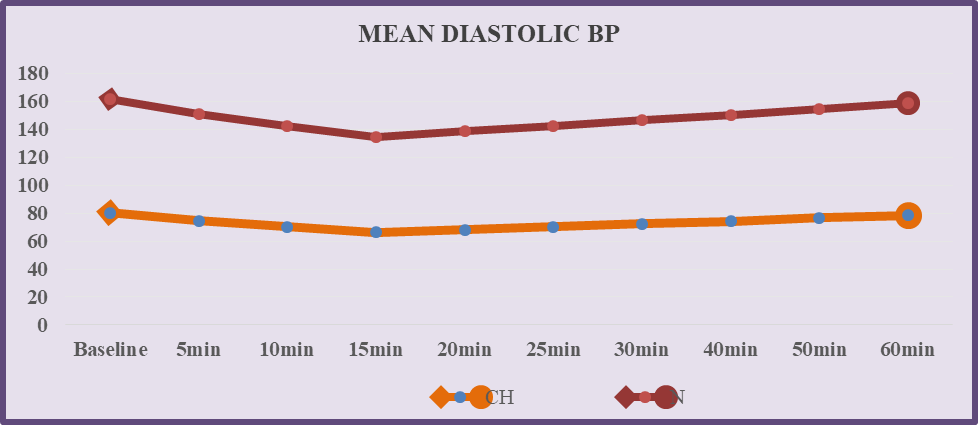
Graph 6(B): Showing Mean Diastolic BP distribution among study population
Table 7: Mean Heart rate distribution among study population:
|
Time line |
Mean HR |
|
|
CH |
N |
|
|
Baseline |
79.07±6.23 |
75.6±7.61 |
|
5min |
76.81±5.93 |
73.70±7.36 |
|
10min |
72.25±10.26 |
71.41±6.94 |
|
15min |
71.96±5.05 |
69.2±6.75 |
|
20min |
73.96±5.05 |
71.16±6.89 |
|
25min |
75.92±5.09 |
73.01±6.94 |
|
30min |
77.89±5.12 |
75.09±6.98 |
|
40min |
78.65±5.48 |
75.6±7.25 |
|
50min |
79.10±5.82 |
75.67±7.46 |
|
60min |
79.03±6.09 |
75.6±7.45 |
|
P-Value |
<0.0001 |
|
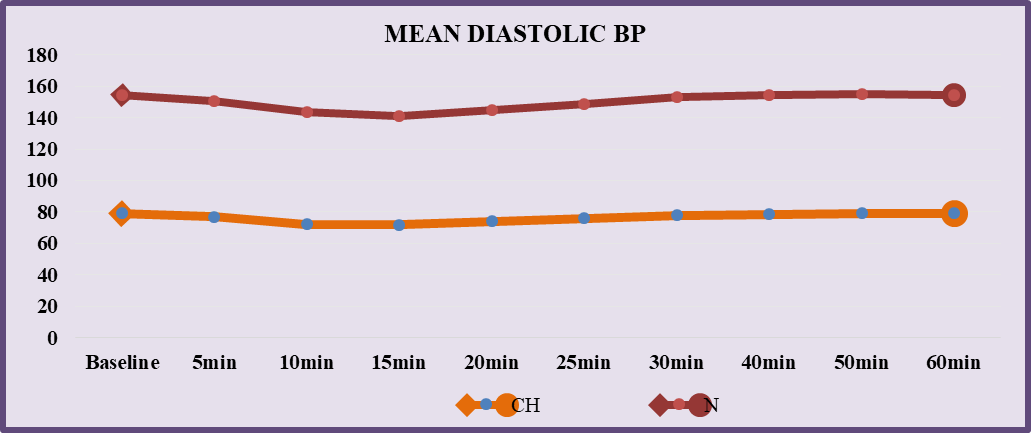
Graph 7: Showing Mean Heart rate distribution among study population:
Table 8: Outcome distribution among study population:
|
OUTCOME |
CH(n=55) |
N(n=55) |
P-Value |
|
Duration of surgery |
93.45±6.09 |
80.72±11.88 |
<0.0001 |
|
Total fluid infusion |
1209±75.73 |
1070±89.79 |
<0.0001 |
|
Incidence of PONV |
19 |
11 |
0.099 |
|
Hospital Stay |
3.32±0.54 |
2.58±0.77 |
<0.0001 |
|
30 Day Cardiovascular Events |
0 |
0 |
NA |
Graph 8: Outcome distribution among study population
DISCUSSION:
Spinal anaesthesia is widely used due to its rapid onset and effective sensory blockade; however, it is commonly associated with hemodynamic alterations, particularly hypotension and bradycardia. The present study evaluated these responses in patients with controlled hypertension and normotension, highlighting important differences in perioperative stability.
Both groups were comparable with respect to baseline demographic and anthropometric characteristics, with no statistically significant differences (p > 0.05), ensuring that the observed differences in outcomes were primarily attributable to hypertensive status rather than confounding variables. Similar baseline comparability has been reported by Singh et al. [7], supporting the validity of such comparative analyses.
A significant difference in the distribution of ASA physical status was observed, with a higher proportion of ASA Grade II patients in the hypertensive group (36.4% vs 5.5%, p < 0.0001). This reflects the underlying comorbidity burden associated with hypertension and is consistent with clinical expectations. In contrast, Dohare et al. [8] reported no significant difference in ASA grading between groups.
The characteristics of spinal anaesthesia, including onset time (4.21 ± 0.77 vs 4.2 ± 0.79 min, p = 0.947) and level of sensory blockade (T10 in both groups), were comparable between the groups. Similar findings have been reported by Kweon et al. [9].
A key observation in the present study was greater hemodynamic variability in patients with controlled hypertension following spinal anaesthesia. These patients exhibited a higher incidence of hypotensive episodes (21.8% vs 5.5%, p < 0.05), with all episodes occurring at 15 minutes post-spinal anaesthesia, identifying this as a critical period. This finding is consistent with studies by Rabbani et al. [10] and Dinakar et al. [11].
However, not all studies agree. Acar et al. [12] reported relatively smaller differences between hypertensive and normotensive groups, suggesting variability due to anaesthetic and perioperative factors.
Normotensive patients demonstrated greater cardiovascular stability following spinal anaesthesia, consistent with observations by Dohare et al. [8].
Heart rate trends were comparable between groups in pattern, although the hypertensive group had significantly higher mean heart rate throughout the observation period (p < 0.0001). The incidence of bradycardia was similar in both groups (7.3% each, p > 0.05), suggesting that baseline hypertensive status does not significantly influence this parameter.
The observed hemodynamic differences translated into clinically relevant perioperative outcomes. Controlled hypertensive patients required greater intraoperative fluid administration (1209 ± 75.73 ml vs 1070 ± 89.79 ml, p < 0.0001), had longer duration of surgery (93.45 ± 6.09 vs 80.72 ± 11.88 min, p < 0.0001), and longer hospital stay (3.32 ± 0.54 vs 2.58 ± 0.77 days, p < 0.0001). Similar trends have been reported by Chander et al. [13] and Zvara et al. [14].
Although postoperative nausea and vomiting were more frequent in hypertensive patients (34.5% vs 20.0%, p = 0.099), the difference was not statistically significant.
Overall, the findings of the present study indicate that controlled hypertensive patients are more susceptible to hemodynamic instability following spinal anaesthesia. While the neural effects of spinal anaesthesia remain comparable, the altered physiological response in hypertensive individuals necessitates careful perioperative monitoring and individualised management strategies to optimise outcomes.
CONCLUSION:
Controlled hypertensive patients receiving spinal anaesthesia tend to experience more hemodynamic instability, especially being more prone to early hypotension and using more perioperative resources, even though their block characteristics are similar. These results emphasise the importance of close monitoring and prompt intervention, particularly during the early post-spinal phase.
However, as this was a single-centre study with a moderate sample size, the generalizability of the results is limited, and larger multicentric studies are recommended to validate these findings.
REFERENCES:
1. Butterworth JF, Mackey DC, Wasnick JD. Morgan & Mikhail's Clinical Anaesthesiology. 6th ed. New York: McGraw-Hill Education; 2018.
2. Apfelbaum JL, Hawkins JL, Agarkar M, Bucklin BA, Connis RT, Gambling DR, et al. Practice guidelines for obstetric anaesthesia: an updated report. Anaesthesiology. 2022;136(2):325–326.
3. Barash PG, Cullen BF, Stoelting RK, Cahalan MK, Stock MC. Clinical Anaesthesia. 8th ed. Philadelphia: Wolters Kluwer; 2017.
4. Campagna JA, Carter C. Clinical relevance of the Bezold–Jarisch reflex. Anaesthesiology. 2003;98(5):1250–1260.
5. Carpenter RL, Caplan RA, Brown DL, Stephenson C, Wu R. Incidence and risk factors for side effects of spinal anaesthesia. Anaesthesiology. 1992;76(6):906–916.
6. Kinsella SM, Carvalho B. Prevention and management of hypotension during spinal anaesthesia for elective cesarean delivery: a practical approach. Int J Obstet Anesth. 2022;49:103236.
7. Singh R, et al. Comparative evaluation of hemodynamic changes after spinal anaesthesia in hypertensive and normotensive patients. Indian J Anaesth. 2016;60(5):343–348.
8. Dohare A, et al. Comparative study of hemodynamic response following spinal anaesthesia in normotensive and hypertensive patients. Int J Res Med Sci. 2018;6(5):1603–1608.
9. Kweon TD, et al. Hemodynamic effects of spinal anaesthesia in patients with controlled hypertension. Korean J Anaesthesiol. 2013;65(3):203–208.
10. Rabbani MW, et al. Incidence of hypotension following spinal anaesthesia in controlled hypertensive patients. Pak J Med Sci. 2019;35(3):654–658
11. Dinakar M, et al. Hemodynamic response to spinal anaesthesia in hypertensive and normotensive patients. J Clin Diagn Res. 2015;9(6):UC01–UC04.
12. Acar HV, et al. Comparison of hypotension incidence in hypertensive and normotensive patients under spinal anaesthesia. J Anesth. 2010;24(5):683–688.
13. Chander A, et al. Perioperative hemodynamic changes in hypertensive patients under spinal anaesthesia. Anaesth Essays Res. 2017;11(2):387–392.
14. Zvara DA, et al. Perioperative cardiovascular outcomes in hypertensive patients undergoing regional anaesthesia. Anaesth Analg. 1996;82(2):250–255.