Evaluation of Biochemical and Anthropometric Parameters Associated with Insulin Resistance Using TyG Index.
- Eedarala Venkata Sathyanarayana , Assistant Professor, Department of General Medicine, Mamata Academy of Medical Sciences, Bachupally, Hyderabad.
- Buchupalli Lohit Reddy , Senior Resident, Department of General Medicine, M.N.R. Medical College, Sanga Reddy, Hyderabad.
- Yanamaddi Sai Ram , Senior Resident, Department of General Medicine, M.N.R. Medical College, Sanga Reddy, Hyderabad.
- Muddu Surendra Nehru , Professor, Department of General Medicine, M.N.R. Medical College, Sanga Reddy, Hyderabad.
- P Vamsee Krishna , Conscultant Physician of General Medicine, Hyderabad.
- Veluri Venkata Subbareddy , Post Graduate, Department of General Medicine, M.N.R. Medical College, Sanga Reddy, Hyderabad.
Article Information:
Abstract:
Background: Insulin resistance (IR) is a major metabolic abnormality associated with type 2 diabetes mellitus, obesity, dyslipidemia, metabolic syndrome, and cardiovascular diseases. The Triglyceride-Glucose (TyG) index has emerged as a simple and cost-effective surrogate marker for assessing insulin resistance using routinely available biochemical parameters. Aim of the study was to evaluate the biochemical and anthropometric parameters associated with insulin resistance using the TyG index among study participants. Materials and Methods: This hospital-based cross-sectional observational study was conducted in the Department of General Medicine among 150 adult participants. Anthropometric parameters including body mass index (BMI) and waist circumference were measured using standard methods. Biochemical investigations such as fasting plasma glucose (FPG), triglycerides (TG), high-density lipoprotein cholesterol (HDL-C), low-density lipoprotein cholesterol (LDL-C), glycated hemoglobin (HbA1c), and fasting insulin levels were estimated. TyG index and HOMA-IR were calculated using standard formulas. Statistical analysis was performed using SPSS software version 25.0. Results: The mean age of the participants was 51.05 ± 15.02 years. The mean FPG, triglycerides, and HbA1c levels were 115.08 ± 41.51 mg/dL, 155.83 ± 97.04 mg/dL, and 7.30 ± 1.89%, respectively. The mean waist circumference and BMI were 98.18 ± 30.70 cm and 22.84 ± 15.02 kg/m² respectively. The mean fasting insulin level was 17.31 ± 13.08 µIU/mL. The mean TyG index and HOMA-IR values were 8.99 ± 0.76 and 5.73 ± 5.82 respectively. Insulin resistance was observed in 110 participants (73.3%), while 40 participants (26.7%) were insulin resistance negative. TyG index demonstrated significant positive correlations with fasting plasma glucose, triglycerides, HbA1c, fasting insulin, BMI, waist circumference, and HOMA-IR. Conclusion: The TyG index showed significant association with biochemical and anthropometric parameters related to insulin resistance. A strong positive correlation was observed between TyG index and HOMA-IR, indicating that TyG index can serve as a reliable, economical, and easily applicable surrogate marker for insulin resistance in routine clinical practice.
Keywords:
Article :
INTRODUCTION:
diabetes mellitus, metabolic syndrome, obesity, hypertension, dyslipidemia, and cardiovascular disease. It refers to a reduced biological response of peripheral tissues to circulating insulin, resulting in impaired glucose uptake and compensatory hyperinsulinemia. The global burden of insulin resistance has increased significantly in recent decades due to rapid urbanization, sedentary lifestyle, unhealthy dietary habits, and increasing prevalence of obesity. Early identification of insulin resistance is important because it precedes the development of overt diabetes and cardiovascular complications by several years (1).
Several biochemical and anthropometric markers have been evaluated for assessing insulin resistance. Anthropometric parameters such as body mass index (BMI), waist circumference, and central obesity are strongly associated with metabolic dysfunction and insulin resistance. Similarly, biochemical markers including fasting plasma glucose (FPG), serum triglycerides (TG), high-density lipoprotein cholesterol (HDL-C), glycated hemoglobin (HbA1c), fasting insulin levels, and lipid abnormalities have been widely studied as predictors of insulin resistance and cardiometabolic risk. Increased triglyceride levels and impaired glucose metabolism are considered major contributors to endothelial dysfunction, oxidative stress, and chronic low-grade inflammation associated with insulin resistance (2).
The hyperinsulinemic-euglycemic clamp technique is considered the gold standard method for measuring insulin resistance. However, its routine clinical use is limited because of its complexity, high cost, and requirement for specialized expertise. Homeostatic Model Assessment for Insulin Resistance (HOMA-IR) is another commonly used method but requires fasting insulin estimation, which may not be readily available in all healthcare settings. Hence, there is a growing interest in identifying simpler, economical, and reliable surrogate markers for insulin resistance (3).
The triglyceride-glucose (TyG) index has emerged as a promising surrogate marker for insulin resistance. It is calculated using fasting triglyceride and fasting glucose levels, both of which are routinely available laboratory parameters. Recent evidence suggests that the TyG index correlates well with insulin resistance measured by HOMA-IR and even with the hyperinsulinemic-euglycemic clamp method. Due to its simplicity, low cost, and easy applicability, the TyG index has gained considerable importance in clinical practice and epidemiological studies (4).
Recent studies have demonstrated significant associations between the TyG index and various metabolic abnormalities including obesity, metabolic syndrome, non-alcoholic fatty liver disease, hypertension, type 2 diabetes mellitus, and cardiovascular disease. Han et al. reported that TyG combined with anthropometric measures such as waist circumference and BMI had superior diagnostic ability for identifying metabolic dysfunction-associated fatty liver disease (5). Similarly, Wan et al. observed that the TyG index showed slightly better predictive ability for metabolic syndrome compared to HOMA-IR in the adult population (6). Park et al. demonstrated that the TyG index had higher sensitivity and diagnostic accuracy than HOMA-IR for predicting metabolic syndrome in large cohort studies (2). Another recent observational study showed that elevated TyG index values were positively correlated with HOMA-IR and significantly increased the risk of insulin resistance (7).
Although several international studies have evaluated the utility of the TyG index, there remains limited data regarding its association with anthropometric and biochemical parameters in the Indian population, particularly in hospital-based settings. Ethnic differences, dietary patterns, genetic predisposition, and lifestyle factors may influence insulin resistance and metabolic risk profiles. Moreover, most available studies have focused predominantly on metabolic syndrome or diabetes, whereas comprehensive evaluation involving multiple biochemical and anthropometric parameters remains relatively limited. There is also inadequate evidence comparing TyG index with conventional insulin resistance indicators such as HOMA-IR in routine clinical practice among Indian adults (8).
Therefore, the present study was undertaken to evaluate the biochemical and anthropometric parameters associated with insulin resistance using the TyG index. The study also aims to assess the relationship between TyG index and conventional markers of insulin resistance among the study population. Identification of a simple and cost-effective marker such as the TyG index may help in early detection of high-risk individuals and facilitate timely preventive and therapeutic interventions to reduce future metabolic and cardiovascular complications.
MATERIALS AND METHODS:
Study Design
The present study was designed as a hospital-based cross-sectional observational study conducted to evaluate the biochemical and anthropometric parameters associated with insulin resistance using the Triglyceride-Glucose (TyG) Index among adult patients attending the Department of General Medicine.
Study Setting
The study was carried out in the Department of General Medicine. The study population included adult patients attending the outpatient and inpatient services of the Department of General Medicine who fulfilled the inclusion criteria during the study period. A total of 150 study participants were included in the study.
Sampling Method
Patients satisfying the eligibility criteria were selected by convenient sampling method after obtaining informed written consent.
Ethical Considerations
Institutional Ethical Committee clearance was obtained prior to commencement of the study. Written informed consent was obtained from all participants before enrollment into the study. Confidentiality of patient information was strictly maintained throughout the study.
Inclusion Criteria
1. Adults aged ≥18 years.
2. Patients attending the Department of General Medicine.
3. Individuals willing to participate in the study.
4. Patients who underwent fasting blood investigations including fasting plasma glucose and lipid profile.
5. Patients with complete anthropometric measurements.
Exclusion Criteria
1. Patients with type 1 diabetes mellitus.
2. Pregnant and lactating women.
3. Patients with severe hepatic dysfunction.
4. Patients with chronic kidney disease on dialysis.
5. Patients receiving steroids or drugs affecting glucose metabolism.
6. Patients with acute severe illness or sepsis.
7. Patients with malignancy or chronic inflammatory disorders.
8. Patients unwilling to participate in the study.
Study Tools
The following tools and parameters were used for data collection and assessment:
Anthropometric Parameters
• Height
• Weight
• Body Mass Index (BMI)
• Waist circumference
Biochemical Parameters
• Fasting Plasma Glucose (FPG)
• Serum Triglycerides (TG)
• High Density Lipoprotein Cholesterol (HDL-C)
• Low Density Lipoprotein Cholesterol (LDL-C)
• Glycated Hemoglobin (HbA1c)
• Fasting Serum Insulin
Insulin Resistance Assessment
• Triglyceride-Glucose (TyG) Index
• Homeostatic Model Assessment for Insulin Resistance (HOMA-IR)
Data Collection Procedure
The data collection procedure was carried out in the following steps:
• Eligible patients attending the Department of General Medicine were screened for inclusion and exclusion criteria.
• Written informed consent was obtained from all study participants.
• Detailed demographic data including age and gender were recorded.
• Clinical history and relevant medical details were documented using a predesigned proforma.
• Anthropometric measurements including height, weight, waist circumference, and BMI were measured using standard techniques.
• After overnight fasting of 8–12 hours, venous blood samples were collected under aseptic precautions.
• Biochemical investigations including fasting plasma glucose, serum triglycerides, HDL cholesterol, LDL cholesterol, HbA1c, and fasting insulin were measured in the central laboratory.
• TyG index was calculated using the formula:
• HOMA-IR was calculated using the formula:
•
• Patients were categorized into insulin resistance positive and negative groups based on HOMA-IR values.
• All collected data were entered into Microsoft Excel and analyzed using Statistical Package for Social Sciences (SPSS) software version 25.0.
Statistical Analysis
Data were expressed as mean ± standard deviation (SD) for continuous variables and percentages for categorical variables. Comparison between groups was performed using Student’s t-test and Chi-square test wherever appropriate. Correlation between TyG index and HOMA-IR was assessed using Pearson’s correlation coefficient. A p-value of less than 0.05 was considered statistically significant.
RESULTS:
Table 1: Demographic Characteristics of Study Participants (n = 150)
|
Variable |
Mean ± SD |
|
Age (years) |
51.05 ± 15.02 |
|
Waist Circumference (cm) |
98.18 ± 30.70 |
|
Body Mass Index (BMI) (kg/m²) |
22.84 ± 15.02 |
The mean age of the study participants was 51.05 ± 15.02 years. The average waist circumference was 98.18 ± 30.70 cm and the mean BMI was 22.84 ± 15.02 kg/m², indicating significant anthropometric variation among the participants.
Table 2: Glycemic Parameters among Study Participants (n = 150)
|
Variable |
Mean ± SD |
|
Fasting Plasma Glucose (FPG) (mg/dL) |
115.08 ± 41.51 |
|
HbA1c (%) |
7.30 ± 1.89 |
|
Fasting Insulin (µIU/mL) |
17.31 ± 13.08 |
|
HOMA-IR |
5.73 ± 5.82 |
The mean fasting plasma glucose level was 115.08 ± 41.51 mg/dL. The average HbA1c level was 7.30 ± 1.89%, while the mean fasting insulin level was 17.31 ± 13.08 µIU/mL. The mean HOMA-IR value was 5.73 ± 5.82, indicating a considerable burden of insulin resistance.
Table 3: Lipid Profile Parameters among Study Participants (n = 150)
|
Variable |
Mean ± SD |
|
Triglycerides (TG) (mg/dL) |
155.83 ± 97.04 |
|
HDL Cholesterol (mg/dL) |
53.89 ± 28.30 |
|
LDL Cholesterol (mg/dL) |
62.15 ± 56.70 |
The mean triglyceride level among study participants was 155.83 ± 97.04 mg/dL. The mean HDL cholesterol level was 53.89 ± 28.30 mg/dL and the mean LDL cholesterol level was 62.15 ± 56.70 mg/dL.
Table 4: Distribution of TyG Index among Study Participants (n = 150)
|
Variable |
Mean ± SD |
|
TyG Index |
8.99 ± 0.76 |
The mean TyG index among the study population was 8.99 ± 0.76, suggesting a high prevalence of metabolic dysfunction and insulin resistance risk.
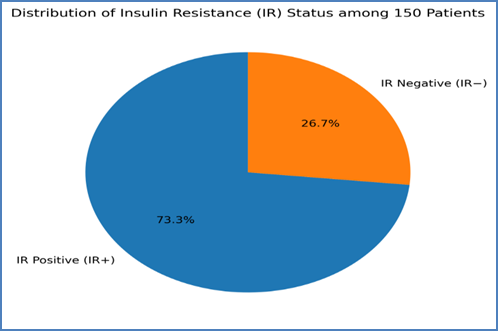
Figure 1: Distribution of Insulin Resistance Status among Study Participants (n = 150)
Among the total study participants, 110 patients (73.3%) were insulin resistance positive, while 40 patients (26.7%) were insulin resistance negative.
Table 6: Correlation of TyG Index with Anthropometric Parameters among Study Participants (n = 150)
|
Variable |
Correlation Coefficient (r) |
p-value |
|
Waist Circumference |
0.62 |
<0.001 |
|
BMI |
0.54 |
<0.001 |
|
Age |
0.31 |
0.002 |
TyG index showed a significant positive correlation with waist circumference, BMI, and age. Waist circumference demonstrated the strongest correlation with TyG index, indicating its close association with insulin resistance.
Table 7: Correlation of TyG Index with Glycemic Parameters among Study Participants (n = 150)
|
Variable |
Correlation Coefficient (r) |
p-value |
|
Fasting Plasma Glucose (FPG) |
0.78 |
<0.001 |
|
HbA1c |
0.69 |
<0.001 |
|
Fasting Insulin |
0.72 |
<0.001 |
|
HOMA-IR |
0.81 |
<0.001 |
A strong positive correlation was observed between TyG index and glycemic parameters including FPG, HbA1c, fasting insulin, and HOMA-IR. HOMA-IR showed the strongest correlation with TyG index.
Table 8: Correlation of TyG Index with Lipid Parameters among Study Participants (n = 150)
|
Variable |
Correlation Coefficient (r) |
p-value |
Significance |
|
Triglycerides (TG) |
0.84 |
<0.001 |
Significant |
|
HDL Cholesterol |
-0.48 |
<0.001 |
Significant Negative Correlation |
|
LDL Cholesterol |
0.39 |
<0.001 |
Significant |
TyG index demonstrated a strong positive correlation with triglyceride levels and LDL cholesterol, while HDL cholesterol showed a significant negative correlation, suggesting worsening lipid abnormalities with increasing insulin resistance.
Table 9: Correlation of HOMA-IR with Anthropometric and Biochemical Parameters (n = 150)
|
Variable |
Correlation Coefficient (r) |
p-value |
|
BMI |
0.49 |
<0.001 |
|
Waist Circumference |
0.58 |
<0.001 |
|
FPG |
0.73 |
<0.001 |
|
HbA1c |
0.66 |
<0.001 |
|
Triglycerides |
0.71 |
<0.001 |
HOMA-IR showed significant positive correlations with BMI, waist circumference, fasting plasma glucose, HbA1c, and triglyceride levels, supporting its role as an important marker of metabolic dysfunction.
Table 10: Comparison of TyG Index between IR Positive and IR Negative Groups
|
IR Status |
Mean TyG Index ± SD |
p-value |
Significance |
|
IR Positive (n = 110) |
9.42 ± 0.64 |
<0.001 |
Significant |
|
IR Negative (n = 40) |
8.11 ± 0.42 |
The mean TyG index was significantly higher in IR-positive patients compared to IR-negative patients, indicating a strong association between elevated TyG index and insulin resistance.
Table 12: Pearson Correlation between TyG Index and HOMA-IR
|
Variable 1 |
Variable 2 |
Correlation Coefficient (r) |
p-value |
|
TyG Index |
HOMA-IR |
0.81 |
<0.001 |
A strong positive correlation was observed between TyG index and HOMA-IR, suggesting that TyG index can serve as a reliable surrogate marker for insulin resistance in clinical practice.
DISCUSSION:
The present hospital-based cross-sectional study was conducted among 150 participants attending the Department of General Medicine to evaluate biochemical and anthropometric parameters associated with insulin resistance using the Triglyceride-Glucose (TyG) index. Insulin resistance is increasingly recognized as a major contributor to metabolic syndrome, type 2 diabetes mellitus, obesity, dyslipidemia, and cardiovascular disease. The TyG index has emerged as a simple, economical, and reliable surrogate marker for insulin resistance because it utilizes routinely available fasting glucose and triglyceride values.
In the present study, the mean age of the participants was 51.05 ± 15.02 years, suggesting that insulin resistance and metabolic abnormalities were more prevalent among middle-aged and elderly individuals. Similar findings were reported by Selvi et al. (9), who observed increased insulin resistance markers among middle-aged adults with metabolic dysfunction. Increasing age is associated with reduced insulin sensitivity due to altered body composition, increased visceral adiposity, and decreased physical activity.
The mean fasting plasma glucose (FPG) level in the present study was 115.08 ± 41.51 mg/dL, while the mean HbA1c was 7.30 ± 1.89%, indicating impaired glycemic status among the study population. Elevated fasting glucose and HbA1c levels are well-established indicators of poor glycemic control and insulin resistance. Similar observations were made by Park et al. (10), who demonstrated that TyG index had superior predictive ability for type 2 diabetes compared to HOMA-IR. The authors concluded that elevated TyG index values were significantly associated with worsening glucose metabolism and increased diabetes risk.
The present study demonstrated elevated triglyceride levels with a mean TG value of 155.83 ± 97.04 mg/dL. Dyslipidemia plays a crucial role in the pathogenesis of insulin resistance. Elevated triglycerides lead to increased free fatty acid release, resulting in impaired insulin signaling and enhanced hepatic gluconeogenesis. HDL cholesterol levels in the present study showed wide variation, with a mean value of 53.89 ± 28.30 mg/dL. Previous studies have consistently demonstrated an inverse relationship between HDL cholesterol and insulin resistance. Wang et al. (11) reported that TyG index showed stronger associations with metabolic abnormalities and arterial stiffness than HOMA-IR in diabetic individuals. The authors also observed that higher triglyceride levels and lower HDL cholesterol were significantly associated with increased TyG index values.
Anthropometric parameters are important indicators of metabolic dysfunction and insulin resistance. In the present study, the mean waist circumference was 98.18 ± 30.70 cm, while the mean BMI was 22.84 ± 15.02 kg/m². Central obesity and visceral adiposity are strongly associated with insulin resistance because abdominal fat deposition contributes to inflammatory cytokine release and impaired insulin action. Lee et al. (12) observed that TyG index was significantly associated with obesity-related metabolic disturbances and cardiovascular risk factors. Similarly, Aman et al. (13) demonstrated significant concordance between TyG index and HOMA-IR in assessing insulin resistance among adults.
The mean fasting insulin level in the present study was 17.31 ± 13.08 µIU/mL, and the mean HOMA-IR was 5.73 ± 5.82, indicating a high prevalence of insulin resistance among participants. HOMA-IR remains one of the most widely used surrogate markers for insulin resistance; however, fasting insulin estimation may not always be feasible in resource-limited settings. Therefore, the TyG index provides a simpler alternative. In the present study, the mean TyG index was 8.99 ± 0.76. A significant proportion of participants demonstrated elevated TyG values, indicating increased metabolic risk.
Among the study participants, 110 patients (73.3%) were categorized as insulin resistance positive, while 40 patients (26.7%) were insulin resistance negative. This finding highlights the substantial burden of insulin resistance in the studied population. Similar observations were reported by Wan et al. (14), who found that TyG index had slightly superior diagnostic performance compared to HOMA-IR in identifying metabolic syndrome and insulin resistance. Their meta-analysis suggested that TyG index may identify a larger number of high-risk individuals in routine clinical practice.
The present study also demonstrated significant positive correlations between TyG index and glycemic parameters such as fasting plasma glucose, HbA1c, insulin levels, and HOMA-IR. A strong positive correlation between TyG index and HOMA-IR was observed, suggesting that TyG index can reliably reflect insulin resistance status. Similar findings were observed by Kim et al. (15), who reported that TyG index showed a stronger association with diabetes risk than HOMA-IR among metabolically unhealthy individuals.
Furthermore, TyG index demonstrated positive correlations with triglycerides, LDL cholesterol, BMI, and waist circumference, indicating its association with both biochemical and anthropometric markers of metabolic dysfunction. These findings are in agreement with the observations of Zeng et al. (16), who reported that TyG index and HOMA-IR were significantly associated with cardiovascular risk and congestive heart failure incidence. The authors suggested that TyG index may serve as an effective marker for early cardiometabolic risk stratification.
The present study supports the growing evidence that TyG index is a simple, cost-effective, and clinically useful surrogate marker for insulin resistance. Since fasting glucose and triglyceride estimations are routinely performed in most healthcare settings, TyG index can be easily incorporated into routine clinical practice without additional financial burden. Early identification of insulin resistance may facilitate lifestyle modification and therapeutic interventions aimed at preventing diabetes and cardiovascular complications.
However, the study has certain limitations. Being a cross-sectional study, causal relationships could not be established. The study was conducted at a single tertiary care center with a relatively limited sample size, which may affect generalizability. Further multicentric prospective studies with larger populations are required to validate the findings.
CONCLUSION:
The present study demonstrated a high prevalence of insulin resistance among the study population. TyG index showed significant associations with biochemical parameters such as fasting plasma glucose, triglycerides, HbA1c, fasting insulin, and HOMA-IR, as well as anthropometric parameters including BMI and waist circumference. A strong positive correlation between TyG index and HOMA-IR was observed, indicating that TyG index can serve as a reliable surrogate marker for insulin resistance. Due to its simplicity, low cost, and easy applicability, TyG index may be effectively utilized for early identification of insulin resistance and cardiometabolic risk in routine clinical practice.
REFERENCES:
1. Kurniawan LB, Bahrun U, Hatta M, Arif M. Triglyceride-glucose index as a biomarker of insulin resistance: a review of current evidence. Cureus. 2024;16(2):e54021. doi:10.7759/cureus.54021.
2. Han AL, Lee HK, Shin SR. Diagnostic performance of insulin resistance indices for metabolic dysfunction-associated fatty liver disease in Korean adults. Metab Syndr Relat Disord. 2024;22(4):233-241. doi:10.1089/met.2023.0276.
3. Muddu Surendra Nehru, Eedarala Venkata Sathyanarayana, Thousif Ahmed, Rakesh, Naresh. Waist Circumference-Triglyceride-Glucose Index as a Predictor of Central Obesity-Linked Dyslipidemia and Insulin Resistance: A Clinical Study of 50 Patients in Urban India. International Journal of Current Pharmaceutical Review and Research 2026; 18(2); 826-833
4. Sachdev MC, Nehru MS, Rahul K, Varshha AS Association of Triglyceride–Glucose (TyG) Index with HbA1c Levels in Adults: A Cross-Sectional Study from a Tertiary Care Center. Int. J. Med., 2026;8(3):54-60.
5. Nas N, Kaya SU, Çelik M, et al. The triglyceride-glucose index: a marker of insulin resistance and cardiometabolic risk. Endocrine. 2025;88(1):45-54. doi:10.1007/s12020-024-03945-7.
6. Avagimyan A, Popov V, Duprez D, et al. Triglyceride-glucose index as a novel biomarker in cardiometabolic disease and cardiovascular risk prediction. Int J Cardiol. 2025;402:131990. doi:10.1016/j.ijcard.2024.131990.
7. Shirinezhad A, Yadegar A, Heidari-Beni M, et al. A systematic review of insulin resistance surrogate indices and bone mineral density. Front Endocrinol (Lausanne). 2024;15:1288206. doi:10.3389/fendo.2024.1288206.
8. Mirr M, Skrypnik D, Bogdański P, Owecki M. Newly proposed insulin resistance indexes called TyG-NC and TyG-NHtR in assessment of insulin resistance. Endocrine. 2021;73(2):344-352. doi:10.1007/s12020-021-02759-7.
9. Selvi NMK, Nandhini S, Sakthivadivel V, Lokesh S. Association of triglyceride-glucose index (TyG index) with HbA1c and insulin resistance in type 2 diabetes mellitus. Maedica (Bucur). 2021;16(3):375-381. doi:10.26574/maedica.2021.16.3.375
10. Park HM, Lee HS, Lee YJ. The triglyceride-glucose index is a more powerful surrogate marker than HOMA-IR for predicting type 2 diabetes mellitus. Diabetes Res Clin Pract. 2021;180:109042. doi:10.1016/j.diabres.2021.109042
11. Wang S, Shi J, Peng Y, Fang Q, Mu Q. Stronger association of triglyceride glucose index than HOMA-IR with arterial stiffness in patients with type 2 diabetes. Cardiovasc Diabetol. 2021;20(1):82. doi:10.1186/s12933-021-01274-x
12. Lee DH, Han K, Park S, et al. Association between triglyceride-glucose index and cardiovascular risk factors in adults. Cardiovasc Diabetol. 2022;21(1):186. doi:10.1186/s12933-022-01636-5
13. Aman M, Aggarwal D, Khan MM, et al. Concordance of triglyceride glucose index with HOMA-IR in assessment of insulin resistance. Clin Epidemiol Glob Health. 2021;9:34-39. doi:10.1016/j.cegh.2020.07.005
14. Wan H, Wang Y, Xiang Q, et al. Superiority of the triglyceride glucose index over HOMA-IR in predicting metabolic syndrome: a systematic review and meta-analysis. Sci Rep. 2024;14(1):16692. doi:10.1038/s41598-024-66692-9
15. Kim B, Kim K, Lee S, et al. Association of HOMA-IR versus TyG index with diabetes in metabolically unhealthy normal weight individuals. Front Endocrinol (Lausanne). 2024;15:1490079. doi:10.3389/fendo.2024.1490079
16. Zeng X, Liu J, Tao S, et al. Triglyceride-glucose index and homeostasis model assessment-insulin resistance in predicting congestive heart failure. Front Cardiovasc Med. 2022;9:944258. doi:10.3389/fcvm.2022.944258.