Serum Lipid Profile as an Indicator of Severity in Liver Cirrhosis: A Cross-Sectional Study.
- Chinmay R Hosamani , Postgraduate, MBBS, Department of General Medicine, The Oxford Medical College Hospital and Research Centre, Bangalore, India.
- Roopesh Yarappa , Assistant Professor, MBBS, MD, Department of General Medicine, The Oxford Medical College Hospital and Research Centre, Bangalore, India.
- Akshay Raveendra Japal , Postgraduate, MBBS, MD General Medicine, Department of General Medicine The Oxford Medical College Hospital and Research Centre, Bangalore, India.
Article Information:
Abstract:
Background: Liver cirrhosis is a critical end-stage liver disease characterized by progressive fibrosis and loss of hepatic function. The liver plays a central role in lipid metabolism, and its dysfunction in cirrhosis leads to significant alterations in serum lipid profiles. This study aimed to evaluate the relationship between serum lipid profiles and the severity of liver cirrhosis, as assessed by Child-Pugh classification and Model for End-Stage Liver Disease (MELD) scores. Materials and Methods: This cross-sectional study included 65 patients diagnosed with liver cirrhosis at a tertiary care center in Bangalore, India, from April 2023 to September 2024. Demographic characteristics, clinical parameters, and fasting lipid profiles (total cholesterol, triglycerides, LDL- cholesterol, and HDL-cholesterol) were assessed. Disease severity was evaluated using Child-Pugh classification and MELD scores. Statistical analysis was performed using SPSS version 20, with chi-square tests, t-tests, and ANOVA as appropriate. A p-value <0.05 was considered statistically significant. Results: The study population comprised predominantly males (78.4%) and middle-aged adults (64.5% between 41-60 years). Abnormal lipid profiles were observed in the majority of patients, with 90.8% having reduced total cholesterol and HDL-cholesterol levels. Significant inverse correlations were found between lipid parameters and disease severity. As Child-Pugh class progressed from A to C, there were significant decreases in total cholesterol (166.5±37.3 to 93.5±21.1 mg/dL, p<0.001), LDL- cholesterol (106.1±23.4 to 63.4±14.8 mg/dL, p<0.001), and HDL-cholesterol (41.5±12.2 to 24.5±6.5 mg/dL, p<0.001). Similarly, increasing MELD scores were associated with significant decreases in all lipid parameters (p=0.03-0.04). However, no significant associations were found between lipid parameters and specific complications of cirrhosis. Conclusion: Serum lipid profiles, particularly total cholesterol, LDL-cholesterol, and HDL-cholesterol, show significant inverse correlations with established prognostic indicators of cirrhosis severity. These parameters may serve as biochemical markers for assessing the severity of hepatic dysfunction in cirrhosis, potentially complementing established scoring systems in the evaluation of disease severity.
Keywords:
Article :
INTRODUCTION:
Cirrhosis of the liver is a critical end-stage liver disease characterized by the replacement of normal liver tissue with fibrosis, leading to progressive loss of liver function [1]. It is a significant global health concern, with an estimated prevalence of 4.5% to 9.5% in the general population [2]. The etiology of cirrhosis is diverse, including chronic alcohol consumption, viral hepatitis, non-alcoholic fatty liver disease, and autoimmune disorders [3].
The liver plays a crucial role in lipid metabolism, including the synthesis of cholesterol, triglycerides, and lipoproteins [4]. In cirrhosis, these metabolic functions are often compromised, leading to alterations in the lipid profile [5]. These changes can manifest as decreased levels of total cholesterol, low-density lipoprotein (LDL) cholesterol, and high-density lipoprotein (HDL) cholesterol, as well as variations in triglyceride levels [6].
The severity of cirrhosis is traditionally assessed using scoring systems such as the Child-Pugh score and the Model for End-Stage Liver Disease (MELD) score [7]. These systems incorporate various clinical and laboratory parameters but do not directly consider lipid profile alterations. Recent research has suggested that the lipid profile may serve as an additional indicator of liver disease severity and prognosis in cirrhotic patients [8].
The relationship between lipid profile and cirrhosis severity is complex and multifaceted. Cirrhosis affects lipid metabolism through various mechanisms, including reduced hepatic synthesis of lipoproteins, altered cholesterol metabolism, and changes in bile acid production [9]. Additionally, malnutrition, which is common in advanced cirrhosis, can further impact lipid levels. Understanding these interactions is crucial for interpreting lipid profile changes in the context of liver disease progression.
Several studies have demonstrated correlations between lipid profile abnormalities and the progression of liver cirrhosis. Chrostek et al.[6] found that lower total cholesterol levels were associated with more advanced stages of cirrhosis. Similarly, Habib et al. [8] reported that decreased HDL cholesterol levels correlated with higher Child-Pugh scores. Ghadir et al.[5] observed significant decreases in lipid parameters with increasing severity of liver disease. These findings suggest that the lipid profile could potentially be used as a non-invasive marker for assessing the severity of liver cirrhosis.
The present study was undertaken to evaluate the relationship between serum lipid profiles and the severity of liver cirrhosis, as assessed by established prognostic models including the Child-Pugh classification and Model for End-Stage Liver Disease (MELD) scores. Additionally, we sought to examine associations between lipid parameters and major complications of cirrhosis including ascites, hepatic encephalopathy, upper gastrointestinal bleeding, and spontaneous bacterial peritonitis. Understanding these relationships may provide clinicians with additional prognostic markers to evaluate disease severity and potentially guide management strategies in patients with liver cirrhosis.
Aims and Objectives
The primary aim of this study was to study the serum lipid profile in patients with cirrhosis of the liver. The specific objectives were: (1) to correlate serum lipid profile with Child-Pugh Turcotte score as a severity indicator, and (2) to correlate serum lipid profile with MELD score.
MATERIALS AND METHODS:
Study Design
This was an observational cross-sectional study conducted in the Department of General Medicine at a tertiary care center in Bangalore, Karnataka, India.
Study Duration and Population
The research was conducted over an 18-month period from April 2023 to September 2024. The study included patients admitted as inpatients in the Department of General Medicine who were diagnosed with liver cirrhosis.
Sample Size
The sample size was calculated based on the study conducted by Yamuna J et al.[11], considering the mean and standard deviation of HDL levels in cirrhotic patients. Using the formula n = (Z2 × σ2)/d2, with Z = 1.96 at 95% confidence interval, standard deviation of 36.98, and an estimation error of 3%, the calculated sample size was 65 patients.
Inclusion and Exclusion Criteria
Inclusion criteria: Patients aged >30 years with liver cirrhosis who were willing to participate in the study.
Exclusion criteria: Patients with diabetes mellitus, cerebrovascular disease, those on lipid-lowering drugs, pancreatitis, chronic kidney disease, hypo/hyperthyroidism, and nephrotic syndrome were excluded to avoid confounding effects on lipid metabolism.
Sampling Procedure
All eligible patients consecutively attending the outpatient department or admitted as inpatients were considered until the sample size was met (consecutive sampling).
Data Collection
The study was conducted after obtaining ethical clearance from the Institutional Ethics Committee of The Oxford Medical College Hospital and Research Centre, Bangalore. Informed consent was obtained from all participants prior to their inclusion. A comprehensive medical history was obtained from each participant, followed by a thorough general physical examination and systemic examination, with special emphasis on abdominal examination. All data were meticulously recorded using a predefined proforma. The diagnosis of liver cirrhosis was established based on a combination of clinical stigmata, biochemical markers, and radiological evidence, mainly ultrasonography. For the assessment of lipid profiles, blood samples were collected under strict aseptic precautions from the antecubital vein after a mandatory 12-hour fasting period. The blood samples were analyzed using an EM 360 machine employing photometric techniques, providing precise quantification of total cholesterol, LDL-cholesterol, HDL-cholesterol, and triglycerides. To assess the severity of liver cirrhosis, two widely accepted scoring systems were utilized:
Child-Turcotte-Pugh (CTP) Score: Calculated based on five clinical measures including total bilirubin, serum albumin, prothrombin time, ascites, and hepatic encephalopathy. Each parameter was scored 1-3, with total scores classifying patients into Class A (5-6 points, least severe), B (7-9 points, moderately severe), or C (10-15 points, most severe).
Model for End-Stage Liver Disease (MELD) Score: Computed using serum bilirubin, serum creatinine, and the international normalized ratio (INR) using the formula: MELD = 3.78 × ln(serum bilirubin [mg/dL]) + 11.2 × ln(INR) + 9.57 × ln(serum creatinine [mg/dL]) + 6.43.
Complications of cirrhosis, including ascites, hepatic encephalopathy (graded I-IV), upper gastroin- testinal bleeding, and spontaneous bacterial peritonitis, were recorded.
Ethical Considerations
Throughout the study, patient confidentiality was strictly maintained, and all procedures were conducted in accordance with the ethical guidelines outlined in the Declaration of Helsinki. The researchers ensured that the study procedures caused minimal discomfort to the participants.
Statistical Analysis
Data were entered in Microsoft Excel and analyzed using the Statistical Package for the Social Sciences (SPSS) version 20 (IBM Corp., Chicago, IL). Results were presented in tabular and graphical forms. Mean, median, standard deviation, and ranges were calculated for quantitative data. Chi-square analysis was used to test for significant differences between proportions and frequencies. Independent t-test and one-way ANOVA were used to compare means between groups. The confidence interval was set at 95% limit, with a level of significance of p < 0.05.
RESULTS:
Demographic Characteristics
The study included 65 patients diagnosed with liver cirrhosis. The age distribution (Table 1) revealed that the majority of patients (64.5%) were in the middle-age range of 41-60 years, with 33.8% in the 41-50 years group and 30.7% in the 51-60 years group (Figure 1). Patients aged 30-40 years constituted 18.5% and those above 60 years represented 16.9%.
Table 1: Distribution of Patients According to Age.
|
Age (in years) |
No. of Patients |
Percentage |
|
30-40 |
12 |
18.5% |
|
41-50 |
22 |
33.8% |
|
51-60 |
20 |
30.7% |
|
>60 |
11 |
16.9% |
|
Total |
65 |
100% |
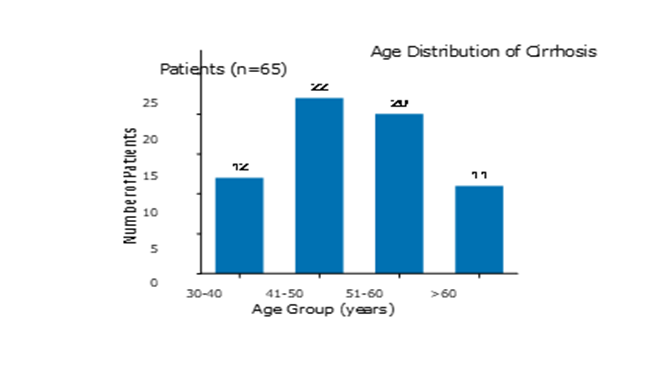
Figure 1: Age distribution of cirrhosis patients (n=65). The majority of patients were in the 41-50 years age group.
Regarding gender distribution (Table 2), the study showed a marked male predominance, with males comprising 78.4% (n=51) of the study population compared to 21.5% females (n=14) (Figure 2). This gender disparity suggests that men may be more susceptible to liver cirrhosis or its risk factors.
Table 2: Distribution of Patients According to Gender
|
Gender |
No .of Patients |
Percentage |
|
Female |
14 |
21.5% |
|
Male |
51 |
78.4% |
|
Total |
65 |
100% |
Gender Distribution
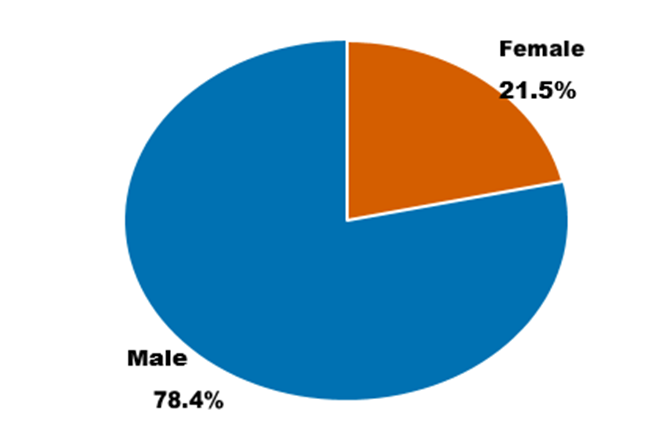
Figure 2: Gender distribution showing male predominance (78.4%) among cirrhosis patients.
Lipid Profile Abnormalities
Analysis of lipid profiles (Table 3, Figure 3) revealed that the majority of patients had reduced total cholesterol levels, with 90.8% having values below 200 mg/dL. HDL-cholesterol was reduced (<50 mg/dL) in 90.8% of patients, while LDL-cholesterol was reduced (<100 mg/dL) in 67.7% of patients. Triglycerides were normal (<150 mg/dL) in 69.2% of patients.
Table 3: Distribution of Patients According to Lipid Profile
|
Lipid Parameter |
Reference Range |
Frequency (n) |
Percentage (%) |
|
Total Cholesterol |
<200 |
59 |
90.8% |
|
≥200 |
6 |
9.2% |
|
|
Triglycerides |
<150 |
45 |
69.2% |
|
≥150 |
20 |
30.8% |
|
|
LDL |
<100 |
44 |
67.7% |
|
≥100 |
21 |
32.3% |
|
|
HDL |
≥50 |
6 |
9.2% |
|
<50 |
59 |
90.8% |
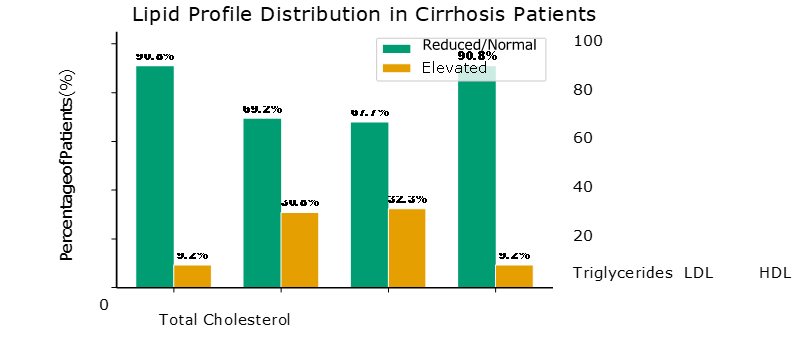
Figure 3: Lipid profile distribution in cirrhosis patients. Reduced total cholesterol and HDL were observed in over 90% of patients.
Disease Severity Classification
The distribution of patients according to Child-Pugh class (Table 4, Figure 4) showed that 36.9% (n=24) were classified as Child-Pugh A (least severe), 40% (n=26) as Child-Pugh B (moderately severe), and 23.1% (n=15) as Child-Pugh C (most severe).
Table 4: Distribution of Patients According to Child-Pugh Class
|
Child-Pugh Class |
No .of Patients |
Percentage |
|
A (5-6 points) |
24 |
36.9% |
|
B (7-9 points) |
26 |
40.0% |
|
C (10-15 points) |
15 |
23.1% |
|
Total |
65 |
100% |

Figure 4: Distribution according to Child-Pugh class. The majority of patients had moderate to severe liver dysfunction (Child-Pugh B and C).
Distribution according to MELD scores (Table 5, Figure 5) showed that 23.1% (n=15) had scores between 10-20, 30.8% (n=20) between 21-30, and 46.2% (n=30) between 31-40.
Table 5: Distribution of Patients According to MELD Scores
|
MELD Score |
No. of Patients |
Percentage |
|
10-20 |
15 |
23.1% |
|
21-30 |
20 |
30.8% |
|
31-40 |
30 |
46.2% |
|
Total |
65 |
100% |

Figure 5: Distribution according to MELD scores. Nearly half the patients had scores in the 31-40 range, indicating advanced liver disease.
Complications of Cirrhosis
The prevalence of complications is summarized in Figure 8. Ascites was the most common complication, present in 84.63% of patients (n=55), with 43.10% having mild ascites and 41.53% having moderate to severe ascites (Table 6). Hepatic encephalopathy was present in 72.3% of patients, with 40% having Grade I-II and 32.3% having Grade III-IV encephalopathy. Upper gastrointestinal bleeding occurred in 43.1% of patients (n=28), and spontaneous bacterial peritonitis was observed in 27.7% (n=18).
Table 6: Distribution of Patients According to Ascites
|
Ascites |
No. of Patients |
Percentage |
|
None |
10 |
15.38% |
|
Mild |
28 |
43.10% |
|
Moderate |
17 |
26.14% |
|
Severe |
10 |
15.38% |
|
Total |
65 |
100% |

Figure 6: Prevalence of complications among cirrhosis patients. Ascites (84.63%) and hepatic encephalopa- thy (72.3%) were the most common.
Association of Child-Pugh Class with Lipid Profile
One of the most significant findings of our study was the strong inverse relationship between lipid parameters and Child-Pugh class. As the Child-Pugh class progressed from A to C (indicating worsening liver function), there was a statistically significant decrease in all lipid parameters (Table 7, Figures 6 and 9).
Table 7: Association of Child-Pugh Class with Lipid Profile
|
Lipid Profile (mean ± SD mg/dL) |
Child-Pugh Class A |
Child-Pugh Class B |
Child-Pugh Class C |
p-value |
|
Total Cholesterol |
166.5 ± 37.3 |
137.1 ± 30.5 |
93.5 ± 21.1 |
<0.001 |
|
Triglycerides |
148.4 ± 50.7 |
120.6 ± 47.5 |
113.6 ± 41.2 |
0.05 |
|
LDL |
106.1 ± 23.4 |
89.2 ± 21.07 |
63.4 ± 14.8 |
<0.001 |
|
HDL |
41.5 ± 12.2 |
34.8 ± 9.5 |
24.5 ± 6.5 |
<0.001 |
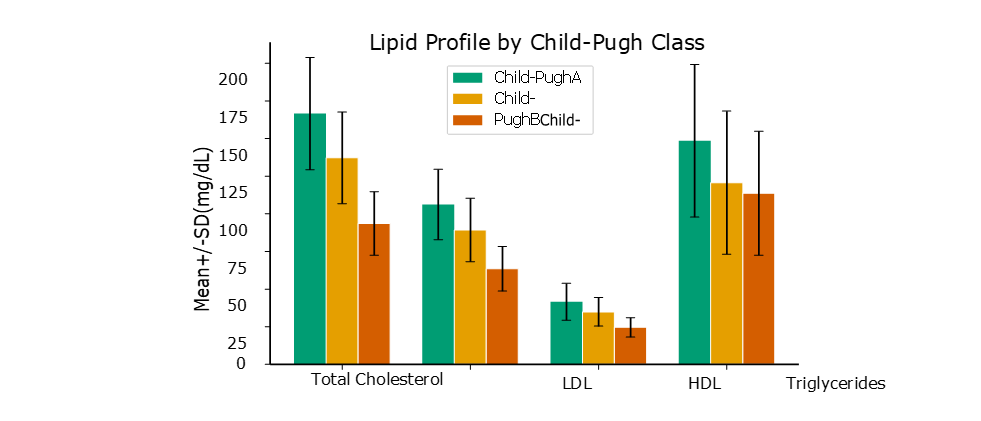
Figure 7: Lipid profile parameters across Child-Pugh classes. Total cholesterol, LDL, and HDL showed significant progressive decreases (p<0.001). Error bars represent standard deviation.
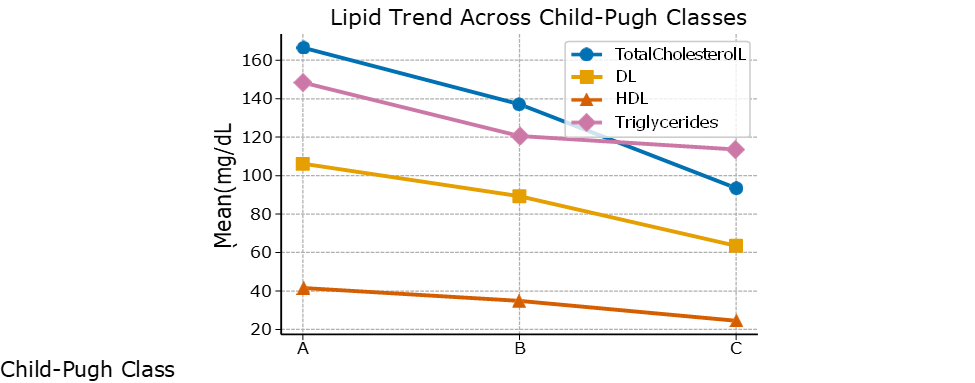
Figure 8: Trend of lipid parameters across Child-Pugh classes showing progressive decline with increasing disease severity.
Association of MELD Scores with Lipid Profile
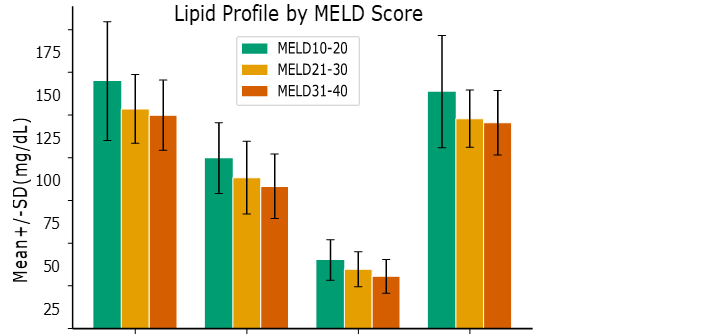
Similar to our findings with Child-Pugh classification, we observed a significant inverse relationship between lipid parameters and MELD scores. As MELD scores increased from 10-20 to 31-40 (indicating worsening prognosis), there was a statistically significant decrease in all lipid parameters (Table 8, Figure 7).
Table 8: Association of MELD Scores with Lipid Profile
|
Lipid Profile (mean ± SD mg/dL) |
MELD Score 10–20 |
MELD Score 21–30 |
MELD Score 31–40 |
p-value |
|
Total Cholesterol |
144.8 ± 34.8 |
128.5 ± 20.2 |
124.8 ± 20.5 |
0.04 |
|
Triglycerides |
138.6 ± 32.9 |
122.8 ± 16.8 |
120.4 ± 18.9 |
0.03 |
|
LDL |
99.7 ± 20.7 |
88.3 ± 21.3 |
83.2 ± 18.9 |
0.04 |
|
HDL |
40.1 ± 11.9 |
34.6 ± 10.2 |
30.5 ± 9.8 |
0.03 |
Total Cholesterol LDL HDL Triglycerides
Figure 9: Lipid profile parameters across MELD score groups showing significant inverse correlations (p=0.03-0.04). Error bars represent standard deviation.
Lipid Profile and Complications of Cirrhosis
Analysis of the association between lipid parameters and specific complications revealed no statistically significant associations (Table 9). Total cholesterol levels were comparable between patients with and without ascites (p=0.93), upper GI bleeding (p=0.47), and spontaneous bacterial peritonitis (p=0.56). Similarly, no significant differences were observed for triglycerides, LDL, or HDL across these complications.
Table 9: Association of Lipid Profile with Complications of Cirrhosis
|
Complication |
Category |
Total Cholesterol (mean ± SD mg/dL) |
LDL (mean ± SD mg/dL) |
p-value |
|
Ascites |
Present (n=55) |
137.7 ± 43.7 |
89.4 ± 22.1 |
0.93 |
|
Absent (n=10) |
138.7 ± 34.04 |
91.2 ± 20.3 |
||
|
Upper GI Bleeding |
Present (n=28) |
133.6 ± 41.3 |
87.1 ± 21.4 |
0.47 |
|
Absent (n=37) |
141.2 ± 42.1 |
91.8 ± 22.6 |
||
|
SBP |
Present (n=18) |
142.7 ± 43.8 |
90.5 ± 21.8 |
0.56 |
|
Absent (n=47) |
136.1 ± 41.1 |
88.9 ± 22.3 |
DISCUSSION:
Cirrhosis represents the final common pathway for a wide variety of chronic liver diseases, characterized by fibrosis and the conversion of normal liver architecture into structurally abnormal nodules. The progression of liver cirrhosis is accompanied by numerous metabolic abnormalities, including significant alterations in lipid metabolism. This study was undertaken to evaluate the relationship between serum lipid profiles and the severity of liver cirrhosis, as assessed by established prognostic models.
Demographic Characteristics
Our study included 65 patients diagnosed with liver cirrhosis. The age distribution revealed that the majority of patients (64.5%) were in the middle-age range of 41-60 years. This age distribution is consistent with findings from several other studies. Bhattacharyya et al.[12] reported a similar age distribution in their study of cirrhotic patients, with a predominant middle-age demographic. Likewise, Ghadir et al.[5] observed that the mean age of cirrhotic patients in their study was 54.2±11.3 years.
Regarding gender distribution, our study showed a marked male predominance, with males comprising 78.4% of the study population. This male preponderance in cirrhosis has been consistently reported across multiple studies. D’Amico et al.[13] found that males constituted approximately 70% of cirrhotic patients. Mokdad et al.[14] reported that the global burden of cirrhosis is significantly higher in men than in women, with an age-standardized mortality rate approximately 2-fold higher in males. This gender disparity may be attributed to various factors, including higher alcohol consumption among men, differential effects of sex hormones on liver fibrogenesis, and possibly higher prevalence of viral hepatitis in males.
Lipid Profile Abnormalities in Cirrhotic Patients
Our study demonstrated significant abnormalities in the lipid profiles of cirrhotic patients. The majority of patients had reduced total cholesterol levels (90.8%), reduced HDL (90.8%), and reduced LDL (67.7%). These findings align with previous investigations on lipid abnormalities in liver cirrhosis. Chrostek et al.[6] demonstrated that patients with alcoholic cirrhosis had significantly lower total cholesterol, HDL, and LDL levels compared to healthy controls. Similarly, Bassani et al.[9] reported that cirrhotic patients had progressively decreasing levels of total cholesterol, HDL, and LDL as the severity of cirrhosis increased. The pathophysiological basis for these lipid abnormalities in cirrhosis is multifactorial. The liver plays a central role in lipid metabolism, being responsible for the synthesis and secretion of lipoproteins. As hepatic function deteriorates in cirrhosis, there is a reduction in the synthesis of apolipoproteins and lipoproteins, leading to decreased levels of circulating lipids [5]. Moreover, malnutrition, which is common in advanced cirrhosis, further contributes to reduced lipid levels. Additionally, increased levels of pro-inflammatory cytokines in cirrhosis may enhance lipid peroxidation and alter lipoprotein metabolism [10].
Association of Lipid Profile with Child-Pugh Class
One of the most significant findings of our study was the strong inverse relationship between lipid parameters and Child-Pugh class. We observed that as the Child-Pugh class progressed from A to C, there was a statistically significant decrease in all lipid parameters, with total cholesterol decreasing from
166.5±37.3 mg/dL to 93.5±21.1 mg/dL (p<0.001), LDL from 106.1±23.4 mg/dL to 63.4±14.8 mg/dL (p<0.001), and HDL from 41.5±12.2 mg/dL to 24.5±6.5 mg/dL (p<0.001).
These findings are concordant with reports by Abbasi et al.[15], who found a significant negative correlation between Child-Pugh score and serum cholesterol levels in cirrhotic patients due to viral hepatitis. Similarly, Ghadir et al.[5] reported a significant decrease in total cholesterol, LDL, and HDL with increasing Child-Pugh class.
The progressive decline in lipid parameters with increasing Child-Pugh class can be attributed to the worsening synthetic function of the liver. Child-Pugh class C represents advanced liver disease with severely compromised hepatic function, leading to markedly reduced synthesis of lipoproteins [1]. Interestingly, Trieb et al.[16] proposed that low HDL levels in particular might contribute to disease progression in cirrhosis, rather than merely being a consequence of advanced disease. They suggested that HDL has anti-inflammatory and antioxidant properties, and its reduction may promote inflammation and oxidative stress, which are key drivers of hepatic fibrogenesis.
Association of Lipid Profile with MELD Scores
Similar to our findings with Child-Pugh classification, we observed a significant inverse relationship between lipid parameters and MELD scores. Total cholesterol decreased from 144.8±34.8 mg/dL in the 10-20 MELD score group to 124.8±20.5 mg/dL in the 31-40 group (p=0.04), and HDL decreased from 40.1±11.9 mg/dL to 30.5±9.8 mg/dL (p=0.03).
These findings are consistent with those reported by Jiang et al.[4] in their study of 110 patients with hepatitis B virus-related cirrhosis, where they found a significant negative correlation between MELD scores and total cholesterol, LDL, and HDL levels. Notably, while both Child-Pugh classification and MELD scores showed significant associations with lipid parameters, the statistical significance was stronger for Child-Pugh classification (p<0.001 for most parameters) compared to MELD scores (p=0.03-0.04). This difference might be attributed to the fact that Child-Pugh classification includes clinical parameters such as ascites and encephalopathy, which might have a more direct impact on nutritional status and consequently on lipid metabolism.
Lipid Profile and Complications of Cirrhosis
In our study, we did not find statistically significant associations between lipid parameters and specific complications of cirrhosis, including ascites, hepatic encephalopathy, upper gastrointestinal bleeding, and spontaneous bacterial peritonitis. This finding contrasts with some previous studies. Chrostek et al.[6] found that patients with ascites had significantly lower total cholesterol and HDL levels compared to those without ascites. However, our findings are consistent with Bassani et al.[9], who did not find a significant association between lipid parameters and the presence of esophageal varices or variceal bleeding.
The lack of significant association between lipid parameters and complications in our study might be due to several factors. First, our relatively small sample size (n=65) might have limited the statistical power to detect differences, particularly in subgroup analyses. Second, confounding factors such as medication use (diuretics, beta-blockers) and dietary factors might not have been fully accounted for. Third, the pathophysiology of complications like variceal bleeding is primarily related to portal hypertension and local vascular factors, rather than to metabolic abnormalities such as dyslipidemia.
Clinical Implications
Our findings suggest that serum lipid profiles, particularly total cholesterol, LDL-cholesterol, and HDL- cholesterol, could serve as additional biochemical markers for assessing the severity of hepatic dysfunction in cirrhosis. These parameters are routinely measured, cost-effective, and easily obtainable in clinical practice. Incorporating lipid profile assessment into the routine evaluation of cirrhotic patients could provide complementary information to established scoring systems. However, lipid profiles may not be reliable predictors of specific complications of cirrhosis, and their role in prognostication appears to be more reflective of overall hepatic synthetic function rather than complication-specific risk.
Limitations
This study has several limitations. First, the cross-sectional design precludes assessment of causality or temporal relationships between lipid alterations and disease progression. Second, the relatively small sample size (n=65) limits statistical power, particularly for subgroup analyses. Third, the single-center nature of the study may limit generalizability to other populations. Fourth, the absence of a healthy control group prevents comparison of lipid profiles between cirrhotic patients and the general population. Fifth, the etiology of cirrhosis (alcohol, viral, NAFLD) was not analyzed separately, which could influence lipid profiles differentially. Future prospective, multi-center studies with larger sample sizes and inclusion of a control group are warranted to validate these findings and establish specific cutoff values for lipid parameters in predicting cirrhosis severity.
Acknowledgments
The authors thank the Department of General Medicine, The Oxford Medical College Hospital and Research Centre, Bangalore, for supporting this research. We are grateful to all the patients who participated in this study.
CONCLUSION:
This study investigated the relationship between serum lipid profiles and the severity of liver cirrhosis in 65 patients. Our findings demonstrate that serum lipid parameters, particularly total cholesterol, LDL-cholesterol, and HDL-cholesterol, show significant inverse correlations with established prognostic indicators of cirrhosis severity, namely Child-Pugh classification and MELD scores. As liver function deteriorates, reflected by progression from Child-Pugh class A to C and increasing MELD scores, there is a corresponding decline in lipid parameters, indicating that lipid profiles may serve as biochemical markers for assessing the severity of hepatic dysfunction in cirrhosis.
The significant decline in total cholesterol (from 166.5 to 93.5 mg/dL), LDL (from 106.1 to 63.4 mg/dL), and HDL (from 41.5 to 24.5 mg/dL) across Child-Pugh classes A to C demonstrates the progressive nature of metabolic derangement in advancing cirrhosis. These routinely measured, cost-effective parameters could potentially complement established scoring systems in the evaluation of disease severity. However, lipid profiles may not be reliable predictors of specific complications of cirrhosis. Future research with larger sample sizes and longitudinal follow-up is needed to establish specific cutoff values and to evaluate the prognostic utility of incorporating lipid parameters into existing clinical scoring systems.
REFERENCES:
1. Tsochatzis EA, Bosch J, Burroughs AK. Liver cirrhosis. Lancet. 2014;383(9930):1749-1761.
2. Scaglione S, Kliethermes S, Cao G, et al. The epidemiology of cirrhosis in the United States: a population-based study. J Clin Gastroenterol. 2015;49(8):690-696.
3. Schuppan D, Afdhal NH. Liver cirrhosis. Lancet. 2008;371(9615):838-851.
4. Jiang ZG, Robson SC, Yao Z. Lipoprotein metabolism in nonalcoholic fatty liver disease. J Biomed Res. 2013;27(1):1-13.
5. Ghadir MR, Riahin AA, Havaspour A, Nooranipour M, Habibinejad AA. The relationship between lipid profile and severity of liver damage in cirrhotic patients. Hepat Mon. 2010;10(4):285-288.
6. Chrostek L, Supronowicz L, Panasiuk A, Cylwik B, Gruszewska E, Flisiak R. The effect of the severity of liver cirrhosis on the level of lipids and lipoproteins. Clin Exp Med. 2014;14(4):417-421.