Correlation of asthma control test with Spirometry in the assessment of asthma control in children.
- . Anjanmurthy , Department of Paediatrics, Bangalore Medical College and Research Institute, Fort Road, Bengaluru-56001.
- Tejaswini , Department of Paediatrics, Bangalore Medical College and Research Institute, Fort Road, Bengaluru-56001.
- Shivakumar R , Department of Paediatrics, Bangalore Medical College and Research Institute, Fort Road, Bengaluru-56001.
- Sanajana M Rao , Department of Paediatrics, Bangalore Medical College and Research Institute, Fort Road, Bengaluru-56001.
- Basavarajaiah DM , Department of Paediatrics, Bangalore Medical College and Research Institute, Fort Road, Bengaluru-56001.
Article Information:
Abstract:
Background: Asthma is a chronic inflammatory disorder of the airways characterized by bronchial hyper-responsiveness, reversible airway obstruction, and variable airflow limitation. It is one of the most common chronic diseases worldwide, affecting nearly 300 million people globally, with an expected increase in prevalence in the coming years. Asthma contributes significantly to health and economic burdens. Assessment of asthma control is essential for effective management, and tools such as the Asthma Control Test (ACT) and pulmonary function tests are commonly used. Objectives: To evaluate the correlation between the Asthma Control Test (ACT) score and pulmonary function test parameters in patients with bronchial asthma and to determine the usefulness of ACT as an alternative assessment tool in resource-limited settings. Materials and Methods: This observational study was conducted after obtaining institutional ethics committee approval and informed consent from participants. Fifty patients fulfilling the inclusion criteria were enrolled. A detailed history regarding asthma symptoms during the previous four weeks, medication usage, exacerbations, comorbidities, past and family history, immunization status, socioeconomic status, and anthropometric measurements was collected. Clinical examination, chest circumference, and chest expansion assessments were performed. Participants completed the ACT questionnaire, which consisted of pretested questions scored from 1 to 5. A total ACT score of 25 indicated well-controlled asthma, scores of 20–24 indicated good control, and scores below 20 indicated poorly controlled asthma. Spirometry using a portable spirometer was performed, and pulmonary function test parameters including forced expiratory volume in one second (FEV1), FEV1/FVC ratio, and peak expiratory flow rate (PEFR) were recorded and compared with ACT scores. Results: Among the 50 study participants, 29 were females and 21 were males. Based on ACT scores, 23 patients (46%) had well-controlled asthma, while 27 patients (54%) had poorly controlled asthma. The poorly controlled group demonstrated lower pulmonary function values. Mean FEV1 ranged from 75.82 ± 13.31 to 95.47 ± 13.91, FEV1/FVC ratio ranged from 71.41 ± 9.87 to 93.47 ± 8.42, and PEFR ranged from 71.07 ± 13.50 to 93.08 ± 15.88. A statistically significant positive correlation was observed between ACT scores and FEV1 (% predicted) with a Pearson correlation coefficient showing p = 0.001. Conclusion: A significant proportion of patients had poorly controlled asthma. The ACT score showed a good positive correlation with pulmonary function test variables, indicating its usefulness in assessing airway obstruction and symptom severity. The ACT can serve as a practical alternative to pulmonary function testing, particularly in resource-limited settings.
Keywords:
Article :
INTRODUCTION:
Asthma is chronic inflammatory disease of airways characterized by bronchial hyper responsiveness and reversible airway obstruction, which is characterized by intermittent variable airflow obstruction, airway inflammation and bronchial hyperresponsiveness1 [1-3].It, is one of the most common chronic disease in the world [1-4]. An estimated 300 million people worldwide suffer from asthma with an expected increase by another 100 million by the year 2025 [6] . It poses detrimental health and economic burden. Respiratory symptoms associated with asthma include wheezing, chest tightness, shortness of breath, and coughing [8]. These symptoms can change over time, both in frequency and severity [9].
Variable expiratory airflow limitation, or difficulty breathing air out of the lungs due to bronchoconstriction (airway narrowing), thickening of the airway wall, and increased mucus, is linked to these symptoms [10-11]. Even those without asthma can experience some variation in airflow, but untreated asthma sufferers experience more of it [12]. There are various phenotypes, or forms of asthma, as well as various underlying disease processes [13-14]. Viral infections, cigarette smoke, allergens at work or home (such as house dust mites, pollens, and cockroaches), exercise, and stress are some of the things that can cause or exacerbate asthma symptoms. When asthma is not under control, these reactions are more common [15]. Additionally, certain medications, such as beta-blockers, and (in certain cases) aspirin or other nonsteroidal anti-inflammatory drugs (NSAIDs) can cause asthma or cause its symptoms [16-17]. Even in individuals with asthma that appears to be mild, asthma flare-ups, also known as exacerbations or attacks, can be fatal. In certain high-risk patients as well as in cases of uncontrolled asthma, they are more frequent and severe.
Every patient should have a written asthma action plan; written refers to instructions that are not only spoken but can also be printed, digital, handwritten, or illustrated. Asthma control test (ACT) is a quick test for people with asthma 12 years and older, provides a numerical score to help assess asthma control.] Which is five questionquestionnaire with 1 to 5 points to each, questions will be explained to the patients. Developed by Natan and his collegues in 2004 Score of 25 points indicates complete control, 20-24: good control, less than 20–poor control. It has been demonstrated that the Asthma Control Test (ACT) possesses valid internal consistency and responsiveness. It is an easy-to-integrate instrument that is rapid, easy to use, and accurate for evaluating asthma management in people with asthma.Spirometry:In general, pulmonary function tests primarily spirometry (FEV1) are regarded as the gold standard for objectively evaluating and re-evaluating childhood asthma. For the assessment of the severity and management of asthma, national and international guidelines recommend an initial evaluation followed by periodic re-evaluations. Regular re-evaluations assess the response to therapy based on the degree of control, whereas the first assessment directs therapy based on the severity.
Guidelines recommend a number of outcome measures for the initial evaluation and the regular re-evaluations. Pulmonary function tests, mainly spirometry, are generally considered the standard tools for objective evaluation and re-evaluation The initial assessment of asthma as stated by guidelines, with FEV1 being the only objective measure, serves to evaluate the severity of the disease. Children with mild persistent asthma have FEV1 values of more than 80% of predicted, children with moderate persistent asthma have values of (60–80%) of predicted, and children with severe persistent asthma have values of less than (60%) of predicted. In this study asthma control test is used to assess asthma control and findings will be correlated with spirometric analysis to evaluate the validity and reliability of asthma control test as short , simple, patient based tool for identifying patients with poorly controlled asthma and to assess how it relates to lung function parameters. As spirometry is not feasible especially in the rural Indian settings, this study is aimed to know that, can ACT replace spirometry for deciding treatment changes. But there is paucity of data regarding the correlation of ACT scores with functional and biological parameters from India. This study will be helpful to correlate ACT scores with spirometry in assessment of asthma control. To correlate the results of asthma control test with spirometry in the assessment of asthma control in children. The two most prevalent long-term asthma symptoms are intermittent dry coughing and expiratory wheezing. Younger children are more likely to experience intermittent, nonfocal chest discomfort, whereas older children and adults report related shortness of breath, chest congestion, and tightness. Sleep-related respiratory symptoms can sometimes worsen at night, particularly during extended flare-ups brought on by respiratory infections or allergens inhaled [11] .Nonspecific. Inquiring about prior use of bronchodilators, or asthma medications, may yield a history of symptomatic relief with treatment, supporting the diagnosis of asthma [12]
Bronchodilator and corticosteroid therapy failure to produce improvement is not consistent with underlying asthma and should lead to a more thorough evaluation of conditions that mimic asthma. Auscultation is usually useful in identifying expiratory wheezing and a prolonged exhalation phase. Reduced breath sounds in certain lung fields, most often the lower right posterior lung field, are indicative of a localized hypoventilation brought on by blockage of the airways. Occasionally, rhonchi and crackles (also known as rales) can be heard, which are caused by the airway's inflammatory exudate and excessive mucus production 13 segmental crackles and poor breath sounds together may be signs of lung segmentalatelectasis, which can make it more difficult to treat acute asthma attacks and be difficult to differentiate from bronchial pneumonia.14
The greater degree of airway obstruction in severe flare-ups results in respiratory distress and labored breathing, which can be characterized by nasal flaring, increased prolongation of exhalation, poor air entry, suprasternal and intercostal retractions, and inspiratory and expiratorywheezing.15 Extremis may have so little airflow that a person's wheezing is undetectable (silent chest).The majority of reports of daytime symptoms, which are frequently associated with play or physical activity (exercise-induced), come from youngsters. Some children's asthma symptoms, such as self-imposed physical limitations, can be mild and Uruj Hoda et al,from department of allergy, Guys and St Thomas Hospital, London, United Kingdom, conducted prospective observational study in 2014,which included review of serial visits to Asthma outpatient clinic ,all subjects more than 12 years, completed Asthma control test and performed spirometry on the same day. Clinician made their assessment of patient’s asthma control and made appropriate treatment decisions. Results of the study showed that (88.4%) were classified as controlled asthma by asthma control test but in this group, only 53.70% of patients were classified as controlled asthma by spirometry. ACT score of less than 20 had a strong correlation with physician assessment of asthma control and correlated better with treatment decisions than did the severity of asthma as definied by FEV1.There by indicating that asthma control test ,can serve as useful tool in the assessment and management of asthma. Francisco Javier Alvarez-Gutierrez et al., conducted multicentre prospective observational study, in (n = 441) outpatient followed in an outpatient chest clinic, asthma control test, FeNO, spirometry performed , difference between the functional parameters and FeNO were observed .results of study showed that, for controlled asthma the cut off obtained was ACT more than or equal to 21 and for uncontrolled less than 18.but only 26.3% of patients with ACT less than `18 had FEV1 <80%.cut off for controlled asthma -21 or more, uncontrolled asthma ACT less than 18. A more complete assessment would require including monitoring parameters and FeNO3.Nithesh Gupta et al., from Vardhman Mahavir medical college and safdarjung hospital, conducted study on asthma control test and its correlation with spirometry and inflammatory markers in asthma patient at a tertiary care centre in India which was a Prospective observational study in 75 patients more than 12 years with asthma.
Which included description of various demographic factor [age, sex, BMI],spirometry and inflammatory markers hours CRP,FeNO,IL10,IL 6, IL [3] at first visit and after four weeks, which proposes documentation of FeNO,FEV1/FVC and TIgE levels and combined approach of ACT, spirometry variables and inflammatory markers for documenting the precise control of asthma. Mrinal A. Raikar et al. ,conducted study of assessment of asthma control using ACT and spirometry, over period of 2 years in the department of respiratory medicine, tertiary care centre, teaching hospital, GOA .it was cross sectional analyticalstudy in (n=66) patient more than 12 years with asthma, which included ACT and spirometry findings. which showed that asthma is poorly controlled among 68% of the study subject. It also showed that functional parameters correlate poorly with ACT scores. Shobhianandi et al, Department of paediatrics Seth G S Medical college and KEM Hospital Mumbai, conducted prospective observational study ,among (n=37) children between 6-12 years of age, over period of one year with signs and symptoms suggestive of asthma [newly diagnosed]and who were able to perform spirometry were followed up for period of 6 months which showed 27 patient belonged to mild persistent type,5 were moderate persistent type of asthma significant improvement in the symptom score was evident at 6 weeks of therapy FEV1 and FVC showed improvement at 3 months.
PEFR was found to show improvement by 6 months, lung parameters also showed significant improvement. Iwona Florentyna Grzelewska-Rzymowska et al., conducted study with a total of 118 asthma patients, 84 women and 34 men, with a mean (± SD) age of 44 ± 15 years (range 18−75 years) participated in this study. The subjects were recruited from the Medical University Out-patient Asthma conducted study in According to the ACT, 56% of patients (66/118) were uncontrolled. The similar proportion of females and males with ACT score between 5 and 19 was seen and it was 55% (46/84) and 59% (20/34) respectively. Asthma was considered well-controlled in 36% (21/59) of subjects. Only 8% (10/118) of all participants reported total control during the last 4 weeks. Further analyses were performed considering two populations: controlled (ACT score ≥ 20) and uncontrolled (ACT score < 20). Of the patients with controlled asthma (N = 26) the geometric mean value of PC20 was 2.72 mg/ml and only 0.94 mg/ml in patients with uncontrolled asthma (N = 33) (Table 1). The mean geometric values of PC20M in controlled and uncontrolled patients were significant different (p = 0.02). Half of the patients with an ACT score ≥ 20 points had moderate or severe BHR with PC20M ≤ 1 mg/ml (Table 1). Although there was a tendency towards a relationship between the fifth response on each question in the ACT and the PC20M, a significant correlation was found only regarding the second (R = 0.498; p < 0.001) and fourth questions (R = 0.27; p < 0.05). A higher response option to questions 2 and 4 was correlated with a higher mean value of PC20M (Fig. 1). The estimation of dependence between FEV1 values and ACT scores revealed that patients with an ACT score less or equal to 19 points had a significantly lower mean FEV1 (85.7% ± 18%) compared to those with total and well-controlled asthma (96.1% pred. value ± 13.6%), (p = 0.017).
At the same time, despite the significantly lower frequency of FEV1 value over 100% of predicted, almost 64% (21/33) of uncontrolled asthmatics achieved normal lung function (FEV1 > 80%). Ming-Sheng Lee a et al., examined correlations between the two asthma assessment tools, pulmonary function tests, and Childhood Asthma Control Test (C-ACT) scores, in 5e11-year-old children with asthma to determine if the C-ACT scores could predict pulmonary function test results. Materials and methods: A total of 172 children with asthma aged 5e11 years completed C-ACT questionnaires and underwent pulmonary function testing. Correlations between these test results were examined. Patients were also placed into two groups, C-ACT scores 19 and >19, to determine if patients with scores >19 had better pulmonary function test results. Results: Weak correlations were found between pulmonary function test results and childhood asthma control test scores in 5e11-year-old children with asthma, with or without the use of an asthma controller. These correlations included: 0.061 for FEV1 [confidence interval (CI):0.022e0.049] and 0.074 for MMEF (CI: 0.013e0.037). The proportions of children with C-ACT test scores 19 group and those with scores >19 group were not significantly different.
Correlations between C-ACT scores and pulmonary function test results were poor for children aged 5e11 years with asthma. FEV1, FVC, FEF25, FEF50, FEF75, MMEF, and PEFR were not significantly correlated with C-ACT scores. Mohammed Noufal Poongadan1 et al., conducted study in Department of Respiratory Allergy and Applied Immunology, Vallabhbhai Patel Chest Institute1, University of Delhi and Department of Pulmonary Medicine, Lady Hardinge Medical College and SSK Hospital2, Delhi, study group consists of seventy-five patients with bronchial asthma underwent baseline spirometry, fractional exhaled nitric oxide (FeNO), serum total immunoglobulin E (TIgE), high-sensitivity C-reactive protein (hs-CRP) and interleukin (IL)-6, IL-10 and IL-13 measurements. After four weeks, patients were followed up with the same set of investigations. ACT questionnaire was completed without any directions, showed that, Of 75 patients, bronchial asthma was controlled poorly in 18, well in 35 and totally controlled in 22. The forced expiratory volume in one second (FEV1) at the second visit was lowest in the poorly control group. This researchpaper aimsto Correlate asthma control test with spirometry in the assessment of asthma control in children.
MATERIALS AND METHODS:
A Cross sectional analytical study was conducted at Inpatientsof Paediatric Dept., Vanivilas Hospital, BMCRI & ,Bowring and Lady Curzon Hospital with study period ofAugust 2022 to January 2024 . A total (n=50) (Mohammed Noufal Poongadan et al, 2018) samples of Asthma children was considered forthe following inclusion and exclusion criteria
Inclusion Criteria: children age between 12-17 years, willing to give informed consent ,diagnosed cases of bronchial asthma as per GINA guidelines, definition from Nelson textbook of Paediatrics. Bronchial asthma associated with allergic rhinitis, atopy,diabetes and hypertension. Exclusion Criteria; Child with chronic inflammatory lung disease, Children less than 12 years with skeletal deformity.
Data collection
Upon receiving approval and clearance from the institutional ethics committee, patients who meet the inclusion criteria will be enrolled in the study after providing informed consent. A written assent form will be required for children aged 12 to 18. The case record form will include a follow-up chart and study groups for those aged 12 to 17 years. The methodology for data collection during the study involves administering the Asthma Control Test (ACT), which consists of a five-question questionnaire, with each question rated from 1 to 5 points, and this will be explained to the patients. A total score of 25 points signifies complete control, a score between 20 and 24 indicates good control, while a score below 20 reflects poor control. Spirometry will be conducted using a portable spirometer, and the results from both assessments will be correlated. The assessment tools utilized include the questionnaires for the Asthma Control Test and spirometry.
Statistical analysis
The Statistical Package for Social Sciences (SPSS) for Windows Version 22.0, released in 2013 by IBM Corp. in Armonk, NY, will be utilized for conducting statistical analyses. Descriptive analysis of all explanatory and outcome parameters will be performed using mean and standard deviation for quantitative variables, as well as frequency and proportions for categorical variables. The Chi Square Test will be employed to compare the proportions of nominal data across three ACT groups. To compare the mean values of Spirometry and other inflammatory markers among the three ACT groups, either a one-way ANOVA test followed by Tukey’s post hoc test or a Kruskal Wallis Test followed by Mann Whitney Post hoc test will be applied. Spearman’s correlation test will be utilized to assess the relationship between Spirometry, inflammatory markers, and ACT scores in asthma patients. Additionally, stepwise multiple linear regression analysis will be conducted to identify the independent variables that influence ACT scores.
RESULTS:
The total number of children involved in the study was 50, with an average age of 14.34 years and a standard deviation of 1.84 years, along with an Interquartile range of 11-18 years.
The study comprised 29 females (58%) and 21 males (42%).The age at diagnosis is categorized into three groups: 1-5 years, 6-10 years, and 11-15 years. There are 6 children diagnosed within the 1-5 years age range (12%), while those diagnosed between 6-10 years account for 78%, and those in the 11-15 years category represent 10%. Economic status was recorded according to the findings, with lower (65%), middle (18%), and upper middle (17%) classifications.The immunization status of participants is divided into two categories: incomplete, with 8 participants (16%), and complete and incomplete, comprising 42 participants (84%). Out of 50 cases, 9 participants (18%) had a family history of the condition, while 16 participants (32%) exhibited allergies.
The results from the head-to-toe examination of participants categorized their findings into various conditions and normal status. Allergic shiners were noted in 2 participants (4%). Eczema was observed in only 1 participant (2%), and pallor accounted for 2% of the sample. The data indicates that a significant majority of participants (68%) do not have any comorbidities. Thinness affecting 10% of the children. Sinusitis ranks as the second most common co morbidity, affecting 6% of the children. Other comorbidities, such as allergic rhinosinusitis, eczema, food allergy, obesity, and rhinitis, are relatively less common, impacting between 2% and 4% of participants respectively.
Table 1: BMI, Chest circumference, Chest expansion
|
Anthropometry |
Minimum |
Maximum |
Mean |
Standard deviation |
|
BMI |
13.40 |
26.60 |
20.11 |
2.95 |
|
Chest circumference |
56.0 |
80.0 |
69.06 |
5.77 |
|
Chest expansion |
1.0 |
4.0 |
2.45 |
0.61 |
Table 1 presents the anthropometric measurements of the participants, including Body Mass Index (BMI), chest circumference, and chest expansion. The BMI of participants ranges from a minimum of 13.40 to a maximum of 26.60. The mean BMI is 20.11, and the standard deviation for BMI is 2.95. The chest circumference ranges from a minimum of 56.0 cm to a maximum of 80.0 cm.The mean chest circumference is 69.06 cm, and the standard deviation for chest circumference is 5.77 cm. Chest expansion ranges from a minimum of 1.0 cm to a maximum of 4.0 cm. The mean chest expansion is 2.45 cm. The standard deviation for chest expansion is 0.61 cm.
Table 2: Distribution of Vitals
|
Vitals |
Minimum |
Maximum |
Mean |
Standard deviation |
|
Temperature |
96.60 |
98.20 |
97.46 |
0.37 |
|
Heart rate |
62.00 |
96.00 |
77.84 |
9.59 |
|
Respiratory rate |
16.00 |
36.00 |
24.94 |
5.67 |
|
Systolic blood pressure |
80 |
144 |
106.00 |
13.46 |
|
Diastolic blood pressure |
40 |
82 |
62.04 |
7.94 |
Table 2 displays the essential statistics of the participants, which include temperature, heart rate, respiratory rate, and blood pressure. The temperature among participants varies from a low of 96.60°F to a high of 98.20°F. The average temperature is recorded at 97.46°F, with a standard deviation of 0.37°F. The heart rate is observed to range from a minimum of 62 beats per minute to a maximum of 96 beats per minute. The mean heart rate stands at 77.84 beats per minute, accompanied by a standard deviation of 9.59 beats per minute.
The respiratory rate is noted to vary from a minimum of 16 to a maximum of 36 breaths per minute. The average respiratory rate is calculated at 24.94 breaths per minute, with a standard deviation of 5.67 breaths per minute. Systolic blood pressure is recorded to range from a minimum of 80 mmHg to a maximum of 144 mmHg, with an average systolic blood pressure of 106.00 mmHg and a standard deviation of 13.46 mmHg. Diastolic blood pressure ranges from a minimum of 40 mmHg to a maximum of 82 mmHg, with the mean diastolic blood pressure being 62.04 mmHg and a standard deviation of 7.94 mmHg. Table 12 summarizes the results from evaluations of the respiratory system, cardiovascular system (CVS), physical assessment (PA), and central nervous system (CNS).
Respiratory System:
Normal: 38 participants, or 76% of the sample, have normal respiratory findings.
Ronchi: Observed in 2 participants, accounting for 4% of the sample.
Wheeze: Observed in 8 participants, representing 16% of the sample.
Decreased Air Entry (AE): Observed in 1 participant, making up 2% of the sample.
Conducted Sounds: Observed in 1 participant, also 2% of the sample.
Cardiovascular System (CVS):
Normal: All 50 participants, or 100% of the sample, have normal findings.
Physical Assessment (PA):
Normal: All 50 participants, or 100% of the sample, are assessed as normal.
Central Nervous System (CNS):
Normal: All 50 participants, or 100% of the sample, have normal findings.
Table 13 presents the results of pulmonary function tests, including FEV1 (Forced Expiratory Volume in 1 second), FEV1/FVC (Forced Expiratory Volume in 1 second to Forced Vital Capacity ratio), and PEFR (Peak Expiratory Flow Rate).
FEV1 (Forced Expiratory Volume in 1 Second):The FEV1 values range from 56.00 to a maximum of 109.00.The mean FEV1 is 84.86, and the standard deviation is 16.70.
FEV1/FVC (Ratio of Forced Expiratory Volume in 1 Second to Forced Vital Capacity):The FEV1/FVC ratio ranges from 59.00 to a maximum of 107.00.The mean FEV1/FVC ratio is 84.80, and the standard deviation for FEV1/FVC is 12.21.
PEFR (Peak Expiratory Flow Rate):The PEFR values range from a minimum of 56.00 to a maximum of 123.00.The mean PEFR is 81.20, and the standard deviation for PEFR is 18.25.
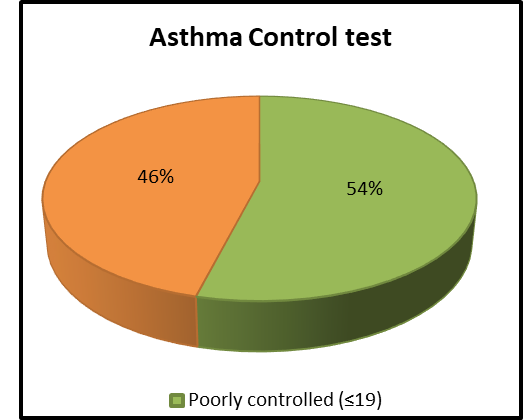
Fig 1 :Pie chartshowing asthma control test status
Figure 1 illustrates the findings of the Asthma Control Test (ACT), classifying participants according to their degree of asthma management. Poorly Controlled (ACT ≤19): 27 participants, representing 54% of the sample, are categorized here, signifying that over half of the participants experience poorly controlled asthma. Well-Controlled (ACT 20-24): 23 participants, accounting for 46% of the sample, fall into this category, indicating that almost half have well-managed asthma. The average ACT score is 18.66, with a standard deviation of 3.08. ACT scores vary from a low of 12 to a high of 24.
Table 3: Comparison of ACT values based on different variables
|
|
Mean |
SD |
t/F value |
P value |
|
|
Age |
|
|
|
|
|
|
≤14 (n=27) |
18.07 |
3.23 |
0.374 |
0.147 |
|
|
>14 (n=23) |
19.38 |
2.80 |
|||
|
Sex |
|
|
|
|
|
|
Male (n=21) |
18.33 |
2.97 |
-0.634 |
0.529 |
|
|
Female (n=29) |
18.89 |
3.18 |
|||
|
BMI |
|
|
|
|
|
|
<18 (n=11) |
16.63 |
3.07 |
4.664 |
0.014* |
|
|
18-25 (n=36) |
19.03 |
2.83 |
|||
|
>25 (n=3) |
21.67 |
2.51 |
|||
|
SES |
|
|
|
|
|
|
Lower (n=28) |
18.50 |
2.67 |
0.530 |
0.592 |
|
|
Middle (n=13) |
19.38 |
3.75 |
|||
|
Upper (n=9) |
18.11 |
3.40 |
|||
|
Immunization |
|
|
|
|
|
|
Incomplete (n=8) |
19.75 |
3.19 |
1.094 |
0.279 |
|
|
Complete (n=42) |
18.45 |
3.05 |
|||
|
Comorbidities |
|
|
|
|
|
|
Present (n=16) |
18.75 |
3.11 |
0.140 |
0.886 |
|
|
Absent (n=34) |
18.62 |
3.11 |
|
||
*statistically significant (p<0.05)
The average ACT score for individuals aged 14 or younger is 18.07 (SD = 3.23). The average ACT score for those older than 14 is 19.38 (SD = 2.80). The t-value is 0.374 with a p-value of 0.147, suggesting that there is no statistically significant difference in ACT scores based on age.
The average ACT score for males is 18.33 (SD = 2.97), while for females, it is 18.89 (SD = 3.18). The t-value is -0.634, with a p-value of 0.529, indicating that there is no statistically significant difference in ACT scores based on sex.
The average ACT score for individuals with a BMI of less than 18 is 16.63 (SD = 3.07). The average ACT score for individuals with a BMI between 18 and 25 is 19.03 (SD = 2.83). The average ACT score for individuals with a BMI greater than 25 is 21.67 (SD = 2.51). The F-value is 4.664, with a p-value of 0.014, indicating a statistically significant difference in ACT scores based on BMI.
The average ACT score for individuals with a lower socioeconomic status (SES) is 18.50 (SD = 2.67). The average ACT score for individuals with a middle SES is 19.38 (SD = 3.75). The average ACT score for individuals with an upper SES is 18.11 (SD = 3.40). The F-value is 0.530 with a p-value of 0.592, indicating no statistically significant difference in ACT scores based on SES.The average ACT score for individuals with incomplete immunization is 19.75 (SD = 3.19), whereas for those with complete immunization, it is 18.45 (SD = 3.05). The t-value is 1.094, and the p-value is 0.279, indicating no statistically significant difference in ACT scores based on immunization status.The average ACT score for individuals with comorbidities is 18.75 (SD = 3.11), while for those without comorbidities, it is 18.62 (SD = 3.11). The t-value is 0.140, and the p-value is 0.886, indicating no statistically significant difference in ACT scores based on comorbidities. In conclusion, BMI is the only variable analyzed that demonstrates a statistically significant difference in ACT scores, with individuals in the BMI category of less than 18 exhibiting significantly lower ACT scores compared to those in higher BMI categories.
Table 4: Comparison of variables based on ACT values
|
Variables |
Poorly controlled |
Well-controlled |
t value |
P value |
|
FEV1 |
75.82±13.31 |
95.47±13.91 |
-5.10 |
0.001* |
|
FEV1/FVC |
77.41±9.87 |
93.47±8.42 |
-6.13 |
0.001* |
|
PEFR |
71.07±13.50 |
93.08±15.88 |
-5.29 |
0.001* |
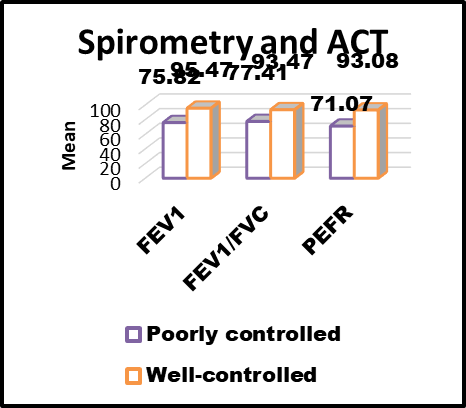
Fig 16: Comparison of variables based on ACT values
A comparative examination of various pulmonary function metrics between patients with poor control and those with good control. The specific metrics evaluated include FEV1 (Forced Expiratory Volume in one second), the FEV1/FVC ratio (Forced Vital Capacity), and PEFR (Peak Expiratory Flow Rate).
FEV1:
Poorly controlled: Mean ± SD = 75.82 ± 13.31,
Well-controlled: Mean ± SD = 95.47 ± 13.91. The t-value is -5.10 with a p-value of 0.001, indicating a statistically significant difference between the two groups. Patients with well-controlled conditions demonstrate significantly higher FEV1 values in comparison to those with poorly controlled conditions.
FEV1/FVC:
Poorly controlled: Mean ± SD = 77.41 ± 9.87,
Well-controlled: Mean ± SD = 93.47 ± 8.42. The t-value is -6.13, with a p-value of 0.001, indicating a statistically significant difference. Patients with well-controlled conditions possess a significantly higher FEV1/FVC ratio than those with poorly controlled conditions.
PEFR:
Poorly controlled: Mean ± SD = 71.07 ± 13.50,Well-controlled: Mean ± SD = 93.08 ± 15.88. The t-value is -5.29, with a p-value of 0.001, indicating a statistically significant difference. Patients with well-controlled conditions show significantly higher PEFR values compared to those with poorly controlled conditions. The analysis reveals that patients with well-controlled conditions exhibit significantly superior pulmonary function across all assessed metrics (FEV1, FEV1/FVC, and PEFR) when compared to patients with poorly controlled conditions.
Table 5: Correlation of variables with ACT values
|
|
R |
P value |
|
ACT vs FEV1 |
0.619 |
0.001* |
|
ACT vs FEV1/FVC |
0.670 |
0.001* |
|
ACT vs PEFR |
0.659 |
0.001* |
Table (5) presents the correlation coefficients (R2) along with the corresponding p-values that illustrate the relationship between ACT (Asthma Control Test) scores and various pulmonary function metrics: FEV1 (Forced Expiratory Volume in one second), FEV1/FVC ratio (Forced Vital Capacity), and PEFR (Peak Expiratory Flow Rate).
ACT v/s FEV1:
A significant positive correlation exists between ACT scores and FEV1 values. Elevated ACT scores, which reflect improved asthma control, are linked to increased FEV1 values. Correlation coefficient (R2): 0.619, P-value= 0.001.
ACT v/s FEV1/FVC:
A significant positive correlation is observed between ACT scores and the FEV1/FVC ratio. Enhanced asthma control correlates with a higher FEV1/FVC ratio. Correlation coefficient (R2): 0.670, P-value= 0.001.
ACT v/s PEFR:
A significant positive correlation is found between ACT scores and PEFR values. Higher ACT scores are associated with increased PEFR values, indicating improved peak expiratory flow. Correlation coefficient (R2): 0.659, P-value = 0.001.
DISCUSSION:
The signs of bronchial asthma, a persistent inflammatory condition affecting the airways, include coughing, a feeling of tightness in the chest, wheezing, and shortness of breath. This disorder is marked by bronchial hyper-responsiveness and fluctuating airflow obstruction, which may resolve spontaneously or with medical treatment. A patient with well-managed asthma does not show any symptoms typical of active asthma. Conversely, there are various clinical, physiological, pathological, immunological, and even molecular signs. Although the absence of acute exacerbations and the reduction of symptoms suggest a favorable response to therapy, assessing limitations in activity is a crucial aspect of management. The initiation or modification of asthma medication is fundamentally reliant on an accurate assessment of asthma control. Several criteria have been established to evaluate asthma control.
The study comprises a total of 50 participants, with ages ranging from 11 to under 18 years. The participants are categorized into two age groups: those aged 14 years or younger, and those older than 14 years. Among the participants, there are 29 females, representing 58% of the total sample, and 21 males, accounting for 42% of the total sample. The data indicates a greater representation of female participants compared to their male counterparts, which contrasts with findings from studies conducted by Nitesh et al. and Joana Mikotajazyk et al., where a male predominance was observed. Participants aged 14 years or younger constitute 2.0% of the total sample. The Body Mass Index (BMI) of participants varies from a minimum of 13.40 to a maximum of 26.60, with a mean BMI of 20.11 and a standard deviation of 2.95, consistent with the research conducted by Nitesh Gupta et al. and Ming Shen Lee et al. Within the group of 50 children studied, 23 had an Asthma Control Test (ACT) score between 20-24, representing 46% of the sample, while 27 participants, or 54% of the study sample, were classified as Poorly Controlled (ACT ≤19), indicating that over half of the participants experience poorly controlled asthma, similar to findings by Mrunal Takur et al. The FEV1 values for the study participants ranged from a minimum of 56.00 to a maximum of 109.00.
The average FEV1 is 84.86, with a standard deviation of 16.70, which is comparable to findings from other research conducted by Nitesh Gupta et al. and Ming Shen Lee et al. The FEV1/FVC ratio among the study participants ranges from a minimum of 59.0 to a maximum of 107.00. The mean FEV1/FVC ratio is 84.80, and the standard deviation for FEV1/FVC is 12.21, aligning with results from other studies by Nitesh Gupta et al. and Ming Shen Lee et al. A significant positive correlation exists between ACT scores and FEV1 values. Elevated ACT scores, which reflect improved asthma control, correlate with increased FEV1 values, with a correlation coefficient (R) of 0.619 and a P-value of 0.001. Additionally, a significant positive correlation is observed between ACT scores and the FEV1/FVC ratio, with a correlation coefficient (R) of 0.670 and a P-value of 0.001.
There is also a significant positive correlation between ACT scores and PEFR values. Higher ACT scores are associated with greater PEFR values, indicated by a correlation coefficient (R) of 0.659 and a P-value of 0.001, suggesting better peak expiratory flow in children with well-controlled asthma. It was determined that there is a positive correlation between ACT scores and the mean FEV1/FVC ratio, similar to findings from the study conducted by Nitesh Gupta et al. and Raj Kumar et al. This cross-sectional study involved children aged 12-17 years diagnosed with asthma, who attended the outpatient department and were admitted to the hospital from August 2022 to January 2024. These children underwent ACT and pulmonary function tests, which were compared to assess asthma control. Statistical analysis indicates a strong correlation between clinical symptoms, represented by ACT scores, and pulmonary function test variables, including FEV1, FEV1/FVC, and PEFR, in evaluating asthma control during follow-up visits, with a correlation coefficient (R) of 0.619 and a P-value of 0.001.
In the comparison of ACT versus FEV1, all three patients with FEV1 <60% exhibited poorly controlled asthma, highlighting a strong link between very low FEV1 levels and inadequate asthma control. Among patients with FEV1 between 60-80%, 14 (77.8%) had poorly controlled asthma, while a smaller group of 4 (22.2%) demonstrated well-controlled asthma. This indicates a notable yet less exclusive correlation between moderate FEV1 reduction and inadequate asthma control when compared to the <60% FEV1 group. Among patients with FEV1 >80%, a significant majority, 19 (65.5%), exhibit well-controlled asthma, whereas a smaller segment, 10 (34.5%), demonstrate poorly controlled asthma. This implies that elevated FEV1 values correlate with improved asthma management.ACT versus FEV1/FVC: A considerable proportion of patients (92.3%) with FEV1 <75% experience poorly controlled asthma, highlighting a strong link between significantly diminished FEV1 and inadequate asthma control. Only a minor percentage (7.7%) maintain well-controlled asthma.
In the cohort with FEV1 between 75-80%, two-thirds (66.7%) are classified as having poorly controlled asthma, while one-third (33.3%) are well-controlled. This reflects a significant association between moderately reduced FEV1 and poor asthma control, although many patients still achieve good control. In the group with FEV1 >80%, the majority (64.5%) have well-controlled asthma, while a considerable minority (35.5%) are poorly controlled. This further suggests that higher FEV1 values are linked to better asthma management.
CONCLUSION:
The current study suggests that, the asthma is inadequately managed in 54% of cases, while 46% are effectively controlled based on the ACT. There exists a strong correlation between the ACT score and the variables of pulmonary function tests in evaluating airway obstruction and the severity of symptoms. The ACT may serve as a viable alternative to pulmonary function testing in settings with limited resources. However, the small sample size presents a potential limitation of this study; therefore, a larger population-based study would underscore the robustness of the findings presented here.
Limitation of the Study
The current study was carried out on a sample basis. All results are approximated with a limited number of cases. Additional evaluation will be required for a comprehensive and robust decision.
REFERENCES:
1. Venkatesan P. 2023 GINA report for asthma. The Lancet Respiratory Medicine. 2023;11(7):589.
2. Kliegman RM, Behrman RE, Jenson HB, Stanton BM. Nelson Textbook of Pediatrics E-book. Elsevier Health Sciences; 2007 Aug 15.
3. Poongadan MN, Gupta N, Kumar R. Asthma control test and correlation with spirometry and inflammatory markers in asthma patients at a tertiary care centre in India. Indian J Chest Dis Allied Sci. 2019;60:239-244.
4. Leon-Astudillo C, Dy FJ, McCown MY, Perez IA, Chhabra D, Bansal M, Maloney MA, Bedoya M, Ezmigna D, Bush D, Okorie CU. ATS core curriculum 2023: Pediatric pulmonary medicine: respiratory disorders in infants. Pediatric Pulmonology. 2024 Mar 28.
5. Waller DG, editor. Respiratory E-Book. Elsevier Health Sciences; 2016 Sep 13.
6. Agarwal R, Dhooria S, Aggarwal AN, Maturu VN, Sehgal IS, Muthu V, et al. Guidelines for the diagnosis and management of bronchial asthma: Joint ICS/NCCP(I) recommendations. Lung India. 2015;32:S3-S42.
7. Alvarez-Gutiérrez FJ, Medina-Gallardo JF, Pérez-Navarro P, Martín-Villasclaras JJ, Martin Etchegoren B, Romero-Romero B, et al. Comparison of the Asthma Control Test (ACT) with lung function, levels of exhaled nitric oxide and control according to the Global Initiative for Asthma (GINA). Arch Bronconeumol. 2010;46:370-377.
8. Wu LC, Zarrin AA. The production and regulation of IgE by the immune system. Nat Rev Immunol. 2014;14:247-259.
9. Xystrakis E, Kusumakar S, Boswell S, Peek E, Urry Z, Richards DF, et al. Reversing the defective induction of IL10 secreting regulatory T cells in glucocorticoids resistant asthma patients. J Clin Invest. 2006;116:146-155.
10. Corren J. Role of interleukin-13 in asthma. Curr Allergy Asthma Rep. 2013;13:415-420.
11. Hirano T. Interleukin 6 and its receptor: ten years later. Int Rev Immunol. 1998;16:249-284.
12. Takemura M, Matsumoto H, Niimi A, Ueda T, Matsuoka H, Yamaguchi M, et al. High sensitivity C-reactive protein in asthma. Eur Respir J. 2006;27:908-912.
13. Nathan RA, Sorkness CA, Kosinski M, Schatz M, Li JT, Marcus P, et al. Development of the Asthma Control Test: a survey for assessing asthma control. J Allergy Clin Immunol. 2004;113:59-65.
14. Khalili B, Boggs PB, Shi R, Bahana SL. Discrepancy between asthma control assessment tools and fractional exhaled nitric oxide. Ann Allergy Asthma Immunol. 2008;101:124-129.
15. Shirai T, Furuhashi K, Suda T, Chida K. Relationship of the Asthma Control Test with pulmonary function and exhaled nitric oxide. Ann Allergy Asthma Immunol. 2008;101:608-613.
16. Ko FW, Leung TF, Hui DS, Chu HY, Wong GW, Wong E, et al. Asthma Control Test correlates well with the treatment decisions made by asthma specialists. Respirology. 2009;14:559-566.
17. Jatakanon A, Lim S, Kharitonov SA, Chung KF, Barnes PJ. Correlation between exhaled nitric oxide, sputum eosinophils, and methacholine responsiveness in patients with mild asthma. Thorax. 1998;53:91-95.
18. Louis R, Lau LC, Bron AO, Roldaan AC, Radermecker M, Djukanovic R. The relationship between airways inflammation and asthma severity. Am J Respir Crit Care Med. 2000;161:9-16.
19. Melosini L, Dente FL, Bacci E, Bartoli ML, Cianchetti S, Costa F, et al. Asthma Control Test (ACT): comparison with clinical, functional, and biological markers of asthma control. J Asthma. 2012;49:317-323.
20. American Thoracic Society. Standardisation of spirometry, 1994 update. Am J Respir Crit Care Med. 1995;152:1107-1136.
21. American Thoracic Society; European Respiratory Society. ATS/ERS recommendations for standardized procedures for the online and offline measurement of exhaled lower respiratory nitric oxide and nasal nitric oxide, 2005. Am J Respir Crit Care Med. 2005;171:912-930.
22. Chhabra SK. Assessment of control in asthma: the new focus in management. Indian J Chest Dis Allied Sci. 2008;50:109-116.
23. Laforest L, Van Ganse E, Devouassoux G, Bousquet J, Chretin S, Bauguil G, et al. Influence of patients’ characteristics and disease management on asthma control. J Allergy Clin Immunol. 2006;117:1404-1410.
24. Ramasamy AK, Gupta N, Kumar R. Impact of obesity on bronchial asthma in Indian population. Lung India. 2014;31:121.
25. Sippel JM, Holden WE, Tilles SA, O’Hollaren M, Cook J, Thukkani N, et al. Exhaled nitric oxide levels correlate with measures of disease control in asthma. J Allergy Clin Immunol. 2000;106:645-650.
26. Takemura M, Matsumoto H, Niimi A, Ueda T, Matsuoka H, Yamaguchi M, et al. High sensitivity C-reactive protein in asthma. Eur Respir J. 2006;27:908-912.
27. Jones SL, Kittleson J, Cowan J, Flannery EM, Hancox RJ, McLachlan CR, et al. The predictive value of exhaled nitric oxide measurements in assessing changes in asthma control. Am J Respir Crit Care Med. 2001;164:738-743.
28. Senna G, Passalacqua G, Schiappoli M, Lombardi C, Wilcock L. Correlation among FEV1, nitric oxide and Asthma Control Test in newly diagnosed asthma. Allergy. 2007;62:207-208.
29. Ricciardolo FL, Sorbello V, Bellezza Fontana R, Schiavetti I, Ciprandi G. Exhaled nitric oxide in relation to asthma control: a real-life survey. Allergol Immunopathol (Madr). 2016;44:197-205.
30. Leblanc A, Botelho C, Coimbra A, da Silva JP, de Castro ED, Cernadas JR. Assessment of asthma control: clinical, functional and inflammatory aspects. Eur Ann Allergy Clin Immunol. 2013;45:90-96.
31. Wu LC, Zarrin AA. The production and regulation of IgE by the immune system. Nat Rev Immunol. 2014;14:247-259.
32. Criqui MH, Seibles JA, Hamburger RN, Coughlin SS, Gabriel S. Epidemiology of immunoglobulin E levels in a defined population. Ann Allergy. 1990;64:308-313.
33. Burrows B, Martinez FD, Halonen M, Barbee RA, Cline MG. Association of asthma with serum IgE levels and skin test reactivity to allergens. N Engl J Med. 1989;320:271-277.
34. de Marco R, Marcon A, Jarvis D, Accordini S, Almar E, Bugiani M, et al. Prognostic factors of asthma severity: a 9-year international prospective cohort study. J Allergy Clin Immunol. 2006;117:1249-1256.
35. Tanaka A, Jinno M, Hirai K, Miyata Y, Mizuma H, Yamaguchi M, et al. Longitudinal increase in total IgE levels in patients with adult asthma: an association with poor asthma control. Respir Res. 2014;15:144.
36. Maneechotesuwan K, Sujaritwongsanon P, Suthamsmai T. IgE production in allergic asthmatic patients with different asthma control status. J Med Assoc Thai. 2010;93:S71-S78.
37. Sigari N, Ghasri H. Correlation between hs-CRP and asthma control indices. Tanaffos. 2013;12:44-49.
38. Smith OH, Malore DG, Lawson KA, et al. A national estimate of the economic cost of asthma. Am J Respir Crit Care Med. 1997;156:787-793.
39. Woolcock A, Rubinfeld AR, Seale JP, et al. Thoracic Society of Australia and New Zealand asthma management plan 1989. Med J Aust. 1989;151:650-653.
40. International Asthma Management Project and the NHLBI Institute. International Consensus Report on Diagnosis and Treatment of Asthma. Eur Respir J. 1992;5:601-641.
41. Vollmer WM, Markson LE, O’Connor E, et al. Association of asthma control with health care utilization: a prospective evaluation. Am J Respir Crit Care Med. 2002;165:195-199.
42. Juniper EF, O’Byrne PM, Guyatt GH, et al. Development and validation of a questionnaire to measure asthma control. Eur Respir J. 1999;14:902-907.
43. Boulet LP, Boulet V, Milot J. How should we quantify asthma control? A proposal. Chest. 2002;122:2217-2223.
44. Nathan RA, Sorkness CA, Kosinski M, et al. Development of the Asthma Control Test: a survey for assessing asthma control. J Allergy Clin Immunol. 2004;113:59-65.
45. Shore SA, Fredberg JJ. Obesity, smooth muscle, and airway hyperresponsiveness. J Allergy Clin Immunol. 2005;115:925-927.
46. Johnbull J, Olaiya AB, Efosa EG. Assessment of asthma control using Asthma Control Test (ACT) and its relationship with lung function parameters. Greener Journal of Medical Sciences. 2013;3:276-282.
47. Partridge MR, Van der Molen T, Myrseth SE, Busse WW. Attitudes and actions of asthma patients on regular maintenance therapy: the INSPIRE study. BMC Pulm Med. 2006;6:10-12.
48. Mbatchou Ngahane BH, Pefura-Yone EW, Mama M, Motto MN, Olinga U, Wandji A, et al. Assessment of asthma control using Asthma Control Test in chest clinics in Cameroon: a cross-sectional study. Pan Afr Med J. 2016;23:70-74.
49. Marion RJ, Creer TL, Reynolds RV. Direct and indirect costs associated with the management of childhood asthma. Ann Allergy. 1985;54:31-34.
50. Cohn L, Elias JA, Chupp GL. Asthma: mechanisms of disease persistence and progression. Annu Rev Immunol. 2004;22:789-815.
51. Bousquet J, Jeffery PK, Busse WW, Johnson M, Vignola AM. Asthma. Am J Respir Crit Care Med. 2000;161:1720-1745.
52. Reddel HK, Marks GB, Jenkins CR. When can personal best peak flow be determined for asthma action plans? Thorax. 2004;59:922-924.
53. Wenzel S. Mechanisms of severe asthma. Clin Exp Allergy. 2003;33:1622-1628.
54. Mendoza MMR, Bernice OC, Guzman-Banson AV, et al. Comparative assessment of Asthma Control Test (ACT) and GINA classification including FEV1 in predicting asthma severity. Phil Heart Center J. 2007;1:149-155.
55. FitzGerald JM, Boulet LP, McIvor RA, et al. Asthma control in Canada remains suboptimal: The Reality of Asthma Control (TRAC) study. Can Respir J. 2006;13:253-259.
56. Rabe KF, Vermeire PA, Soriano JB, Maier WC. Clinical management of asthma in 1999: the Asthma Insights and Reality in Europe (AIRE) study. Eur Respir J. 2000;16:802-807.