EFFECT OF OBESITY AND WEIGHT LOSS ON THYROID STIMULATING HORMONE LEVELS-CASE CONTROL STUDY.
- Ashish Kumar , Professor, Department of Medicine, GMC Patiala.
- Mayank Bansal , Junior Resident, Department of Medicine, GMC Patiala.
- Maninder Kaur , Professor, Department of Biochemistry, GMC Patiala.
- Harmanjot Kaur , Junior Resident, Department of Medicine, GMC Patiala.
Article Information:
Abstract:
Background: Obesity is a growing global health concern and has been increasingly associated with alterations in endocrine function, including the hypothalamic–pituitary–thyroid (HPT) axis. Thyroid hormones play a critical role in regulating metabolism, energy expenditure, and body weight. However, the nature of the relationship between obesity and thyroid function, particularly in euthyroid individuals, remains unclear and often debated. Objective: This study aimed to evaluate the relationship between obesity and thyroid function, specifically serum thyroid-stimulating hormone (TSH) levels, in clinically euthyroid individuals and the impact of weight reduction on TSH levels. Methods: A total of 180 euthyroid participants were included and categorized into three groups: non-obese (Group 1), obese receiving routine advice (Group 2), and obese undergoing structured 6 months weight reduction intervention (Group 3). Baseline anthropometric parameters, including body weight, body mass index (BMI), and waist circumference, were recorded. Serum levels of TSH, triiodothyronine (T3), and thyroxine (T4) were measured at baseline. Group 2 and 3 were followed up for 6 months and anthropometric parameters and thyroid profile were measured again at end of follow up period. Statistical analysis was performed to determine correlations between BMI and thyroid parameters, as well as changes following weight loss. Results: The study demonstrated a significant positive correlation between BMI and serum TSH levels, with higher TSH values observed in obese groups compared to non-obese individuals. Elevated TSH (>5 µIU/mL) was more prevalent among obese participants, suggesting an increased occurrence of subclinical hypothyroidism or obesity-associated hyperthyrotropinemia. In contrast, serum T3 and T4 levels remained largely within normal physiological ranges across all groups, indicating preserved peripheral thyroid hormone homeostasis. Prevalence of Anti-TPO positivity was noted to be 50% in obese individulas with elevated TSH levels. Following weight reduction, particularly in the structured intervention group, a notable decline in TSH levels was observed, with some individuals achieving normalization of previously elevated TSH values. However, changes in T3 and T4 levels were minimal and not statistically significant. Conclusion: The study highlights a significant association between obesity and elevated TSH levels in euthyroid individuals, supporting the concept that obesity influences thyroid function. However, these alterations appear to be functional and potentially reversible with weight loss rather than indicative of intrinsic thyroid disease. The findings underscore the importance of considering obesity-related physiological adaptations when interpreting thyroid function tests and emphasize weight management as a key strategy in normalizing TSH levels
Keywords:
Article :
INTRODUCTION:
Obesity is a chronic, multifactorial disorder with profound metabolic and endocrine consequences, and its rising prevalence in developing countries such as India poses a major public health challenge. Among its hormonal associations, alterations in thyroid function—particularly thyroid-stimulating hormone (TSH)—have gained increasing attention. Traditionally, elevated TSH has been viewed as a cause of weight gain; however, an emerging school of thought suggests the reverse: that obesity itself may lead to increased TSH levels.
Individuals with obesity frequently exhibit mildly elevated TSH concentrations, often within the upper normal range, reflecting altered hypothalamic–pituitary–thyroid axis activity rather than primary thyroid dysfunction [1]. This phenomenon is thought to be mediated by adipose-derived factors such as leptin, which stimulates hypothalamic thyrotropin-releasing hormone production, along with the effects of chronic low-grade inflammation [2,3]. These mechanisms position adipose tissue as an active endocrine organ influencing thyroid regulation.
Importantly, this association appears reversible. Evidence shows that weight loss leads to a significant reduction in TSH levels without specific thyroid treatment [4]. This supports the concept of obesity-induced functional hyperthyrotropinemia and underscores the need to reinterpret elevated TSH in obesity as a consequence, rather than a cause, of excess adiposity.This study sought to find out association of serum TSH levels with obesity and weight loss in North Indian population.
MATERIALS AND METHODS:
This prospective hospital-based study was conducted over one year in the Departments of Medicine and Biochemistry at Rajindra Hospital and Government Medical College, Patiala. A total of 180 clinically euthyroid adults aged >18 years with serum TSH levels ranging from 0.25–10 µIU/ml were included . Individuals with overt hypothyroidism or hyperthyroidism, those receiving thyroxine or anti-thyroid drugs, patients with thyroid swelling, prior thyroid surgery or irradiation, those on drugs affecting thyroid function, and individuals with chronic systemic illnesses were excluded . Ethical clearance and informed consent were obtained prior to enrollment.
Participants were divided into three groups (n=60 each) based on body mass index (BMI), waist circumference, and waist–hip ratio (WHR) according to standard anthropometric criteria [5] .Group 1 will include euthyroid non obese individuals [BMI<22.9 kg/m2 and WHR <0.85 in females/0.90 in males and waist circumference < 80cm in females/90 cm in males] .Group 2 will have euthyroid obese/overweight individuals [BMI > 22.9 kg/m2 or WHR >0.85 in females/0.90 in males or waist circumference > 80cm in females/90cm in males] who will be offered routine dietary and exercise advices.
Group 3 will include euthyroid obese/ overweight individuals [BMI > 22.9 kg/m2 or WHR >0.85 in females/0.90 in males or waist circumference > 80cm in females/90cm in males] who will be offered a 6 months weight loss intervention. Baseline biochemical parameters, including T3, T4, TSH, and anti-TPO antibodies (in selected cases), were assessed using ELISA methods [6]. Group 3 underwent a structured 6-month weight loss intervention using a hypocaloric diet plan prepared by a qualified dietician.The diet plan constituted a well balanced diet of 50-60 % carbohydrates, 20-25% fats and 10-15 % proteins. Although daily calorie intake have to be individualized but we can aimed to limit daily calorie intake to 1500 kcal/day in women and 1800 kcal/day in males.
Subjects in group 2 and 3 were followed up for 6 months and thyroid profile and anthropometric measurements were repeated.
The collected data was tabulated and analyzed using Microsoft Excel 2023. Statistical tests included chi-square, t-test, and ANOVA, with p<0.05 considered significant . The Pearson correlation coefficient was used to assess the strength and direction of linear relationships between continuous variables, with correlation values ranging from −1 to +1, indicating negative, no, or positive association.
RESULTS:
In the present study mean age was 37.12 ± 11.33 (Group 1), 40.08 ± 9.51 (Group 2), and 39.3 ± 10.92 years (Group 3). Gender distribution was balanced: Group 1 (51.67% males, 48.33% females), Group 2 (55% males, 45% females), and Group 3 (50% males, 50% females). Age and sex were comparable across groups.
Among 180 participants, diabetes was present in 25%, hypertension in 22.22%, CAD in 8.88%, smoking in 11.11%, and alcohol use in 13.88%. Group 2 showed the highest prevalence of diabetes (31.67%), hypertension (33.33%), and CAD (10%). These differences were not significant except for hypertension, which was seen more in group 2 subjects.
At baseline among 180 participants mean weight was 72.96 kg, mean BMI was 25.56 kg/m², and mean waist circumference was 90.48 cm. Group 1 included non obese patients with normal anthropometric values, while Groups 2 (83.07 kg; BMI 28.11; WC 103.46 cm) and 3 (79.42 kg; BMI 28.50; WC 95.65 cm) showed significantly higher anthropometric measures, indicating obesity[table 1]. At 6 months, Groups 2 and 3 anthropometric variables and thyroid profile was reassessed again. Group 3 showed significantly greater improvement in anthropometric variables than Group 2 -weight (74.16 ± 9.04 vs 82.52 ± 10.14 kg; p=0.045) andBMI (26.78 ± 1.27 vs 28.05 ± 2.08; p<0.001).
Subjects of Group 3 showed significantly more weight loss and improvement in anthropometric measurements after follow up of 6 months. Mean weight loss was higher in Group 3[4.30 kg] compared to Group 2[0.84kg] which was statistically significant[Table 1]
Thyroid profile of all 180 participants had mean baseline values of as follows-T3 1.15 ± 0.34 ng/mL, T4 7.19 ± 1.43 µg/dL, and TSH 3.18 ± 1.87 µIU/mL respectively. Both T3 and T4 were comparable across groups (1.13±0.35 vs 1.12±0.35;p= 0.53 and 7.31±1.26 vs 8.02±1.66;p=0.08). However, TSH was significantly higher in Groups 2 and 3 (3.37 ± 2.11; 3.73 ± 2.17) versus Group 1 (2.45 ± 0.77; p=0.01). At follow-up, mean TSH was 2.21 ± 1.7 µIU/mL. Group 2 had a mean TSH of 1.82 ± 2.02 µIU/mL[46%], while Group 3 showed 2.59 ± 1.19 µIU/mL[30.5%]. Overall, TSH levels declined after weight reduction, with greater improvement observed following structured intervention compared to routine advice [Table 2]
Among 180 participants, 22 (12.22%) had baseline TSH >5 µIU/mL. None in Group 1 showed elevation, while 8 (13.33%) in Group 2 and 14 (23.33%) in Group 3 did, indicating higher prevalence in obese groups. Mean anti-TPO levels were 58.75 ± 28.84 IU/L overall, 45.85 ± 26.44 in Group 2, and 66.12 ± 25.86 in Group 3. Anti-TPO positivity among elevated TSH cases was 37.5% (3/8) in Group 2 and 57.14% (8/14) in Group 3; overall 50% (11/22).
On analysis of data using Pearson’s correlation cofficient a weak but statistically significant positive correlation between TSH and body weight (r=0.256, p=0.001), BMI (r=0.270, p<0.001), and waist circumference (r=0.271, p<0.001) was observed[Table3, Graph 1]. Although higher adiposity was associated with slightly increased TSH levels, the modest strength suggests limited predictive value and involvement of additional factors. Correlation analysis assessed the relationship between weight loss and fall in TSH over 6 months . A strong positive correlation was observed overall (r = 0.864), indicating a significant association. Mean weight reduction of 5.63 ± 1.98% corresponded with a fall in TSH from 3.58 ± 1.89 to 2.64 ± 1.18 mIU/L, with a mean decrease of –0.94 ± 0.76 mIU/L. [Table 3]
TABLE 1: ANTHROPOMETRIC VARIABLES AT BASELINE AND AT 6 MONTHS
|
Anthropometric variables |
Total |
Group 1 |
Group 2 |
Group 3 |
||||
|
Mean |
SD |
Mean |
SD |
Mean |
SD |
Mean |
SD |
|
|
Weight (Kg) at baseline |
72.96 |
14.28 |
56.39 |
5.59 |
83.07 |
9.07 |
79.42 |
8.92 |
|
Height (m) |
1.687 |
0.68 |
1.67 |
0.70 |
1.72 |
0.51 |
1.67 |
0.80 |
|
BMI (Kg/m2) at baseline |
25.56 |
4.10 |
20.07 |
1.07 |
28.11 |
1.84 |
28.50 |
0.77 |
|
Waist circumference (cm) at baseline |
90.48 |
14.98 |
72.32 |
5.15 |
103.46 |
9.19 |
95.65 |
6.10 |
|
Weight (Kg) at 6 months |
79.2 |
10.50 |
- |
- |
82.52 |
10.14 |
74.16 |
9.04 |
|
Mean Weight loss (kg) From baseline |
2.21 |
3.62 |
- |
- |
0.84 |
3.92 |
4.30 |
1.59 |
|
BMI (Kg/m2) at 6 months |
27.42 |
1.84 |
- |
- |
28.05 |
2.08 |
26.78 |
1.27 |
|
Waist circumference (cm) at 6 months |
100.36 |
9.73 |
- |
- |
102.53 |
10.60 |
98.18 |
8.21 |
Table 2 : THYROID PROFILE OF STUDY POPULATION AT BASELINE AND AT 6 MONTHS
|
|
Normal Range |
Total |
Group 1 (n=60) |
Group 2 (n=60) |
Group 3 (n=60) |
p-value |
||||
|
Mean |
SD |
Mean |
SD |
Mean |
SD |
Mean |
SD |
|||
|
|
THYROID PROFILE AT BASELINE |
|||||||||
|
T3 [ng/ml] |
0.5-1.85 |
1.15 |
0.34 |
1.20 |
0.34 |
1.13 |
0.35 |
1.12 |
0.35 |
0.53 |
|
T4 [microgm/dl] |
4.8-11.6 |
7.19 |
1.43 |
7.83 |
1.29 |
7.31 |
1.26 |
8.02 |
1.66 |
0.08 |
|
TSH [microIU/ml] |
0.25-5.00 |
3.18 |
1.87 |
2.45 |
0.77 |
3.37 |
2.11 |
3.73 |
2.17 |
0.01* |
|
|
THYROID PROFILE AT 6 MONTHS |
|||||||||
|
TSH [microIU/ml] |
0.25-5.00 |
2.21 |
1.7 |
- |
- |
1.82 |
2.02 |
2.59 |
1.19 |
0.012 |
|
Mean fall in TSH |
- |
1.35 |
2.71 |
|
-- |
1.55 |
2.92 |
1.14 |
2.47 |
0.001 |
|
Percentage Fall in TSH |
|
38 |
|
- |
|
46 |
|
30.5 |
|
|
Table 3: Correlation of various anthropometric variables at with serum TSH
|
Correlation |
Pearson correlation coefficient (r) |
p-value |
|
Weight[kg] with TSH[microIU/ml] |
0.256 |
0.001 |
|
BMI [kg/m2] with TSH[microIU/ml] |
0.270 |
0.000 |
|
Waist Cicumference with TSH[microIU/ml] |
0.271 |
0.000 |
|
Correlation between weight loss(kg) and fall in TSH (microIU/ml) at 6 months for study population |
0.774 |
0.000 |
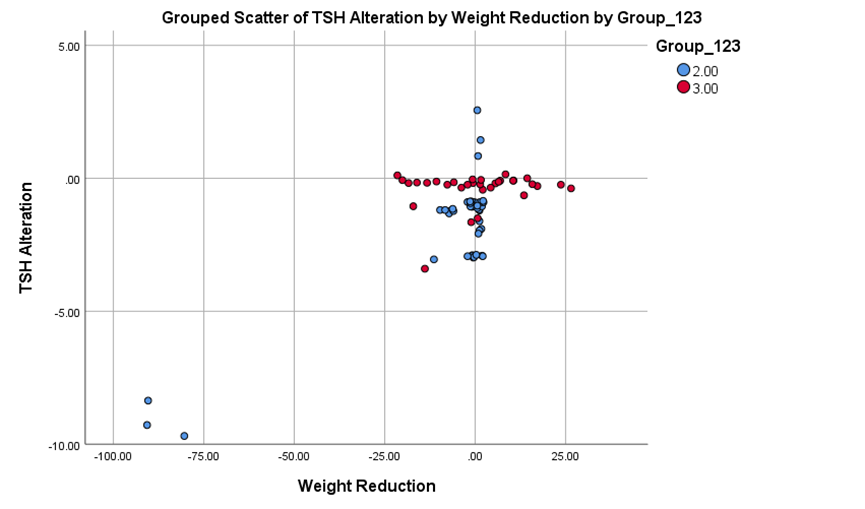
Graph 1-: Correlation of weight reduction with Alteration of TSH among all study population
DISCUSSION:
The present study demonstrated that obesity is linked to a subtle but significant shift in thyroid physiology—serum TSH levels were moderately elevated despite normal peripheral thyroid hormone levels. Baseline age and gender distribution were comparable across groups, minimizing confounding effects. Mean age ranged from 37.12 ± 11.33 to 40.08 ± 9.51 years, with nearly equal gender distribution. In comparison, Kouidrat Y et al. reported a higher mean age of 51 years in subjects undergoing dietary and exercise interventions.[7]
Anthropometric differences between obese and non-obese subjects were striking. Mean BMI increased from 20.07 ± 1.07 kg/m² in non-obese individuals to 28.11 ± 1.84 and 28.50 ± 0.77 kg/m² in obese groups, while waist circumference rose from 72.32 cm to 103.46 cm and 95.65 cm, highlighting substantial central adiposity. However, the obesity severity in the present cohort remained lower than that reported by Kouidrat Y et al., who observed a mean BMI of 49.3 ± 12.4 kg/m².[7]
A key finding of this study was the clear rise in serum TSH with increasing adiposity, while T3 and T4 levels remained stable. Mean TSH levels increased from 2.45 ± 0.77 µIU/mL in non-obese subjects to 3.37 ± 2.11 and 3.73 ± 2.17 µIU/mL in obese subjects (p = 0.01). Weak but significant positive correlations were observed between TSH and BMI (r = 0.270), body weight (r = 0.256), and waist circumference (r = 0.271), all with p = 0.001.
Elevated TSH levels (>5 µIU/mL) were absent in non-obese subjects but were present in 13.33% of Group 2 and 23.33% of Group 3 subjects. Anti-TPO positivity was detected in 50% of obese subjects with elevated TSH, suggesting that thyroid autoimmunity may coexist in a subset of patients. These findings closely mirror those of Knudsen et al., who demonstrated a strong association between adiposity and serum TSH levels (p < 0.001).[1] Similarly, Reinehr et al. reported significantly elevated TSH and fT3 levels in obese children, with unchanged fT4 levels, and noted that nearly 17% had TSH concentrations above the 97.5th percentile.[2] In contrast, Manji et al. found no significant relationship between obesity and thyroid parameters, emphasizing possible population-related variability.[9]
Perhaps the most exciting observation was the reversibility of these hormonal alterations. After 6 months, structured intervention produced significant weight reduction, with mean weight loss of 5.50 ± 1.94% in the intervention group versus 1.19 ± 4.18% in controls. This was accompanied by a dramatic fall in serum TSH levels—approximately 38% overall (3.55 → 2.21 µIU/mL, p < 0.001). TSH reduction was greater in Group 2 (46%) than in Group 3 (30.6%), and percentage weight loss strongly correlated with TSH decline (r = 0.774). These findings reinforce the observations of Reinehr et al., who demonstrated normalization of elevated TSH following substantial weight loss.[2] Marzullo et al. also reported significant TSH reduction after weight loss (6.3%, p < 0.001).[8] However, Kouidrat Y et al. did not observe a significant association between weight loss and TSH reduction (r = 0.25, p = 0.17), suggesting heterogeneity in thyroid response to obesity treatment.[7]
Notably, serum T3 and T4 concentrations remained stable despite significant reductions in TSH, supporting the concept that obesity-related hyperthyrotropinemia is more likely a functional and adaptive neuroendocrine response rather than intrinsic thyroid disease. Leptin-mediated stimulation of hypothalamic TRH secretion may be one of the major mechanisms linking adiposity with elevated TSH. The marked improvement in TSH levels following even modest weight loss strongly supports the reversibility of these metabolic-endocrine alterations.
Limitations of the study include a relatively small sample size, short follow-up duration of 6 months, and single-center hospital-based design, which may limit generalizability. In addition, confounding variables such as diet, physical activity, stress, and socioeconomic status could not be fully controlled.
CONCLUSION:
Obesity was associated with elevated serum TSH levels despite normal T3 and T4 concentrations, suggesting a state of reversible obesity-related hyperthyrotropinemia rather than overt thyroid dysfunction. Even modest weight reduction significantly improved TSH levels, highlighting the dynamic interplay between adiposity, metabolism, and thyroid regulation.
Funding & Conflict of interest
No funding was taken from any organisation or individual for this research project.The authors declare that there is no conflict of interest.
REFERENCES:
1. Knudsen N, Laurberg P, Rasmussen LB, et al. Small differences in thyroid function may be important for body mass index and the occurrence of obesity. J Clin
2. Reinehr T. Obesity and thyroid function. Mol Cell Endocrinol. 2010;316(2):165–171.
3. Rotondi M, Leporati P, La Manna A, et al. Raised serum TSH levels in patients with morbid obesity. Eur J Endocrinol. 2009;160(3):403–408.
4. Rosenbaum M, Hirsch J, Murphy E, Leibel RL. Effects of changes in body weight on carbohydrate metabolism and thyroid hormones. Am J Clin Nutr. 2000;71(6):1421–1432.
5. World Health Organization. Waist circumference and waist-hip ratio. 2011
6. Khalaf ZA. Detection of FOXP3 and IL-10 gene expression and immunological biomarkers in Iraqi hyperthyroidism patients treated with radioiodine. A dissertation, College of Biotechnology, AL-Nahrain University. 2020.
7. Kouidrat Y, Diouf M, Desailloud R, Louhou R. Effects of a diet plus exercise program on thyroid function in patients with obesity. Metabolism open. 2019 Jun 1;2:100008.
8. Marzullo P, Minocci A, Tagliaferri MA, Guzzaloni G, Di Blasio A, De Medici C, Aimaretti G, Liuzzi A. Investigations of thyroid hormones and antibodies in obesity: leptin levels are associated with thyroid autoimmunity independent of bioanthropometric, hormonal, and weight-related determinants. The Journal of Clinical Endocrinology & Metabolism. 2010 Aug 1;95(8):3965-72.
9. Manji N, Boelaert K, Sheppard MC, Holder RL, Gough SC, Franklyn JA. Lack of
10. association between serum TSH or free T4 and body mass index in euthyroid
11. subjects. Clinical endocrinology. 2006 Feb;64(2):125-8