Correlation of Neutrophil–Lymphocyte Ratio, Lipid Profile, and HbA1c in Acute Ischemic Stroke: An Institutional Study.
- Afeera Tufheem , Postgraduate, Department of General Medicine, Mamata Medical College, Khammam, Telangana.
- Ch. Babu Rao , Associate Professor, Department of General Medicine, Mamata Medical College, Khammam, Telangana.
- Kovvuri Pavani , Postgraduate, Department of General Medicine, Mamata Medical College, Khammam, Telangana.
- Balmoori Sreejan , Postgraduate, Department of General Medicine, Mamata Medical College, Khammam, Telangana.
- Kondaparthi Sahithi , Postgraduate, Department of General Medicine, Mamata Medical College, Khammam, Telangana.
- Kesavadasupalem Madhavee Latha , Postgraduate, Department of General Medicine, Mamata Medical College, Khammam, Telangana.
Article Information:
Abstract:
Introduction: Acute ischemic stroke is a major cause of morbidity and mortality and is closely linked with inflammatory and metabolic disturbances. Neutrophil–lymphocyte ratio (NLR), lipid abnormalities, and glycated haemoglobin (HbA1c) may serve as important biomarkers in stroke. Aim of the study was to evaluate the correlation of NLR, lipid profile, and HbA1c in patients with acute ischemic stroke. Materials and Methods: This hospital-based observational study included 100 patients with radiologically confirmed acute ischemic stroke over two years. Clinical details, risk factors, and laboratory parameters including NLR, lipid profile, and HbA1c were analyzed. Statistical analysis was performed using SPSS, with p < 0.05 considered significant. Results: Most patients were aged 50–70 years (58%) with male predominance (64%). Hypertension (68%) was the most common risk factor. The mean NLR was elevated (5.4 ± 2.6) and significantly higher in severe stroke patterns (p < 0.001). NLR showed positive correlation with total cholesterol, triglycerides, LDL-C, and HbA1c, and negative correlation with HDL-C (p < 0.01). Elevated HbA1c was observed in 48% of patients. Conclusion: NLR is a useful, cost-effective marker reflecting the interplay between inflammation and metabolic dysfunction in acute ischemic stroke.
Keywords:
Article :
INTRODUCTION:
Acute ischemic stroke is a leading cause of mortality and long-term disability worldwide, accounting for nearly 70–80% of all cerebrovascular events and imposing a significant socioeconomic burden, particularly in developing countries such as India (1). The pathophysiology of ischemic stroke is complex and involves an interplay of vascular occlusion, endothelial dysfunction, inflammatory cascades, and metabolic derangements that ultimately result in neuronal injury and infarction (2). Traditional risk factors such as hypertension, diabetes mellitus, dyslipidaemia, smoking, and advancing age have been well established; however, increasing evidence highlights the pivotal role of systemic inflammation and metabolic imbalance in the initiation and progression of ischemic brain injury (3). Among emerging biomarkers, the neutrophil–lymphocyte ratio (NLR) has gained considerable attention as a simple, cost-effective, and readily available marker of systemic inflammation derived from routine hematological parameters (4). Elevated NLR reflects an enhanced neutrophilic response along with relative lymphopenia, indicating a pro-inflammatory state that has been associated with poor outcomes in various cardiovascular and cerebrovascular conditions (5).
In the context of acute ischemic stroke, inflammatory processes play a crucial role not only in the acute phase of injury but also in determining the extent of neuronal damage and clinical prognosis. Neutrophils are among the earliest responders to ischemic insult and contribute to blood–brain barrier disruption, oxidative stress, and secondary neuronal injury, whereas lymphocytes are involved in immunomodulation and repair mechanisms (6). Hence, the balance between these two cellular components, as reflected by NLR, may serve as an important indicator of disease severity and outcome. Several studies have demonstrated that higher NLR values are associated with increased infarct size, greater neurological deficits, and poorer functional outcomes (7). Tokgoz et al. reported a significant association between elevated NLR and severity of acute ischemic stroke, suggesting its potential role as a prognostic biomarker (8). Similarly, a study by Celikbilek et al. highlighted that NLR correlates with both stroke severity and short-term mortality (9).
In addition to inflammation, metabolic factors such as dyslipidaemia and chronic hyperglycaemia are critical contributors to atherosclerosis and cerebrovascular disease. Lipid abnormalities, particularly elevated low-density lipoprotein (LDL) cholesterol and triglycerides along with reduced high-density lipoprotein (HDL) cholesterol, promote plaque formation, endothelial dysfunction, and vascular occlusion (10). Multiple epidemiological studies have established a strong association between dyslipidaemia and increased risk of ischemic stroke, emphasizing the importance of lipid profile assessment in stroke patients (2). Concurrently, glycemic status, as reflected by glycated haemoglobin (HbA1c), provides an estimate of long-term blood glucose control and has been identified as an independent risk factor for stroke. Chronic hyperglycaemia accelerates atherosclerosis, induces oxidative stress, and exacerbates ischemic neuronal injury (3). Studies have shown that elevated HbA1c levels are associated with increased stroke severity, poor functional outcomes, and higher recurrence rates (11).
Despite evidence supporting the individual roles of inflammatory and metabolic factors in ischemic stroke, few studies have comprehensively evaluated the combined relationship between NLR, lipid profile, and HbA1c, particularly in the Indian population. Most research has focused on isolated parameters, overlooking their integrated impact on stroke characteristics and outcomes. Additionally, regional variations in risk factors and lifestyle highlight the need for institution-based studies, underscoring an important research gap in understanding the interplay between inflammation and metabolism in acute ischemic stroke.
The present study aims to evaluate the clinical profile and metabolic–inflammatory parameters in patients with acute ischemic stroke, with a focus on neutrophil–lymphocyte ratio, lipid profile, and HbA1c to assess their correlation and clinical significance. It analyses clinical presentation, risk factors, stroke patterns in relation to NLR, and the influence of lipid and glycemic status. By integrating these parameters, the study seeks to improve understanding of stroke pathophysiology and identify useful biomarkers for risk stratification and clinical management.
MATERIALS AND METHODS:
Study Design and Setting
The present study was conducted as a hospital-based observational study aimed at evaluating the correlation between neutrophil–lymphocyte ratio (NLR), lipid profile, and HbA1c among patients with acute ischemic stroke. The study was carried out in the Department of General Medicine in collaboration with the Departments of Radiology, Pathology, and Biochemistry at a tertiary care teaching hospital. Radiological confirmation of stroke was obtained through CT and/or MRI imaging in the Department of Radiology, while hematological and biochemical analyses were performed in the Departments of Pathology and Biochemistry. The study was conducted over a period of two years, from March 2024 to February 2026.
Study Population and Sample Size
The study population included patients diagnosed with acute ischemic stroke who were admitted during the study period and fulfilled the eligibility criteria. A total of 100 patients were included in the study. The sample size was calculated using the standard formula n = Z²pq/d², assuming a prevalence (p) of 50% for inflammatory marker abnormalities to obtain maximum sample size, with a 95% confidence interval (Z = 1.96) and allowable error (d) of 10%. The minimum calculated sample size was 96, which was rounded off to 100 to enhance statistical validity.
Inclusion Criteria
• Patients presenting with clinical features of cerebrovascular accident and radiological confirmation (CT/MRI brain) of acute ischemic stroke
• Patients incidentally diagnosed with ischemic stroke during hospital admission for other medical conditions
• Patients who provided informed consent to participate in the study
Exclusion Criteria
• Patients not willing to participate in the study
• Patients diagnosed with hemorrhagic stroke
• Patients who expired within 24 hours of admission
• Patients with stroke secondary to trauma, neoplasm, or active infection
• Patients on immunosuppressive therapy or with known hematological disorders
Ethical Considerations
The study was conducted after obtaining approval from the Institutional Ethics Committee. Written informed consent was obtained from all participants or their legally authorized representatives. Patient confidentiality and data privacy were strictly maintained throughout the study.
Study Tools and Data Collection
• Clinical Evaluation
o Demographic details (age, sex)
o Presenting complaints (motor weakness, speech disturbances, sensory deficits, etc.)
o Detailed medical history including hypertension, diabetes mellitus, dyslipidaemia, smoking, alcohol intake, and prior cerebrovascular events
o General physical examination and detailed neurological assessment at admission
• Radiological Assessment
o CT brain and/or MRI brain performed to confirm ischemic stroke
o Exclusion of hemorrhagic stroke
o Documentation of stroke pattern and anatomical involvement
• Laboratory Investigations
o Complete blood count to obtain absolute neutrophil and lymphocyte counts
o Calculation of neutrophil–lymphocyte ratio (NLR = neutrophil count / lymphocyte count)
o Lipid profile assessment including:
· Total cholesterol
· Triglycerides
· Low-density lipoprotein cholesterol (LDL-C)
· High-density lipoprotein cholesterol (HDL-C)
o Estimation of HbA1c using standardized methods to assess long-term glycemic status
• Data Recording
o All clinical, radiological, and laboratory data were systematically recorded in a structured proforma
o Investigations were performed as part of routine patient care
RESULTS:
Table 1: Demographic Profile and Clinical Presentation of Patients with Acute Ischemic Stroke
|
Variable |
Category |
n |
% |
|
Age (years) |
< 50 |
30 |
30.0 |
|
50–70 |
58 |
58.0 |
|
|
> 70 |
12 |
12.0 |
|
|
Sex |
Male |
64 |
64.0 |
|
Female |
36 |
36.0 |
|
|
Key Presenting Features |
Motor weakness |
82 |
82.0 |
|
Speech disturbance |
58 |
58.0 |
|
|
Altered sensorium |
32 |
32.0 |
|
|
Time to Presentation |
≤ 24 hours |
72 |
72.0 |
|
> 24 hours |
28 |
28.0 |
Table 1 depicts the demographic distribution and key clinical characteristics of patients with acute ischemic stroke. The majority of patients belonged to the 50–70 years age group (58%), followed by those below 50 years (30%), indicating a higher prevalence in middle-aged and elderly individuals. A clear male predominance was observed (64%). Motor weakness was the most common presenting symptom (82%), followed by speech disturbance (58%) and altered sensorium (32%), reflecting typical neurological manifestations of ischemic stroke. Most patients (72%) presented within 24 hours of symptom onset, suggesting relatively early hospital admission in the study population.
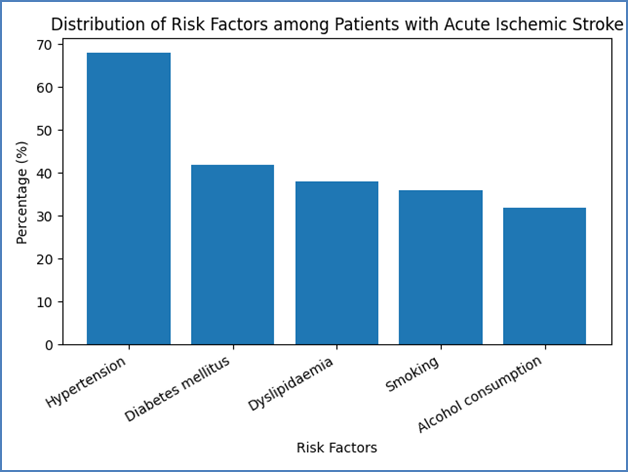
Figure 1: Distribution of Risk Factors among Patients with Acute Ischemic Stroke
Figure 1 shows the distribution of major risk factors among patients with acute ischemic stroke. Hypertension was the most prevalent risk factor, observed in 68% of patients, and demonstrated a highly significant association (p < 0.001), highlighting its dominant role in stroke pathogenesis.
Diabetes mellitus (42%), dyslipidaemia (38%), smoking (36%), and alcohol consumption (32%) were also commonly observed and showed statistically significant associations (p < 0.05). These findings emphasize the contribution of both metabolic and lifestyle-related factors in the development of ischemic stroke, underscoring the importance of early detection and control of modifiable risk factors for effective prevention.
Table 2: Radiological Pattern of Ischemic Stroke
|
Parameter |
Category |
n |
% |
p-value |
|
Imaging modality |
CT Brain |
72 |
72.0 |
— |
|
MRI Brain |
28 |
28.0 |
— |
|
|
Stroke pattern |
MCA territory |
56 |
56.0 |
<0.001 |
|
PCA territory |
14 |
14.0 |
||
|
ACA territory |
8 |
8.0 |
||
|
Lacunar infarcts |
18 |
18.0 |
||
|
Multiple infarcts |
4 |
4.0 |
Table 2 illustrates the radiological characteristics and distribution of ischemic stroke patterns among the study population. Computed tomography (CT) brain was the most commonly utilized imaging modality (72%), while magnetic resonance imaging (MRI) was performed in 28% of patients.
The middle cerebral artery (MCA) territory was the most frequently involved site (56%) and showed a statistically significant predominance (p < 0.001). Posterior cerebral artery (PCA) infarcts accounted for 14%, lacunar infarcts for 18%, and anterior cerebral artery (ACA) infarcts for 8% of cases. Multiple territory infarcts were relatively uncommon (4%).
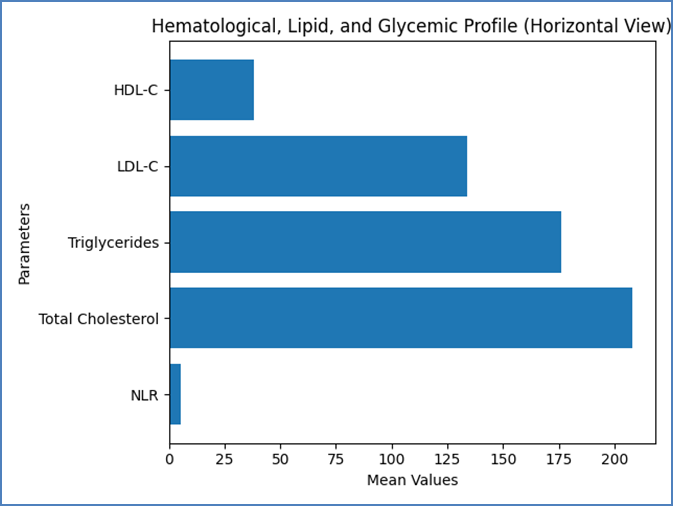
Figure 2: Hematological, Lipid, and Glycemic Profile of Patients with Acute Ischemic Stroke
Figure 2 presents the hematological and metabolic parameters of patients with acute ischemic stroke. The mean neutrophil–lymphocyte ratio (NLR) was elevated (5.4 ± 2.6), indicating a significant systemic inflammatory response. The lipid profile showed increased mean total cholesterol (208 ± 42 mg/dL), triglycerides (176 ± 64 mg/dL), and LDL-C levels (134 ± 38 mg/dL), reflecting a high prevalence of atherogenic dyslipidaemia.
In contrast, HDL-C levels were reduced (38 ± 9 mg/dL), suggesting loss of its protective role. Overall, these findings highlight the coexistence of inflammation and metabolic abnormalities in ischemic stroke patients, emphasizing their potential role in disease pathogenesis and progression.
Table 3: Correlation of NLR with Stroke Pattern, Lipid Profile, and HbA1c
|
Variable |
Category / Parameter |
Mean NLR ± SD / r |
p-value |
|
Stroke Pattern |
Large vessel infarcts |
6.2 ± 2.8 |
<0.001 |
|
Lacunar infarcts |
3.8 ± 1.6 |
||
|
Multiple infarcts |
7.1 ± 3.2 |
||
|
Lipid Profile |
Total cholesterol |
+0.32 |
0.002 |
|
Triglycerides |
+0.41 |
<0.001 |
|
|
LDL-C |
+0.36 |
0.001 |
|
|
HDL-C |
−0.28 |
0.006 |
|
|
HbA1c Categories |
< 5.7% |
3.6 ± 1.4 |
|
|
5.7–6.4% |
4.8 ± 1.9 |
<0.001 |
|
|
≥ 6.5% |
6.7 ± 2.9 |
Table 3 demonstrates the correlation of neutrophil–lymphocyte ratio (NLR) with stroke pattern, lipid profile, and glycemic status. The mean NLR was highest in patients with multiple infarcts (7.1 ± 3.2), followed by large vessel infarcts (6.2 ± 2.8), while the lowest values were observed in lacunar infarcts (3.8 ± 1.6), with a statistically significant association (p < 0.001). NLR showed a significant positive correlation with total cholesterol (r = +0.32), triglycerides (r = +0.41), and LDL-C (r = +0.36), while a negative correlation was observed with HDL-C (r = −0.28), indicating a link between systemic inflammation and atherogenic lipid abnormalities.
Furthermore, NLR increased progressively with worsening glycemic status, with the highest values seen in patients with HbA1c ≥ 6.5% (6.7 ± 2.9), demonstrating a strong association between chronic hyperglycaemia and inflammation (p < 0.001). Overall, these findings highlight the integrated role of inflammatory and metabolic factors in ischemic stroke.
Table 4: Association of Lipid Abnormalities and Glycemic Status with Acute Ischemic Stroke
|
Parameter |
Category |
n |
% |
p-value |
|
Lipid Abnormalities |
High total cholesterol |
56 |
56.0 |
<0.01 |
|
High triglycerides |
48 |
48.0 |
<0.01 |
|
|
High LDL-C |
52 |
52.0 |
<0.01 |
|
|
Low HDL-C |
60 |
60.0 |
<0.001 |
|
|
HbA1c Status |
Normal |
28 |
28.0 |
|
|
Prediabetes |
24 |
24.0 |
<0.001 |
|
|
Diabetes |
48 |
48.0 |
Table 4 shows the association of lipid abnormalities and HbA1c levels among patients with acute ischemic stroke. Among lipid parameters, low HDL-C was the most common abnormality, observed in 60% of patients, followed by elevated total cholesterol (56%), LDL-C (52%), and triglycerides (48%). All lipid abnormalities demonstrated statistically significant associations with stroke (p < 0.01), with low HDL-C showing the strongest significance (p < 0.001). Regarding glycemic status, 48% of patients had HbA1c values in the diabetic range, while 24% were prediabetic and only 28% had normal levels. The predominance of elevated HbA1c was statistically significant (p < 0.001), indicating poor long-term glycemic control among stroke patients. These findings highlight the critical role of dyslipidaemia and chronic hyperglycaemia as major modifiable risk factors in acute ischemic stroke.
DISCUSSION:
The present study evaluated the clinical profile of acute ischemic stroke and examined the interrelationship between inflammatory (NLR), metabolic (lipid profile), and glycemic (HbA1c) parameters. The findings demonstrate a strong association between systemic inflammation and metabolic dysregulation in ischemic stroke, reinforcing the concept that stroke is not merely a vascular event but a complex inflammatory–metabolic disorder.
In the present study, the majority of patients belonged to the 50–70 years age group (58%), with a clear male predominance (64%). This aligns with previous epidemiological observations where stroke incidence increases with age and is more common in males due to higher exposure to vascular risk factors (12). A study by Roger et al. also reported that stroke incidence rises sharply after 50 years and is more prevalent in men compared to women (12). The most common presenting feature in our study was motor weakness (82%), followed by speech disturbance (58%), which is consistent with classical descriptions of ischemic stroke syndromes (13).
Hypertension (68%) emerged as the most significant risk factor in the present study, followed by diabetes mellitus (42%) and dyslipidaemia (38%). These findings are consistent with previous studies which identified hypertension as the strongest modifiable risk factor for ischemic stroke (14). O’Donnell et al., in the INTERSTROKE study, demonstrated that hypertension accounts for nearly half of the population-attributable risk for stroke globally (14). The high prevalence of diabetes and dyslipidaemia in the present study further supports their synergistic role in accelerating atherosclerosis and vascular damage (15).
The middle cerebral artery (MCA) territory was the most commonly affected region (56%), which is in agreement with earlier studies showing MCA dominance due to its direct continuation from the internal carotid artery and larger vascular territory (16). Similar findings were reported by Bamford et al., where MCA infarcts constituted the majority of ischemic strokes (16). Lacunar infarcts accounted for 18% of cases in the present study, reflecting the contribution of small vessel disease, often associated with chronic hypertension and diabetes.
The mean NLR in the present study was elevated (5.4 ± 2.6), indicating an enhanced systemic inflammatory response. Higher NLR values were significantly associated with severe stroke patterns, particularly multiple territory infarcts and large vessel strokes. This finding is consistent with previous studies that have highlighted NLR as a reliable prognostic marker in acute ischemic stroke (17). A study by Tokgoz et al. reported significantly higher NLR values in patients with severe stroke and poor outcomes (8). Similarly, Lattanzi et al. demonstrated that elevated NLR is associated with increased infarct volume and worse neurological deficits (7).
The present study revealed a high prevalence of dyslipidaemia, with elevated total cholesterol (56%), LDL-C (52%), triglycerides (48%), and low HDL-C (60%). These findings are comparable to earlier studies that identified lipid abnormalities as key contributors to atherosclerotic plaque formation and cerebrovascular disease (18). The negative correlation between HDL-C and NLR observed in this study suggests a protective anti-inflammatory role of HDL cholesterol, which has also been reported in prior research (19). Elevated LDL-C and triglycerides were positively correlated with NLR, indicating that lipid-induced vascular inflammation may contribute to stroke severity.
Nearly half of the patients (48%) had HbA1c levels in the diabetic range, indicating poor long-term glycemic control. The study also demonstrated a significant increase in NLR with worsening HbA1c levels, suggesting a strong link between chronic hyperglycaemia and systemic inflammation. These findings are supported by previous studies showing that elevated HbA1c is associated with increased stroke severity and poor outcomes (20). A study by Kwon et al. found that higher HbA1c levels were significantly associated with larger infarct size and increased mortality in ischemic stroke patients (21).
One of the key strengths of the present study is the integrated analysis of inflammatory and metabolic parameters. NLR showed a significant positive correlation with total cholesterol, LDL-C, triglycerides, and HbA1c, while a negative correlation was observed with HDL-C. This indicates that metabolic abnormalities may amplify systemic inflammation, thereby worsening stroke severity. Similar findings were reported by several studies emphasizing the interplay between inflammation, dyslipidaemia, and hyperglycaemia in vascular diseases (22). The progressive increase in NLR across HbA1c categories further supports the hypothesis that chronic metabolic stress enhances inflammatory responses.
Most previous studies have evaluated NLR, lipid profile, or HbA1c independently. However, the present study uniquely integrates all three parameters, providing a more comprehensive understanding of the inflammatory–metabolic axis in ischemic stroke. This combined evaluation can aid in better risk stratification, early identification of high-risk patients, and targeted therapeutic interventions.
CONCLUSION:
The present study demonstrates that acute ischemic stroke is strongly associated with systemic inflammation and metabolic abnormalities. Elevated neutrophil–lymphocyte ratio serves as a significant marker of inflammation and correlates positively with adverse lipid profiles and poor glycemic control. Dyslipidaemia and elevated HbA1c further contribute to the pathogenesis and severity of stroke. The combined assessment of NLR, lipid profile, and HbA1c provides a valuable, cost-effective approach for evaluating stroke risk and severity. These parameters can be utilized in routine clinical practice for improved prognostication and management of patients with acute ischemic stroke.
REFERENCES:
1. Feigin VL, Norrving B, Mensah GA. Global burden of stroke. Circ Res. 2017;120(3):439–448.
2. Hankey GJ. Stroke. Lancet. 2017;389(10069):641–654.
3. American Diabetes Association. Cardiovascular disease and risk management. Diabetes Care. 2023;46(Suppl 1):S158–S190.
4. Zahorec R. Ratio of neutrophil to lymphocyte counts and the stress factor in critically ill patients. Bratisl Lek Listy. 2001;102(1):5–14.
5. Gibson PH, Croal BL, Cuthbertson BH, Small GR, Ifezulike AI, Gibson G, et al. Usefulness of the neutrophil to lymphocyte ratio as a predictor of cardiovascular risk. Am J Cardiol. 2007;99(5):653–657.
6. Iadecola C, Anrather J. The immunology of stroke: from mechanisms to translation. Nat Med. 2011;17(7):796–808.
7. Lattanzi S, Cagnetti C, Provinciali L, Silvestrini M. Neutrophil-to-lymphocyte ratio and neurological deterioration in acute ischemic stroke. Neurol Sci. 2016;37(1):1–7.
8. Tokgoz S, Kayrak M, Akpinar Z, Seyithanoglu A, Güney F, Yürüten B. Neutrophil lymphocyte ratio as a predictor of stroke. J Stroke Cerebrovasc Dis. 2014;23(9):e97–e101.
9. Celikbilek A, Ismailogullari S, Zararsiz G. Neutrophil to lymphocyte ratio predicts poor prognosis in ischemic cerebrovascular disease. Neurol Res. 2014;36(3):218–222.
10. Amarenco P, Labreuche J, Touboul PJ. Lipids and stroke risk. Stroke. 2004;35(12):2902–2909.
11. Selvin E, Steffes MW, Zhu H, Matsushita K, Wagenknecht L, Pankow J, et al. Glycated hemoglobin, diabetes, and cardiovascular risk. N Engl J Med. 2010;362(9):800–811.
12. Roger VL, Go AS, Lloyd-Jones DM, Benjamin EJ, Berry JD, Borden WB, et al. Heart disease and stroke statistics—2012 update: a report from the American Heart Association. Circulation. 2012;125(1):e2–e220.
13. Adams HP Jr, Bendixen BH, Kappelle LJ, Biller J, Love BB, Gordon DL, et al. Classification of subtype of acute ischemic stroke. Stroke. 1993;24(1):35–41.
14. O’Donnell MJ, Xavier D, Liu L, Zhang H, Chin SL, Rao-Melacini P, et al. Risk factors for ischemic and intracerebral hemorrhagic stroke. Lancet. 2010;376(9735):112–123.
15. Emerging Risk Factors Collaboration. Major lipids, apolipoproteins, and risk of vascular disease. Lancet. 2009;375(9722):2215–2222.
16. Bamford J, Sandercock P, Dennis M, Burn J, Warlow C. Classification and natural history of clinically identifiable subtypes of cerebral infarction. Lancet. 1991;337(8756):1521–1526.
17. Wang F, Hu S, Ding Y, Ju X, Wang L, Lu Q, et al. Neutrophil-to-lymphocyte ratio and 90-day outcome in acute ischemic stroke patients. J Neurol Sci. 2014;345(1–2):158–163.
18. Goldstein LB, Bushnell CD, Adams RJ, Appel LJ, Braun LT, Chaturvedi S, et al. Guidelines for the primary prevention of stroke. Stroke. 2011;42(2):517–584.
19. Barter P, Gotto AM, LaRosa JC, Maroni J, Szarek M, Grundy SM, et al. HDL cholesterol, very low levels of LDL cholesterol, and cardiovascular events. Circulation. 2007;116(3):132–140.
20. Selvin E, Marinopoulos S, Berkenblit G, Rami T, Brancati FL, Powe NR, et al. Meta-analysis: glycosylated hemoglobin and cardiovascular disease. N Engl J Med. 2010;362(9):800–811.
21. Kwon HS, Lee SH, Lee JH, Kang BS, Kim DW, Kim YS, et al. HbA1c for diagnosis and prognosis of acute ischemic stroke. Diabetes Care. 2011;34(3):198–203.
22. Ridker PM, Rifai N, Rose L, Buring JE, Cook NR. Comparison of C-reactive protein and LDL cholesterol levels in prediction of cardiovascular events. Circulation. 2002;105(10):1135–1143.