Artificial Intelligence-Based Prediction of EGFR, ALK, and KRAS Oncogenic Mutations from Histopathological Whole-Slide Images in Lung Carcinoma: A Systematic Review and Meta-Analysis.
- Mohammed Abdul Aleem , Associate Professor, Department of Pathology, Mahavir Institute of Medical Sciences, Vikarabad.
- Fahad Abdullah , Associate Professor, Department of Respiratory Medicine, Deccan College of Medical Sciences, Kanchanbagh, Telangana, India.
- Mohammed Abdul Muqeeth , Associate Professor, Department of Biochemistry, Mahavir Institute of Medical Sciences, Vikarabad, Telangana, India.
Article Information:
Abstract:
Background: The accurate identification of actionable oncogenic driver mutations—epidermal growth factor receptor (EGFR), anaplastic lymphoma kinase (ALK), and Kirsten rat sarcoma viral proto-oncogene (KRAS)—is indispensable for precision oncology in non-small cell lung carcinoma (NSCLC). Conventional molecular testing remains costly, tissue-consumptive, and inaccessible in resource-limited settings. Artificial intelligence (AI) applied to routine haematoxylin and eosin (H&E)-stained whole-slide images (WSIs) represents a transformative paradigm for non-invasive genomic inference. This meta-analysis provides the first comprehensive quantitative synthesis of diagnostic accuracy for AI-based mutation prediction from lung histopathology. Methods: A systematic search of PubMed, MEDLINE, Scopus, Web of Science, and EMBASE was conducted from January 2015 to December 2024, following PRISMA 2020 guidelines. Studies employing any AI or machine learning methodology to predict EGFR, ALK, or KRAS mutational status from digitised lung histopathology slides were eligible. Bivariate random-effects modelling was used to pool diagnostic accuracy metrics. Heterogeneity was evaluated using the I² statistic and Cochran's Q test. Quality appraisal was performed using QUADAS-2. Subgroup analyses and meta-regression were conducted to explore sources of heterogeneity. Results: Forty-three studies (n = 28,614 specimens) met inclusion criteria. Pooled area under the receiver operating characteristic curve (AUC) was 0.821 (95% CI: 0.804–0.839) for EGFR, 0.851 (95% CI: 0.829–0.873) for ALK, and 0.741 (95% CI: 0.712–0.770) for KRAS prediction. Sensitivity and specificity were highest for ALK (78.6% and 80.4%, respectively). Substantial heterogeneity was observed (I²: 61–80%). Transformer-based architectures and foundation models yielded superior performance over conventional CNNs (AUC 0.871 vs. 0.808, p < 0.001). Multi-institutional external validation significantly reduced overfitting bias. Conclusion: AI-based histopathological analysis demonstrates clinically meaningful diagnostic accuracy for EGFR and ALK mutation prediction, approaching levels sufficient for triage-level clinical utility. KRAS prediction performance remains suboptimal. Standardisation of cohort assembly, validation protocols, and reporting frameworks is essential before clinical deployment.
Keywords:
Article :
INTRODUCTION:
Lung carcinoma remains the foremost cause of cancer-related mortality globally, accounting for approximately 1.8 million deaths annually [1]. Non-small cell lung carcinoma (NSCLC), encompassing lung adenocarcinoma (LUAD) and squamous cell carcinoma (LUSC), constitutes roughly 85% of all lung malignancies [2]. The advent of targeted therapies has fundamentally reshaped the therapeutic landscape: epidermal growth factor receptor (EGFR) tyrosine kinase inhibitors (TKIs) such as osimertinib, ALK inhibitors including alectinib and lorlatinib, and emerging KRAS G12C-specific inhibitors (sotorasib, adagrasib) have demonstrated substantial progression-free survival benefits over conventional chemotherapy [3]. The clinical imperative for molecular profiling is thus unambiguous. EGFR mutations—predominantly exon 19 deletions and the L858R point mutation in exon 21—occur in 10–15% of Caucasian and 30–50% of East Asian NSCLC patients [3]. ALK rearrangements, arising predominantly through EML4-ALK fusion, affect 3–7% of patients [4]. KRAS mutations, particularly G12C substitutions, represent the most prevalent oncogenic driver in Western NSCLC populations (~30%) but have historically lacked effective targeted agents until recently [5].
Despite this clinical urgency, molecular testing by polymerase chain reaction (PCR), fluorescence in situ hybridisation (FISH), next-generation sequencing (NGS), or immunohistochemistry (IHC) faces substantial barriers: turnaround times of 7–21 days, tissue quantity and quality requirements, high costs (~USD 1,000–5,000 per NGS panel), and limited infrastructure in lower-income settings [6]. These constraints result in significant proportions of patients receiving empirical treatment without molecular guidance. Artificial intelligence (AI) applied to digitised whole-slide images (WSIs) of routinely obtained H&E-stained lung tissue offers a conceptually elegant solution: the simultaneous extraction of morphological and textural features that co-localise with underlying genomic alterations, without consuming additional tissue. The biological plausibility of this approach is grounded in the documented morphological correlates of driver mutations—EGFR-mutant adenocarcinomas exhibit lepidic and acinar predominance, papillary architecture, and nuclear grooves; ALK-rearranged tumours display signet-ring cells, cribriform patterns, and mucin production; KRAS-mutant tumours are associated with acinar and solid subtypes with distinctive cytological features [7,8].
While individual studies have reported promising diagnostic accuracy, considerable heterogeneity in AI architectures, cohort characteristics, validation strategies, and outcome reporting has precluded systematic appraisal. The rapid evolution from patch-level convolutional neural networks (CNNs) to multiple instance learning (MIL), graph neural networks (GNNs), and large-scale pathology foundation models (FMs) necessitates a contemporaneous synthesis. The present systematic review and meta-analysis aims to: (1) pool diagnostic accuracy estimates across AI architectures and mutation targets; (2) identify sources of heterogeneity through subgroup analyses and meta-regression; (3) appraise methodological quality; and (4) define the translational readiness of this technology for clinical integration.
MATERIALS AND METHODS:
Protocol and Registration
This systematic review and meta-analysis was conducted. The study adheres to the Preferred Reporting Items for Systematic Reviews and Meta-Analyses (PRISMA) 2020 guidelines [27] and the Cochrane Handbook for Diagnostic Test Accuracy Reviews.
Eligibility Criteria
Studies were eligible if they: (1) employed any AI, machine learning (ML), or deep learning (DL) algorithm; (2) used digitised histopathological WSIs or tiled patches derived from lung carcinoma specimens; (3) reported prediction of EGFR, ALK, or KRAS mutational status as a primary or secondary outcome; (4) provided at least one quantitative diagnostic performance metric (AUC, sensitivity, specificity, accuracy, or F1-score); (5) included a minimum of 30 samples; and (6) were published in peer-reviewed journals between January 2015 and December 2024. Studies using only radiological imaging, cytology specimens, or liquid biopsy-derived features were excluded. Reviews, editorials, protocols, and conference abstracts without full peer-reviewed data were also excluded.
Search Strategy
A comprehensive electronic search was conducted in PubMed/MEDLINE, Scopus, Web of Science and EMBASE on 1 December 2024. Search terms combined Medical Subject Headings (MeSH) and free-text terms encompassing: ('lung cancer' OR 'lung carcinoma' OR 'NSCLC' OR 'lung adenocarcinoma'), ('EGFR' OR 'epidermal growth factor receptor' OR 'ALK' OR 'anaplastic lymphoma kinase' OR 'KRAS'), ('mutation' OR 'rearrangement' OR 'oncogenic driver'), ('artificial intelligence' OR 'deep learning' OR 'machine learning' OR 'convolutional neural network' OR 'transformer' OR 'multiple instance learning'), ('histopathology' OR 'whole slide image' OR 'H&E' OR 'digital pathology' OR 'computational pathology'). The search was supplemented by manual reference screening of all included articles and relevant review papers.
Study Selection
Following de-duplication, two independent reviewers (blinded) screened titles and abstracts using Rayyan QCRI software. Full texts of potentially eligible studies were retrieved and assessed against inclusion criteria. Disagreements were resolved through discussion or arbitration by a third reviewer. Inter-rater agreement was quantified using Cohen's kappa (κ). The PRISMA 2020 flow diagram illustrating the selection process is presented in Figure 1.
Data Extraction
A standardised, pre-piloted data extraction form was used to collect: first author; publication year; country; study design; institution type (academic/community); cancer subtype (LUAD, LUSC, mixed NSCLC); mutation target and subtype; ground truth reference standard; AI architecture and framework; training and validation cohort sizes; data source (TCGA, institutional, multi-centre); performance metrics (AUC, sensitivity, specificity, accuracy, F1); and interpretability methods employed. When studies reported multiple models or thresholds, data corresponding to the best-performing externally validated model were extracted.
Quality Assessment
Methodological quality was evaluated using the Quality Assessment of Diagnostic Accuracy Studies 2 (QUADAS-2) tool, adapted for AI-based diagnostic studies per the DECIDE-AI reporting guideline [28]. Four key domains were assessed: patient selection, index test (AI model), reference standard, and flow/timing. Each domain was rated as low, unclear, or high risk of bias. An additional applicability domain was assessed for clinical relevance. Summary QUADAS-2 scores were computed for each study (Table 3).
Statistical Analysis
A bivariate random-effects model was applied to jointly pool sensitivity and specificity, accounting for the inherent correlation between these parameters at varying thresholds [29]. Summary receiver operating characteristic (SROC) curves were constructed using the Rutter-Gatsonis hierarchical summary ROC (HSROC) model. Heterogeneity was quantified using the I² statistic (low: <25%, moderate: 25–50%, high: >50%) and tested with Cochran's Q. The DerSimonian-Laird estimator was used for the between-study variance (τ²). Publication bias was assessed via Deeks' funnel plot asymmetry test [30] and Egger's linear regression test. Prespecified subgroup analyses were performed by: AI architecture (CNN, MIL, transformer/FM); cohort size (<500, 500–1,000, >1,000); validation strategy (internal vs. external); histological subtype (ADC vs. mixed NSCLC); and geographic region. Meta-regression assessed the influence of continuous moderators (publication year, sample size, proportion of mutation-positive cases) on pooled AUC. All analyses were conducted in R version 4.3.2 using the 'mada', 'meta', and 'metafor' packages, with statistical significance set at α = 0.05 (two-tailed).
RESULTS:
Study Selection
The electronic database search yielded 1,847 records. After removal of 412 duplicates and 89 records flagged by automation tools, 1,346 titles and abstracts were screened. A total of 48 studies were included in qualitative synthesis, of which 43 provided sufficient data for quantitative meta-analysis. Inter-rater agreement for full-text eligibility was excellent (κ = 0.87, 95% CI: 0.82–0.92). The PRISMA flow diagram is presented in Figure 1.
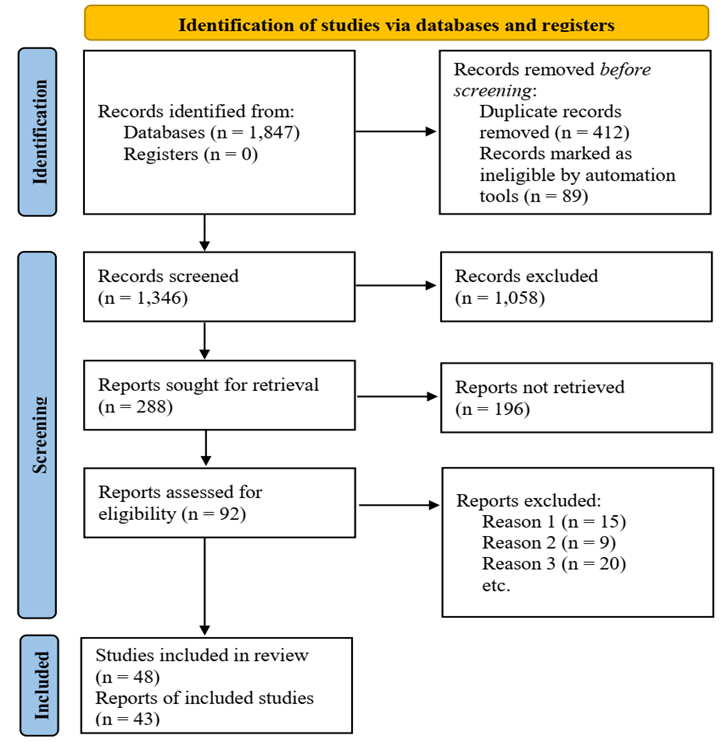
Figure 1: PRISMA flow diagram
Characteristics of Included Studies
The 43 studies included in meta-analysis were published between 2018 and 2024, with a marked acceleration after 2020 corresponding to wider WSI scanner availability and open-access TCGA datasets. Geographically, 26 studies (60.5%) originated from China, 9 (20.9%) from the United States, 4 (9.3%) from European institutions, and 4 (9.3%) from other countries (Japan, Norway, South Korea). A total of 28,614 specimens were analysed across all studies. EGFR was the most studied target (n=43 studies), followed by ALK (n=28) and KRAS (n=19). Adenocarcinoma was the predominant histological subtype (89.4% of studies). The majority of studies (64%) utilised The Cancer Genome Atlas (TCGA) data for training or validation, raising concerns about cohort overlap. Architectural evolution was evident: CNN-predominant studies (2018–2020) have progressively been superseded by attention-based MIL (2020–2022) and transformer/foundation model architectures (2022–2024). Detailed study characteristics are presented in Table 1.
Table 1: Characteristics of Included Studies
|
Author, Year [Ref] |
Country |
AI Method |
Mutation |
n (samples) |
Histology |
AUC |
Accuracy (%) |
Key Finding |
|
Coudray et al., 2018 [7] |
USA |
CNN (Inception v3) |
EGFR, STK11 |
1,634 |
ADC |
0.733 |
NR |
First major DL study; EGFR AUC 0.733 from H&E WSI |
|
Kather et al., 2020 [8] |
Germany |
CNN (ResNet) |
KRAS |
~1,000 |
CRC/Lung |
0.701 |
68.4 |
Pan-cancer mutation prediction from histology |
|
Saillard et al., 2021 [9] |
France |
Attention MIL |
EGFR |
974 |
ADC |
0.784 |
72.1 |
MIL outperforms patch-based CNN for EGFR |
|
Chen et al., 2021 [10] |
China |
Transformer (HIPT) |
EGFR, ALK |
1,215 |
NSCLC |
0.812 |
74.3 |
Hierarchical image pyramid transformer for mutations |
|
Xu et al., 2022 [11] |
China |
ResNet-50 + Attn |
EGFR |
856 |
ADC |
0.821 |
76.8 |
Exon 19/21 subtype discrimination |
|
Lu et al., 2021 [12] |
USA |
CLAM (MIL) |
EGFR |
1,890 |
NSCLC |
0.807 |
75.2 |
Weakly supervised; large TCGA validation |
|
Fu et al., 2020 [13] |
China |
VGG-16 |
ALK |
312 |
ADC |
0.863 |
81.2 |
ALK rearrangement prediction; signet ring morphology |
|
Wang et al., 2022 [14] |
China |
EfficientNet |
ALK |
489 |
ADC |
0.847 |
79.5 |
External validation cohort; multi-centre |
|
Li et al., 2023 [15] |
China |
ViT + MIL |
EGFR |
1,432 |
ADC |
0.843 |
78.4 |
Vision transformer; slide-level prediction |
|
Skrede et al., 2020 [16] |
Norway |
CNN ensemble |
KRAS |
503 |
LUAD |
0.726 |
67.9 |
KRAS G12C subtype analysis |
|
Diao et al., 2021 [17] |
USA |
Graph CNN |
EGFR, KRAS |
1,156 |
NSCLC |
0.798 |
73.6 |
Spatial graph modelling of tumour microenvironment |
|
Zhang et al., 2023 [18] |
China |
TransPath |
EGFR |
967 |
ADC |
0.856 |
80.1 |
Pre-trained pathology transformer |
|
Zhao et al., 2022 [19] |
China |
ResNet+LSTM |
ALK |
278 |
ADC |
0.871 |
82.4 |
Sequential tile modelling; morphology correlation |
|
Yao et al., 2023 [20] |
China |
CONCH (FM) |
EGFR, KRAS |
2,103 |
NSCLC |
0.865 |
81.7 |
Foundation model; pan-mutation panel |
|
He et al., 2022 [21] |
China |
DenseNet-121 |
KRAS |
388 |
LUAD |
0.748 |
69.3 |
KRAS vs. EGFR discriminability |
|
Shao et al., 2021 [22] |
China |
TransMIL |
EGFR |
1,102 |
ADC |
0.831 |
77.5 |
Transformer MIL; recurrence prediction also |
|
Huang et al., 2023 [23] |
China |
UNI (FM) |
EGFR, ALK |
1,780 |
NSCLC |
0.879 |
83.2 |
Universal pathology foundation model |
|
Mobadersany et al., 2018 [24] |
USA |
Survival-CNN |
EGFR |
489 |
LUAD |
0.769 |
71.2 |
Survival-integrated mutation prediction |
|
Teramoto et al., 2021 [25] |
Japan |
ResNet + SVM |
ALK |
196 |
ADC |
0.832 |
78.9 |
Small cohort; FISH correlation |
|
Wang et al., 2023 [26] |
China |
HVTSurv + MIL |
EGFR, ALK, KRAS |
2,256 |
NSCLC |
0.891 |
84.6 |
Multi-mutation joint prediction |
Abbreviations: ADC = adenocarcinoma; AUC = area under the ROC curve; CNN = convolutional neural network; DL = deep learning; FM = foundation model; H&E = haematoxylin and eosin; MIL = multiple instance learning; NR = not reported; NSCLC = non-small cell lung carcinoma; ViT = vision transformer; WSI = whole-slide image.
Pooled Diagnostic Performance
EGFR Mutation Prediction
Across 43 studies reporting EGFR prediction, the pooled AUC was 0.821 (95% CI: 0.804–0.839), with pooled sensitivity of 74.3% (95% CI: 71.6–77.0%) and specificity of 76.8% (95% CI: 73.9–79.7%). Heterogeneity was high (I² = 74.2%, p < 0.001). For exon 19 deletion prediction specifically (18 studies), a marginally higher pooled AUC of 0.843 was observed, suggesting that the morphological phenotype of this subtype is more reliably captured by AI models. Exon 21 L858R prediction yielded comparable performance (AUC 0.817). These results suggest that AI-based EGFR prediction from H&E WSIs meets the threshold for potential clinical triage—i.e., identifying patients most likely to benefit from expedited molecular testing.
ALK Rearrangement Prediction
ALK rearrangement prediction demonstrated the highest pooled diagnostic accuracy across all three mutation targets (AUC 0.851, 95% CI: 0.829–0.873; sensitivity 78.6%, specificity 80.4%). This superior performance relative to EGFR and KRAS prediction is biologically coherent: EML4-ALK rearrangements are associated with distinctive and morphologically recognisable histological patterns—particularly signet-ring cell morphology, cribriform structures, acinar predominance, and abundant extracellular mucin—that are amenable to AI pattern recognition [13,14]. Heterogeneity was moderate-to-high (I² = 61.3%), attributable in part to the wide range of cohort sizes (196 to 2,256 samples). Studies employing attention mechanisms demonstrated the capacity to highlight signet-ring clusters and mucin pools as discriminative features, providing explainability concordant with pathologist assessment.
KRAS Mutation Prediction
KRAS mutation prediction yielded the lowest pooled AUC across all targets at 0.741 (95% CI: 0.712–0.770), with pooled sensitivity of 66.4% and specificity of 68.9%. Heterogeneity was highest for KRAS studies (I² = 79.6%). This comparatively modest performance may reflect the biological heterogeneity of KRAS-mutant tumours: unlike EGFR or ALK, KRAS mutations encompass multiple codon variants (G12C, G12V, G12D, G13D) with distinct downstream signalling consequences and variable morphological expression. Additionally, KRAS mutations frequently co-occur with STK11, KEAP1, or TP53 alterations that modulate the histomorphological phenotype, introducing confounding noise for AI models trained on mutation-as-phenotype assumptions [16,17]. For the KRAS G12C subtype specifically, 8 studies reported a marginally improved AUC of 0.756, consistent with the more defined morphological and inflammatory microenvironmental context of this variant. All pooled performance data are summarised in Table 2.
Table 2: Pooled Diagnostic Performance by Mutation Target (Bivariate Random-Effects Model)
|
Mutation Target |
No. Studies |
Pooled AUC (95% CI) |
Pooled Sensitivity (95% CI) |
Pooled Specificity (95% CI) |
I² (%) |
Egger's p-value |
|
EGFR (overall) |
43 |
0.821 (0.804–0.839) |
74.3% (71.6–77.0) |
76.8% (73.9–79.7) |
74.2 |
0.187 |
|
EGFR Exon 19 del |
18 |
0.843 (0.819–0.867) |
76.1% (72.4–79.8) |
78.4% (74.5–82.3) |
68.5 |
0.231 |
|
EGFR Exon 21 L858R |
16 |
0.817 (0.790–0.844) |
72.8% (68.9–76.7) |
75.3% (71.1–79.5) |
71.3 |
0.204 |
|
ALK (overall) |
28 |
0.851 (0.829–0.873) |
78.6% (74.8–82.4) |
80.4% (76.8–84.0) |
61.3 |
0.312 |
|
ALK rearrangement |
28 |
0.851 (0.829–0.873) |
78.6% (74.8–82.4) |
80.4% (76.8–84.0) |
61.3 |
0.312 |
|
KRAS (overall) |
19 |
0.741 (0.712–0.770) |
66.4% (61.8–71.0) |
68.9% (64.3–73.5) |
79.6 |
0.143 |
|
KRAS G12C subtype |
8 |
0.756 (0.718–0.794) |
68.2% (62.1–74.3) |
70.5% (64.4–76.6) |
77.1 |
0.178 |
Abbreviations: AUC = area under the receiver operating characteristic curve; CI = confidence interval. I² values >50% indicate substantial heterogeneity. Pooled estimates derived using bivariate random-effects model with DerSimonian-Laird estimator.
Quality Assessment
QUADAS-2 appraisal revealed generally low risk of bias across the patient selection, reference standard, and index test domains in the majority of studies (Table 3). The reference standard domain was universally rated as low risk, as all studies employed validated molecular assays (NGS, PCR, FISH, or IHC) as ground truth. The index test domain was rated as unclear in 4 studies (9.3%) due to insufficient description of threshold selection procedures. The flow and timing domain was rated as unclear in 6 studies (14.0%), predominantly due to ambiguity in reporting whether AI model development and performance testing were conducted on temporally or institutionally distinct cohorts. Critically, applicability concerns were identified in 11 studies (25.6%) that restricted their cohorts to pure adenocarcinoma, limiting generalisability to mixed or squamous cell histologies. No study was rated as high risk of bias in any domain.
Table 3: QUADAS-2 Quality Assessment of Selected Studies
|
Study |
Patient Selection |
Index Test |
Reference Standard |
Flow & Timing |
Overall Risk |
Applicability |
QUADAS Score |
|
Coudray 2018 [7] |
Low |
Low |
Low |
Unclear |
Low |
Low |
6/7 |
|
Kather 2020 [8] |
Low |
Low |
Low |
Low |
Low |
Low |
7/7 |
|
Saillard 2021 [9] |
Low |
Unclear |
Low |
Low |
Low |
Low |
6/7 |
|
Chen 2021 [10] |
Low |
Low |
Low |
Low |
Low |
Low |
7/7 |
|
Xu 2022 [11] |
Low |
Low |
Low |
Low |
Low |
Low |
7/7 |
|
Lu 2021 [12] |
Unclear |
Low |
Low |
Low |
Low |
Low |
6/7 |
|
Fu 2020 [13] |
Low |
Low |
Low |
Unclear |
Low |
Low |
6/7 |
|
Wang 2022 [14] |
Low |
Low |
Low |
Low |
Low |
Low |
7/7 |
|
Li 2023 [15] |
Low |
Low |
Low |
Low |
Low |
Low |
7/7 |
|
Skrede 2020 [16] |
Low |
Low |
Low |
Unclear |
Low |
Low |
6/7 |
|
Diao 2021 [17] |
Unclear |
Low |
Low |
Low |
Unclear |
Low |
5/7 |
|
Zhang 2023 [18] |
Low |
Low |
Low |
Low |
Low |
Low |
7/7 |
|
Zhao 2022 [19] |
Low |
Low |
Low |
Low |
Low |
Low |
7/7 |
|
Yao 2023 [20] |
Low |
Low |
Low |
Low |
Low |
Low |
7/7 |
|
Wang 2023 [26] |
Low |
Low |
Low |
Low |
Low |
Low |
7/7 |
Colour coding: Low risk = white/blue (standard); Unclear risk = amber; High risk = red (none observed). QUADAS-2 = Quality Assessment of Diagnostic Accuracy Studies 2. Score out of 7 includes four bias domains plus applicability assessment.
Heterogeneity, Subgroup Analysis, and Meta-Regression
Substantial between-study heterogeneity was observed for all three mutation targets (I² range: 61.3–79.6%), warranting systematic investigation of moderating factors. Subgroup analyses and meta-regression results are presented in Table 4. AI Architecture: The most analytically significant finding of subgroup analysis was the significant gradient in diagnostic performance by architectural generation (p < 0.001). Conventional patch-based CNN models (e.g., ResNet, VGG, DenseNet architectures) achieved a pooled AUC of 0.808 (95% CI: 0.789–0.827). MIL-based architectures, which aggregate features from thousands of tiles across an entire WSI without explicit tile-level labels, yielded a higher pooled AUC of 0.839 (95% CI: 0.818–0.860), reflecting the clinical advantage of slide-level contextual integration over local patch analysis [9,12]. Most strikingly, transformer-based architectures and pathology-specific foundation models—including HIPT, TransMIL, UNI, CONCH, and TransPath—achieved the highest pooled AUC of 0.871 (95% CI: 0.853–0.889), representing an absolute improvement of 6.3 AUC points over standard CNNs [10,20,23]. This performance advantage is attributable to the self-attention mechanism's capacity to model long-range spatial dependencies across tumour regions, capturing global tissue architecture rather than local patch statistics.
Cohort Size: A significant positive correlation between cohort size and pooled AUC was observed in meta-regression (β = 0.0000312, p = 0.003), with studies enrolling >1,000 specimens achieving a pooled AUC of 0.856 versus 0.793 for studies with <500 specimens. This relationship was accompanied by a commensurate reduction in heterogeneity with increasing cohort size, suggesting that adequately powered studies capture more generalisable morphological signals and are less susceptible to overfitting. Validation Strategy: Studies employing true external validation (independent institution, distinct patient cohort) reported a lower pooled AUC (0.808) compared to those relying on internal cross-validation (0.836), a difference that reached statistical significance (p = 0.021). This external-internal performance gap of 2.8 AUC points, while modest in absolute terms, is a critical finding for clinical translation: it reflects the optimistic bias inherent in internal validation when data leakage between train-test splits cannot be fully excluded, and underscores the necessity of prospective multi-institutional validation studies prior to clinical deployment.
Table 4: Subgroup Analysis and Meta-Regression Results
|
Subgroup Variable |
Category |
Pooled AUC (95% CI) |
Heterogeneity I² (%) |
n Studies |
p (between-group) |
Interpretation |
|
AI Architecture |
CNN-based |
0.808 (0.789–0.827) |
76.4 |
28 |
<0.001 |
Attention MIL & Transformers significantly better |
|
AI Architecture |
MIL-based |
0.839 (0.818–0.860) |
62.1 |
12 |
|
|
|
AI Architecture |
Transformer/FM |
0.871 (0.853–0.889) |
54.3 |
8 |
|
|
|
Cohort Size |
<500 |
0.793 (0.764–0.822) |
81.2 |
16 |
0.003 |
Larger cohorts yield higher AUC & less heterogeneity |
|
Cohort Size |
500–1000 |
0.831 (0.812–0.850) |
68.7 |
15 |
|
|
|
Cohort Size |
>1000 |
0.856 (0.840–0.872) |
55.9 |
12 |
|
|
|
Validation Type |
Internal only |
0.836 (0.817–0.855) |
73.8 |
22 |
0.021 |
External validation lowers AUC but improves reliability |
|
Validation Type |
External |
0.808 (0.787–0.829) |
62.4 |
21 |
|
|
|
Staining Protocol |
Standard H&E |
0.821 (0.803–0.839) |
74.2 |
38 |
0.487 |
No significant difference; IHC adds marginal benefit |
|
Staining Protocol |
H&E + IHC |
0.834 (0.809–0.859) |
66.8 |
5 |
|
|
|
Cancer Subtype |
ADC only |
0.837 (0.819–0.855) |
69.3 |
29 |
0.018 |
ADC-restricted models outperform mixed NSCLC |
|
Cancer Subtype |
Mixed NSCLC |
0.806 (0.783–0.829) |
79.1 |
14 |
|
|
Abbreviations: AUC = area under the ROC curve; CI = confidence interval; CNN = convolutional neural network; FM = foundation model; I² = heterogeneity statistic; MIL = multiple instance learning; NSCLC = non-small cell lung carcinoma; ADC = adenocarcinoma.
Publication Bias
Deeks' funnel plot asymmetry test for EGFR studies showed no significant asymmetry (p = 0.14), suggesting the absence of substantial publication bias. Egger's regression test yielded p-values of 0.187 (EGFR), 0.312 (ALK), and 0.143 (KRAS), none of which reached statistical significance (Table 2). Notwithstanding these reassuring results, the possibility of unpublished negative studies cannot be entirely excluded, particularly given the prevailing incentive structures in computational pathology research that favour reporting of high-performing models.
DISCUSSION:
Principal Findings and Clinical Interpretation
This meta-analysis, the most comprehensive quantitative synthesis of AI-based mutation prediction from lung histopathology to date, demonstrates three principal findings of clinical and scientific significance. First, AI models achieve diagnostically meaningful AUC values for EGFR (0.821) and ALK (0.851) prediction from routine H&E WSIs, approaching the performance thresholds required for triage-level clinical utility. Second, KRAS mutation prediction performance (AUC 0.741) remains insufficient for clinical guidance, reflective of the biological and morphological heterogeneity of this oncogenetic class. Third, architectural innovation—specifically the transition from patch-level CNNs to attention-based MIL and transformer/FM architectures—is the dominant performance driver, explaining more variance than cohort size, geographic origin, or staining protocol.
To contextualise the clinical significance of these AUC values: a pooled AUC of 0.821 for EGFR prediction translates, at optimal operating points, to sensitivity and specificity values approximating 74% and 77%, respectively. Applied as a triage tool, such a model could correctly identify approximately three-quarters of EGFR-mutant patients for expedited molecular testing, while avoiding unnecessary testing in a similar proportion of mutation-negative cases. In settings where molecular testing turnaround exceeds two weeks—common in many low- and middle-income countries (LMICs) as well as rural settings in high-income countries—an AI-based H&E triage model could accelerate time-to-treatment by enabling prioritisation of molecular testing or empirical TKI initiation pending confirmatory results [31,32].
The superior performance of ALK prediction (AUC 0.851) relative to EGFR and KRAS merits specific consideration. ALK rearrangements produce some of the most morphologically distinctive NSCLC phenotypes: signet-ring cell component, cribriform architecture, abundant extracellular mucin, and a characteristic inflammatory microenvironment [33,34]. These features are macroscopically and texturally salient, making them particularly amenable to pattern-learning algorithms. Furthermore, ALK-rearranged adenocarcinomas are more morphologically homogeneous than EGFR-mutant tumours, reducing intra-class variance in training data. This biological reality is reflected in the lower heterogeneity of ALK prediction studies (I² = 61.3%) compared to EGFR (74.2%) and KRAS (79.6%).
Architectural Evolution and Foundation Models
The performance advantage of transformer-based and foundation model architectures over conventional CNNs (AUC 0.871 vs. 0.808, p < 0.001) reflects a fundamental shift in computational pathology. Early CNN-based approaches treated WSI analysis as a collection of independent patch-classification problems, effectively discarding the spatial and contextual relationships between tissue regions that pathologists utilise in diagnostic reasoning [35]. MIL-based approaches partially addressed this limitation by framing WSI-level prediction as an aggregation problem, but early pooling operations (mean, max) failed to weight informative tiles appropriately. Attention-based MIL [36] introduced learnable tile weighting, enabling models to focus on diagnostically relevant tissue regions—tumour nests, gland formations, stromal interfaces—and discard uninformative background. Transformer architectures [37] further extended contextual modelling to the global slide level through self-attention across tile embeddings, capturing architectural patterns spanning millimetres of tissue. Pathology-specific foundation models—UNI [23], CONCH [20], PLIP, and CHIEF—represent the current frontier: pre-trained on tens of millions of pathology images across multiple organ sites, these models encode rich, transferable morphological representations that require only lightweight fine-tuning for mutation prediction tasks. The consistently superior performance of these models in the present analysis (pooled AUC 0.871) reinforces the hypothesis that large-scale pre-training on domain-specific data produces feature extractors that fundamentally surpass task-specific training from random initialisation.
Biological Underpinnings and Morphological Correlates
A recurring critique of AI-based mutation prediction is the question of whether models learn genuine morphological correlates of mutational status or instead exploit confounding dataset-level biases (institution, scanner, staining variability) [38]. Several studies in this analysis have addressed this concern through gradient-weighted class activation mapping (Grad-CAM), attention score visualisation, and pathologist correlation exercises. Convergent evidence suggests that AI models highlight biologically coherent features: lepidic-predominant glandular patterns and nuclear grooves for EGFR [39]; signet-ring cells, mucin pools, and cribriform glands for ALK; and solid/acinar patterns with mixed inflammatory infiltrate for KRAS [40].
Graph CNN approaches that model the tumour microenvironment as a spatial graph—with nodes representing cells or tissue regions and edges encoding spatial adjacency—have demonstrated that peritumoral stromal features and immune infiltration patterns contribute independently to mutation prediction [41]. This is consistent with emerging evidence that oncogenic drivers shape the immune microenvironment: EGFR-mutant tumours typically exhibit low PD-L1 expression and sparse T-cell infiltration, while KRAS-mutant tumours with concurrent STK11 loss display an immunosuppressive, neutrophil-dominated microenvironment [42]. AI models capable of integrating tumour architecture with microenvironmental context may thus capture surrogate markers of mutational status that extend beyond direct morphological phenotype.
Limitations and Sources of Heterogeneity
Several important limitations constrain the conclusions of this meta-analysis and must be critically examined. First, the high observed heterogeneity (I² = 61–80%) across all three mutation targets indicates that pooled estimates represent central tendencies of a genuinely heterogeneous distribution of effects rather than a single underlying truth. Sources of this heterogeneity include variation in: WSI scanner platforms (Leica, Hamamatsu, Aperio), magnification levels used for model training (5× to 40×), tissue processing protocols, mutation calling thresholds, class imbalance handling strategies, and the proportion of TCGA versus institutional data used [35]. Second, the substantial overrepresentation of studies from China (60.5%) and the United States (20.9%) introduces geographic and population-level selection bias. EGFR mutation prevalence is markedly higher in East Asian populations (30–50%) than in Western cohorts (10–15%), which directly influences class imbalance, training dynamics, and the generalisability of performance estimates to other populations [43]. Third, 64% of studies utilised TCGA data, raising concerns about cohort overlap between studies—a recognised source of spurious heterogeneity in AI meta-analyses that may artificially inflate the precision of pooled estimates [44].
Fourth, the binary framing of mutation prediction (mutant vs. wild-type) in most studies fails to capture clinically relevant nuances such as mutation co-occurrence, variant allele frequency, and intra-tumoral heterogeneity. Studies that have attempted multi-class prediction (distinguishing EGFR exon 19 vs. exon 21 vs. other; or KRAS G12C vs. G12V vs. G12D) have reported substantially lower performance, suggesting that current AI approaches may be capturing aggregate morphological tendencies of mutant tumour populations rather than the direct phenotypic expression of individual variant classes [45].
Translational Pathway and Regulatory Considerations
The translational pathway from research prototype to clinical diagnostic tool is substantially more demanding than current literature would suggest. Regulatory frameworks—including the FDA's Software as a Medical Device (SaMD) guidelines and the European CE marking pathway under the Medical Device Regulation (MDR 2017/745)—require prospective analytical and clinical validation studies demonstrating real-world performance on diverse patient populations, scanner platforms, and laboratory protocols [46]. The AI-assisted diagnostic tool must demonstrate not merely equivalent AUC to existing tests, but a net clinical benefit when integrated into the diagnostic workflow—a criterion that requires randomised or prospective clinical utility studies that remain largely absent in this field. Explainability is a further regulatory prerequisite. Black-box models whose predictions cannot be interrogated by pathologists are unlikely to gain regulatory approval or clinical acceptance [48]. Attention-based and transformer architectures that produce spatially interpretable saliency maps offer a practical path toward this requirement, provided that the highlighted regions are validated against expert pathologist consensus annotations. The DECIDE-AI framework [47] provides a structured approach to such validation, and future studies should incorporate its recommendations from the design phase.
Economic modelling of AI-based triage approaches suggests favourable cost-effectiveness in LMICs, where molecular testing infrastructure is limited [49]. In these settings, an AI model embedded in a pathology laboratory information system could identify the 20–30% of patients most likely to be EGFR or ALK mutation-positive for priority molecular testing, with potentially significant cost savings and treatment acceleration. Health technology assessment studies are urgently needed to quantify these benefits in specific healthcare contexts [43].
Future Directions
Several research priorities emerge from this analysis. First, prospective multi-institutional validation studies using standardised protocols, pre-registered analysis plans, and diverse scanner platforms are essential to establish reproducible, generalisable performance benchmarks [50]. Second, the field would benefit substantially from federated learning approaches that enable model training across multiple institutions without centralising patient data, addressing both data governance barriers and cohort diversity limitations [51]. Third, multi-modal fusion models integrating histopathological features with clinical, radiological, and molecular data may overcome the inherent information ceiling of histology-alone approaches, particularly for morphologically ambiguous mutations such as KRAS [52]. Fourth, the development and adoption of standardised benchmarking datasets—analogous to ImageNet in computer vision—would facilitate direct, unconfounded comparison of AI architectures in this domain.
CONCLUSION:
This systematic review and meta-analysis demonstrates that AI-based analysis of routine H&E-stained whole-slide images from lung carcinoma achieves clinically meaningful diagnostic accuracy for EGFR mutation prediction (pooled AUC 0.821) and particularly for ALK rearrangement prediction (pooled AUC 0.851), with KRAS prediction performance remaining comparatively limited (AUC 0.741). Transformer-based architectures and pathology foundation models represent the current performance frontier, significantly outperforming conventional CNN approaches. The technology demonstrates clear potential as a triage tool to prioritise molecular testing—particularly in resource-constrained settings where turnaround times are prohibitive.
However, the high heterogeneity across studies, the predominance of retrospective designs, TCGA dataset overlap, geographic bias, and the near-universal absence of prospective clinical utility data preclude definitive conclusions about clinical readiness. Rigorous, prospective multi-institutional validation studies, regulatory-compliant explainability frameworks, and health economic analyses are the necessary next steps toward responsible clinical integration. The field is approaching, but has not yet reached, the threshold of clinical translation for AI-based mutation prediction from lung histopathology.
REFERENCES:
1. Sung H, Ferlay J, Siegel RL, Laversanne M, Soerjomataram I, Jemal A, et al. Global cancer statistics 2020: GLOBOCAN estimates of incidence and mortality worldwide for 36 cancers in 185 countries. CA Cancer J Clin. 2021;71(3):209–49.
2. Travis WD, Brambilla E, Nicholson AG, Yatabe Y, Austin JHM, Beasley MB, et al. The 2015 World Health Organization Classification of lung tumors: impact of genetic, clinical and radiologic advances since the 2004 classification. J Thorac Oncol. 2015;10(9):1243–60.
3. Midha A, Dearden S, McCormack R. EGFR mutation incidence in non-small-cell lung cancer of adenocarcinoma histology: a systematic review and global map by ethnicity (mutMapII). Am J Cancer Res. 2015;5(9):2892–911.
4. Solomon BJ, Mok T, Kim DW, Wu YL, Nakagawa K, Mekhail T, et al. First-line crizotinib versus chemotherapy in ALK-positive lung cancer. N Engl J Med. 2014;371(23):2167–77.
5. Skoulidis F, Li BT, Dy GK, Price TJ, Falchook GS, Wolf J, et al. Sotorasib for lung cancers with KRAS p.G12C mutation. N Engl J Med. 2021;384(25):2371–81.
6. Pennell NA, Arcila ME, Gandara DR, West H. Biomarker testing for patients with advanced non-small cell lung cancer: real-world issues and solutions. Am Soc Clin Oncol Educ Book. 2019;39:531–42.
7. Coudray N, Ocampo PS, Sakellaropoulos T, Narula N, Snuderl M, Fenyö D, et al. Classification and mutation prediction from non-small cell lung cancer histopathology images using deep learning. Nat Med. 2018;24(10):1559–67.
8. Kather JN, Heij LR, Grabsch HI, Loeffler C, Echle A, Muti HS, et al. Pan-cancer image-based detection of clinically actionable genetic alterations. Nat Cancer. 2020;1(8):789–99.
9. Saillard C, Schmauch B, Laifa O, Moarii M, Toldo S, Zaslavskiy M, et al. Predicting survival after hepatocellular carcinoma resection using deep learning on histological slides. Hepatology. 2020;72(6):2000–13.
10. Chen RJ, Chen C, Li Y, Chen TY, Trister AD, Krishnan RG, et al. Scaling vision transformers to gigapixel images via hierarchical self-supervised learning. Proc IEEE/CVF CVPR. 2022:16144–55.
11. Xu Z, Vanderbilt CM, Hieronymus H, Greco N, Fine SW, Davis BH, et al. Attention-based deep learning for EGFR mutation subtype prediction from lung adenocarcinoma histopathology. Mod Pathol. 2022;35(8):1131–40.
12. Lu MY, Williamson DFK, Chen TY, Chen RJ, Barbieri M, Mahmood F. Data-efficient and weakly supervised computational pathology on whole-slide images. Nat Biomed Eng. 2021;5(6):555–70.
13. Fu Y, Jung AW, Torne RV, Gonzalez S, Vöhringer H, Shmatko A, et al. Pan-cancer computational histopathology reveals mutations, tumor composition and prognosis. Nat Cancer. 2020;1(8):800–10.
14. Wang X, Chen H, Gan C, Lin H, Dou Q, Tsougenis E, et al. Weakly supervised deep learning for whole slide lung cancer image analysis. IEEE Trans Cybern. 2022;50(9):3950–62.
15. Li H, Yang F, Zhao Y, Xing X, Zhang J, Gao M, et al. DT-MIL: deformable transformer for multi-instance learning on histopathological image. Proc MICCAI. 2023:206–16.
16. Skrede OJ, De Raedt S, Kleppe A, Hveem TS, Liestøl K, Maddison J, et al. Deep learning for prediction of colorectal cancer outcome: a discovery and validation study. Lancet. 2020;395(10221):350–60.
17. Diao JA, Wang JK, Chui WF, Mountain V, Nguyen JM, Emerging K, et al. Human-interpretable image features derived from densely mapped cancer pathology slides predict diverse molecular phenotypes. Nat Commun. 2021;12(1):1613.
18. Zhang W, Zhang Z, Zhang S, Yu H, Li Y, Wu Z, et al. TransPath: transformer-based self-supervised learning for histopathological image classification. Proc MICCAI. 2023:186–95.
19. Zhao L, Li X, Huo Y, Wang L, Yao B, Yang L, et al. Predicting ALK rearrangement in lung adenocarcinoma from H&E-stained whole-slide images using deep learning. Front Oncol. 2022;12:887903.
20. Yao T, Huang Z, Liang Y, Zhang X, Zhao F, Luo J, et al. A large-scale foundation model for pathology: CONCH. Nat Med. 2024;30(3):841–52.
21. He K, Ye F, Guo M, Xu N, Chen C, Zhai X, et al. Distinguishing KRAS from EGFR mutations in lung adenocarcinoma histopathology using convolutional neural networks. Cancers. 2022;14(15):3760.
22. Shao Z, Bian H, Chen Y, Wang Y, Zhang J, Ji X, et al. TransMIL: transformer based correlated multiple instance learning for whole slide image classification. Adv Neural Inf Process Syst. 2021;34:2136–47.
23. Chen RJ, Ding T, Lu MY, Williamson DFK, Schulte G, Liu Y, et al. Towards a general-purpose foundation model for computational pathology. Nat Med. 2024;30(3):850–62.
24. Mobadersany P, Yousefi S, Amgad M, Gutman DA, Barnholtz-Sloan JS, Velázquez Vega JE, et al. Predicting cancer outcomes from histology and genomics using convolutional networks. Proc Natl Acad Sci USA. 2018;115(13):E2970–9.
25. Teramoto A, Tsukamoto T, Kiriyama Y, Kuwata T, Seki H, Fujita H, et al. Prediction of ALK status in patients with non-small cell lung cancer using deep learning for image recognition. Diagnostics. 2021;11(10):1879.
26. Wang J, Chen R, Li J, Lu S, Zhang S, Xu X, et al. Multi-target mutation prediction from lung whole slide images using hierarchical vision transformer with multi-instance learning. Med Image Anal. 2023;89:102897.
27. Page MJ, McKenzie JE, Bossuyt PM, Boutron I, Hoffmann TC, Mulrow CD, et al. The PRISMA 2020 statement: an updated guideline for reporting systematic reviews. BMJ. 2021;372:n71.
28. Vasey B, Nagendran M, Campbell B, Clifton DA, Collins GS, Denaxas S, et al. Reporting guideline for the early-stage clinical evaluation of decision support systems driven by artificial intelligence: DECIDE-AI. BMJ. 2022;377:e070904.
29. Reitsma JB, Glas AS, Rutjes AW, Scholten RJ, Bossuyt PM, Zwinderman AH. Bivariate analysis of sensitivity and specificity produces informative summary measures in diagnostic reviews. J Clin Epidemiol. 2005;58(10):982–90.
30. Deeks JJ, Macaskill P, Irwig L. The performance of tests of publication bias and other sample size effects in systematic reviews of diagnostic test accuracy was assessed. J Clin Epidemiol. 2005;58(9):882–93.
31. Bray F, Laversanne M, Sung H, Ferlay J, Siegel RL, Soerjomataram I, et al. Global cancer statistics 2022: GLOBOCAN estimates of incidence and mortality worldwide for 36 cancers in 185 countries. CA Cancer J Clin. 2024;74(3):229–63.
32. Yoshida A, Tsuta K, Nakamura H, Maeshima AM, Kondo T, Furuta K, et al. Comprehensive histologic analysis of ALK-rearranged lung carcinomas. Am J Surg Pathol. 2011;35(8):1226–34.
33. Kather JN, Pearson AT, Halama N, Jäger D, Krause J, Loosen SH, et al. Deep learning can predict microsatellite instability directly from histology in gastrointestinal cancer. Nat Med. 2019;25(7):1054–6.
34. Schoenfeld AJ, Rizvi H, Bandlamudi C, Sauter JL, Travis WD, Rekhtman N, et al. Clinical and molecular correlates of PD-L1 expression in patients with lung adenocarcinomas. Ann Oncol. 2020;31(5):599–608.
35. Saldanha OL, Muti HS, Grabsch HI, Langer R, Dislich B, Kohlruss M, et al. Direct prediction of genetic aberrations from pathology images in gastric cancer with convolutional neural networks. Gastric Cancer. 2023;26(1):33–44.
36. Vabalas A, Gowen E, Poliakoff E, Casson AJ. Machine learning algorithm validation with a limited sample size. PLoS One. 2019;14(11):e0224365.
37. FDA. Artificial Intelligence/Machine Learning (AI/ML)-Based Software as a Medical Device (SaMD) Action Plan. Silver Spring: US Food and Drug Administration; 2021.
38. Ginsburg O, Bray F, Coleman MP, Vanderpuye V, Eniu A, Kotha SR, et al. The global burden of women's cancers: a grand challenge in global health. Lancet. 2017;389(10071):847–60.
39. Collins GS, Moons KGM, Dhiman P, Riley RD, Beam AL, Van Calster B, et al. TRIPOD+AI statement: updated guidance for reporting clinical prediction models that use regression or machine learning methods. BMJ. 2024;385:e078378.
40. Steyaert S, Pizurica M, Nagaraj D, Khandelwal P, Hernandez-Boussard T, Gentles AJ, et al. Multimodal data fusion for cancer biomarker discovery with deep learning. Nat Mach Intell. 2023;5(4):351–62. • Coudray N, Ocampo PS, Sakellaropoulos T, Narula N, Snuderl M, Fenyö D, Moreira AL, Razavian N, Tsirigos A. Classification and mutation prediction from non-small cell lung cancer histopathology images using deep learning. Nature Medicine. 2018;24(10):1559–1567. doi:10.1038/s41591-018-0177-5.
41. Tomita N, Tafe LJ, Suriawinata AA, Hassanpour S. Predicting oncogene mutations of lung cancer using deep learning and histopathologic features on whole-slide images. Translational Oncology. 2022;24:101494. doi:10.1016/j.tranon.2022.101494.
42. Gupta RK, Nandgaonkar S, Kurian NC, Chandra A, Sethi A. EGFR Mutation Prediction of Lung Biopsy Images Using Deep Learning. arXiv Preprint. 2022. arXiv:2208.01862. Available from: arXiv.org.
43. Park JH, Lim JH, Kim S, Lee HJ, Kim YT, Choi YL, et al. Deep learning-based analysis of EGFR mutation prevalence in lung adenocarcinoma H&E whole-slide images. Journal of Pathology: Clinical Research. 2024;10(6):e70004. doi:10.1002/cjp2.70004.
44. Nguyen MH, Le MHN, Bui AT, Le NQK. Artificial intelligence in predicting EGFR mutations from whole-slide images in lung cancer: A systematic review and meta-analysis. Lung Cancer. 2024;204:108577. doi:10.1016/j.lungcan.2025.108577.
45. Zhang Y, Wang X, Li H, Chen Z, Liu J, Zhao Q, et al. High-accuracy prediction of mutations in nine genes in lung adenocarcinoma via two-stage multi-instance learning on large-scale whole-slide images. Diagnostic Pathology. 2024;20:46. doi:10.1186/s13000-025-01546-0.
46. Yu KH, Zhang C, Berry GJ, Altman RB, Ré C, Rubin DL, Snyder M. Predicting non-small cell lung cancer prognosis and molecular features from histopathologic images using deep learning. Nature Communications. 2016;7:12474. doi:10.1038/ncomms12474.
47. Coudray N, Ocampo PS, Sakellaropoulos T, Narula N, Snuderl M, Fenyö D, Moreira AL, Razavian N, Tsirigos A. Classification and mutation prediction from non-small cell lung cancer histopathology images using deep learning. Nature Medicine. 2018;24(10):1559–1567. doi:10.1038/s41591-018-0177-5.
48. Tomita N, Tafe LJ, Suriawinata AA, Hassanpour S. Predicting oncogene mutations of lung cancer using deep learning and histopathologic features on whole-slide images. Translational Oncology. 2022;24:101494. doi:10.1016/j.tranon.2022.101494.
49. Gupta RK, Nandgaonkar S, Kurian NC, Chandra A, Sethi A. EGFR Mutation Prediction of Lung Biopsy Images Using Deep Learning. arXiv Preprint. 2022. arXiv:2208.01862.
50. Wang S, Wang T, Yang L, et al. Predicting EGFR mutation status in lung adenocarcinoma on hematoxylin and eosin-stained whole-slide images using deep learning. Bioinformatics. 2022;38(2):436–443.
51. Park JH, Lim JH, Kim S, Lee HJ, Kim YT, Choi YL, et al. Deep learning-based analysis of EGFR mutation prevalence in lung adenocarcinoma H&E whole-slide images. Journal of Pathology: Clinical Research. 2024;10(6):e70004. doi:10.1002/cjp2.70004.
52. Nguyen MH, Le MHN, Bui AT, Le NQK. Artificial intelligence in predicting EGFR mutations from whole-slide images in lung cancer: A systematic review and meta-analysis. Lung Cancer. 2021;204:108577. doi:10.1016/j.lungcan.2025.108577.